Enhance Developer Productivity with the SPACE Framework in Bitbucket

June 13, 2023
#Reporting#Analytics#Bitbucket
11 min

Measuring developer productivity is a challenging task that goes beyond individual skills and the number of lines of code written. It encompasses a wide range of factors, and relying solely on a single metric or activity data cannot accurately reflect it. The SPACE framework was introduced to capture the main factors influencing developer productivity. It recognizes that productivity extends individual performance and metrics and offers five key dimensions for a comprehensive view.

In this article, we’ll cover what the SPACE framework is, explore its five key dimensions, and see how to implement it in Bitbucket.

What is the SPACE framework?

The SPACE framework is a complex approach to a comprehensive understanding of developer productivity. It was presented by a group of researchers from Microsoft, GitHub, and the University of Victoria and acknowledges that productivity extends beyond individual performance and metrics.

This framework helps organizations measure and optimize developers’ productivity by considering five key dimensions:

  • Satisfaction and well-being
  • Performance
  • Activity
  • Communication and collaboration
  • Efficiency and flow.

All these dimensions should be considered on three levels: Individual, team, and system.

SPACE metrics

Source: The SPACE of Developer Productivity.

Let’s explore these dimensions in more detail.

SPACE dimensions of developer productivity

Satisfaction and well-being

The level of developer satisfaction refers to how satisfied they feel with their work, team, equipment, and corporate culture. The level of well-being refers to their health, happiness, and work impact. Measuring satisfaction and well-being not only helps understand productivity but can also indicate potential burnout or poor performance. By monitoring these aspects, organizations can take measures like “mental health” days or extra vacation days to prevent burnout and improve overall well-being.

Surveys can often be very helpful in measuring the well-being and satisfaction of your employees.

Examples of metrics:

  • Employee satisfaction
  • Perception of code reviews
  • Satisfaction with engineering systems

Performance

Measuring software developers’ performance is challenging due to the difficulty in directly attributing individual contributions to product outcomes. A high quantity of code does not necessarily mean high-quality code, and neither does customer satisfaction always correlate with positive business outcomes. Therefore, evaluating performance in terms of outcomes rather than outputs is often a better approach. In the most simplistic view, software developer performance could be summarized as “Did the code written by the developer perform as expected?”

Examples of metrics:

  • Code review velocity
  • Story points shipped
  • Reliability
  • Feature usage
  • Customer satisfaction

Activity

Activity, measured as the count of actions or outputs, gives useful but limited insights into productivity, engineering systems, and team performance. However, developers engage in a wide range of complex and diverse activities that are difficult to measure comprehensively. While activity metrics can provide some understanding, they should always be combined with other dimensions to assess developer productivity. These metrics serve as starting points and must be customized according to organizational needs and development processes.

Example of metrics:

  • Number of code reviews completed
  • Coding time
  • # commits or lines of code
  • Frequency of deployments

Communication and collaboration

Effective communication and collaboration are vital for successful project development. Collaboration within and between teams, supported by high transparency and awareness of team member activities, dramatically impacts productivity. Informed teams tend to be more effective as they work on the right problems, generate innovative ideas, and make better decisions.

Example of metrics:

  • PR merge times
  • Quality of code reviews
  • Knowledge sharing
  • Onboarding time

Efficiency and flow

Efficiency and flow refer to how quickly progress can be made with minimal interruptions or delays. Individual efficiency is achieved by setting boundaries, reducing distractions, and optimizing software development flow. Team and system efficiency embodies the process of transforming software concepts into product deliveries while eliminating any delays or handoffs in this flow. Team flow can be monitored using DORA metrics such as deployment frequency or lead time for changes.

Example of metrics:

  • Code review timing
  • Lack of interruptions
  • Number of handoffs
  • Lead time for changes

How to use the SPACE metrics

Here are the best practices on how effectively implement the SPACE framework:

  1. Choose multiple metrics. To obtain a holistic view of developer productivity, it is important to include several metrics from multiple dimensions. The recommended number of dimensions is at least three. For example, if you track an activity metric, add metrics from other dimensions, perhaps performance and efficiency & flow. Avoid focusing on a single aspect and consider the broader impact on the entire system.
  2. Add perceptual measures. Include survey data to gain a comprehensive understanding of developers’ productivity. Perceptions provide valuable insights that cannot be obtained solely from system behavior.
  3. Avoid excessive metrics. Capturing too many metrics can lead to confusion and decreased motivation. Select a few metrics to maintain focus and set achievable improvement goals.
  4. Set important metrics. Choose metrics that align with organizational values and goals as they affect decision-making and individual behavior and indicate what is important.
  5. Protect privacy. When reporting metrics, respect developer privacy and share only anonymized and aggregated results. However, individual productivity analysis may be useful for developers, as it will assist them in optimizing their work and identifying inefficiencies.
  6. Consider norms and biases. Take into account that no metric is perfect, and some may have limitations or biases like cultural aspects or parental leave for metrics counted over a year. Consider these factors and the broader context when interpreting chosen metrics.

How to Implement the SPACE Framework in Bitbucket

Implementing the SPACE framework in Bitbucket can be facilitated using Awesome Graphs for Bitbucket. It is an on-prem solution that transforms invisible engineering activities into actionable insights and reports empowering managers and their teams to gain a deeper understanding of the development process and drive continuous improvement.

Awesome Graphs seamlessly integrates into Bitbucket and provides the following capabilities:

  • Tracking commits, pull requests, and lines of code. You can monitor the number of commits or pull requests on the instance, team, or user levels, analyze and compare progress to past sprints or quarters, and see the engineering contribution for each repo and project. Thus, you can easily track, for instance, activity metrics from the SPACE framework, such as commits or lines of code.
  • Analyzing code review process. Awesome Graphs shows how the code review process is going. You can analyze PR merge times, see the quality of code reviews, find the most active reviewers, and identify areas for improvement. It helps in monitoring performance as well as communication and collaboration metrics.
  • Exporting data to a CSV file or via REST API. You can retrieve raw data about commits, lines of code, or pull requests at different levels and blend it with information from other applications to gain deeper insights. This feature allows you to build custom reports and track metrics aligned with your organization’s values and goals.

The SPACE framework offers a holistic approach to tracking the development process, empowering engineering managers and their teams with valuable insights into developer productivity. Awesome Graphs opens up opportunities to effortlessly implement this framework in your Bitbucket and effectively measure and improve teams’ productivity.

Start your free trial and reach a new level of visibility and efficiency in your development process and productivity.

Related posts

    Why to Use DORA Metrics in Jira and Bitbucket

    December 13, 2022
    #Analytics#Bitbucket
    7 min

    It’s good when business decisions are based on facts, but it’s even better when these facts are expressed in numbers and can be compared with each other. The same applies to software delivery performance. This area is undergoing a great deal of interest in order to identify universal metrics to measure engineering processes. DORA metrics are considered to be among them. In this article, we’ll explain what DORA metrics are, how they contribute to a company’s success and how to measure them in Bitbucket.

    What are DORA Metrics?

    DORA metrics are a set of indicators that help companies measure the quality of software development and speed of delivery processes. They were identified by the DevOps Research and Assessment (DORA) group based on several years of studies into the DevOps practices of 30k+ engineering professionals.


    DevOps Research and Assessment is an American research firm focused on digital transformation founded in 2015 and acquired by Google in 2019, known for its annual State of DevOps reports on business technology transformation.


    DORA metrics are primarily used to gauge:

    • Throughput
      • Deployment frequency – How often code is deployed
      • Lead time for changes – How long it takes for a commit to get into production
    • Stability
      • Change failure rate – Percentage of changes that led to problems in production
      • Time to restore service – How long it takes to recover service after an incident

    Based on how teams rank in each category, they are added to elite*, high, medium, or low clusters.
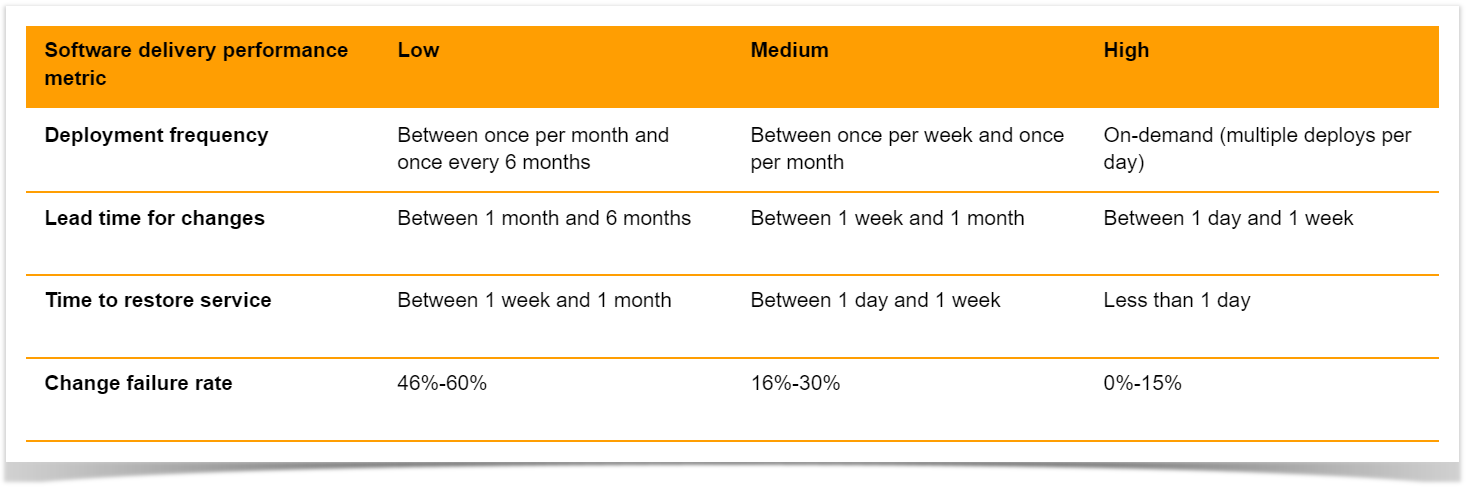
    four key DORA metricsSource: 2022 Accelerate State of DevOps Report.
    *This year an elite cluster was omitted as the highest-performing cluster doesn’t demonstrate enough of the characteristics of last year’s elite cluster.

    In addition to software delivery performance indicators, the group recently added the fifth key metric – reliability. It is used to measure operational performance and illustrates how well services meet users’ needs, such as availability and performance.

    Let’s have a closer look at the four software delivery performance metrics.

    Deployment frequency

    This metric indicates how often code is delivered to production or released to end users. According to DORA, the higher the deployment frequency, the better, as it involves more minor changes and minimizes release risks. In addition, it allows you to deliver value to customers faster and get feedback quicker.

    But the deployment frequency depends on the type of system. While web apps are typically delivered multiple times a day, this frequency isn’t appropriate for game developers with multi-gigabyte releases. In this case, the frequency of deployment to pre-production environments can be measured.

    Lead Time for Changes

    Lead time for changes also refers to the speed of development and indicates the time taken to deliver a commit into production. Using it, engineering managers can understand how efficient their teams’ cycle time is, how quickly changes are implemented and how well peaks in demand can be handled. Moreover, a long lead time for changes means that product updates are not delivered to users regularly enough. Therefore the advantage of quick feedback for further improvements cannot be taken.

    Change Failure Rate

    The change failure rate refers to code quality and measures the percentage of deployments that led to failures in production requiring remediation (e.g., a hotfix, rollback, fix forward, patch). Here is compared the number of post-deployment failures to the number of changes made.

    A low change failure rate confirms the quality of the pipeline and indicates that the previous stages have successfully identified the majority of defects before deployments.

    Time to Restore Service

    This metric also shows the quality of software development and refers to the time taken to restore service after such incidents as an unplanned outage or service impairment. No matter how hard your team tries, the chance of an outage is high. So it’s crucial to organize processes to respond to emerging issues as quickly as possible.

    A low time to recovery means that you efficiently identify emerging issues and can either quickly roll back to a previous version or promptly deploy a bug fix.

    How to measure DORA metrics in Bitbucket?

    As can be seen, DORA metrics are an effective way to understand your teams’ throughput and quality of code and make informed decisions about improving processes.

    Using information from your project management systems like Jira and Bitbucket, you can calculate them manually:

    • Deployment frequency – the average number of days per week or month with at least one deployment
    • Lead time for changes – the average time between the first commit of a release and the deployment to production
    • Change failure rate – the ratio of deployment failures to the overall number of deployments
    • Time to restore service – the average time between a bug report and fix deployment

    However, it’s much easier to measure metrics using Awesome Graphs for Bitbucket, which helps track and visualize your Git repositories as well as export commit and pull request data from Bitbucket to build custom reports.

    Feel free to leave your email below if you would like to stay updated and be among the first to know about our new features and updates.


    Contact Us
    Related posts

      Pull Request Analytics: How to Visualize Cycle Time / Lead Time and Get Insights for Improvement

      March 30, 2021
      #How To#Bitbucket#Reporting
      12 min

      Cycle Time / Lead Time is one of the most important metrics for software development. It can tell a lot about the efficiency of the development process and the teams’ speed and capacity. In the previous article, we showed you how to get a detailed report with the pull request statistics and Cycle Time / Lead Time calculated on the repository level. 

      Today we’ll tell you how to use this report:

      • How to visualize the pull request data.
      • What things to pay attention to.
      • What insights you can get to improve performance.

      Please note that we define Cycle Time / Lead Time as the time between the developer’s first commit and the time it’s merged and will refer to it as Cycle Time throughout the article.

      Analyzing your codebase

      First, you need to understand the current state of affairs and how it compares to the industry standards. According to the Code Climate’s research, the industry-wide median for Cycle Time is 3.4 days, with only the top 25% managing to keep it as low as 1.8 days and the bottom 25% having a Cycle Time of 6.2 days.

      © Code Climate

      To get a better understanding of the development process, it might be helpful to look at the teams’ dynamics and monitor the changes over time. The following chart shows how the average Cycle Time changes month after month with a trend line, so you can see objectively whether the development process is getting faster or slower and check how your rates compare to the industry average. Follow the instructions to build this chart.

      For a more precise analysis and evaluation of the current code base, you can also use the Cycle Time distribution chart that provides pull request statistics aggregated by their Cycle time value, making it easy to spot the outliers for further investigation. Learn how to build this chart.

      In addition to the Cycle Time, Awesome Graphs for Bitbucket lets you analyze the pull request resolution time out-of-the-box. Using the Resolution Time Distribution report, you can see how long it takes pull requests to merge or decline, find the shortest and longest pull requests, and predict the resolution time of future pull requests with the historical data.

      While Cycle Time serves as a great indicator of success and, keeping it low, you can increase the output and efficiency of your teams, it’s not diagnostic by itself and can’t really tell what you are doing right or wrong. To understand why it is high or low, you’ll need to dig deeper into the metrics it consists of. The chart below gives you a general overview of the pull requests on the repository level and shows the Cycle Time with the percentage of the stages it’s comprised of (which we’ll discuss in detail in the following paragraphs). You can build a chart like this using the Chart from Table macro, available in the Table Filter and Charts app.

      Breaking down the Cycle Time

      We break down Cycle Time into four stages:

      • Time to open (from the first commit to open)
      • Time waiting for review (from open to the first comment)
      • Time to approve (from the first comment to approved)
      • Time to merge (from approved to merge)

      Now we’ll go through each of these stages, discussing the things to pay attention to.

      Time to Open

      This metric is arguably the most important of all, as it influences all the later stages and, according to the research, pull requests that open faster tend to merge faster.

      Long Time to Open might indicate that the developer had to switch tasks and/or that code was rewritten, which might also result in large batch sizes. In one of the previous articles, we described how you can check the size of your pull requests in Bitbucket, so you can also use it for a deeper analysis.

      One of the things you can do to improve your Time to Open is to decrease the pull request size to be no more than 200 to 400 lines of code. Thus you’ll influence each stage of the cycle, as the smaller pull requests are more likely to be reviewed more thoroughly and be approved sooner.

      Time to Review

      Time to Review is a great metric to understand if your teams adopted Code Review as part of the daily routine. If it’s high, then it might not be part of their habit, and you’ll need to foster this culture. Another reason might be that the pull requests are not review-friendly and the reviewers procrastinate dealing with them. You can change this, once again, by keeping the pull request size small and by writing a reasonable description so it’s easier to get started with them. If the long Time to Review rate is caused by organizational issues, then it might require reprioritization.

      Time to Approve

      This is the stage you don’t really want to minimize but rather make it consistent by reducing inefficiencies in the code review process. While there are many strategies for Code Review, there is hardly any industry standard for Code Review metrics, so you’ll need to focus on the organization of the process and try to find a way to get constructive feedback.

      Time to Merge

      Long Time to Merge might be an indicator that there are obstacles in the delivery workflow. To improve it, you need to find out if there are any blockers in the process, including manual deployment, and check if your tooling satisfies your current needs.

      Wrapping up

      Cycle Time’s importance is difficult to overestimate, as this metric can tell a lot about the way you work, and controlling it, you can optimize the development process and deliver faster.

      Once again, we built the initial pull request report with the help of the Awesome Graphs for Bitbucket app as a data provider and used the Table Filter and Charts for Confluence app to aggregate and visualize the data.

      These are just a few examples, but you can get much more even from this one report. Check out the other guides for charts based on data from Bitbucket. Share your feedback and ideas in the comments, and we’ll try to cover them in future posts.

      Related posts

        Pull Request Analytics: How to Get Pull Request Cycle Time / Lead Time for Bitbucket

        March 23, 2021
        #How To#Bitbucket#Reporting
        13 min

        What Cycle Time is and why it is important

        Pull Request Cycle Time / Lead Time is a powerful metric to look at while evaluating the engineering teams’ productivity. It helps track the development process from the first moment the code was written in a developer’s IDE and up to the time it’s deployed to production.

        Please note that we define Cycle Time / Lead Time as the time between the developer’s first commit and the time it’s merged and will refer to it as Cycle Time throughout the article.

        Having this information, you can get an unbiased view of the engineering department’s speed and capacity and find the points to drive improvement. It can also be an indicator of business success as, by controlling the Cycle Time, you can increase the output and efficiency to deliver products faster.

        This article will show you how to get a detailed pull request report with the Cycle Time and the related metrics calculated on the repository level. The metrics include:

        • Time to open (from the first commit to open)
        • Time waiting for review (from open to the first comment)
        • Time to approve (from the first comment to approved)
        • Time to merge (from approved to merge)

        How to get Time to Open, Time to Review, Time to Approve, and Time to Merge metrics

        We can get all the necessary pull request data from Awesome Graphs for Bitbucket and its REST API combined with Bitbucket’s REST API resources. We’ll use Python to make requests into the APIs, calculate and aggregate this data and then save it as a CSV file, like this:

        The following script will do all this work for us:

        </p>
        import sys
        import requests
        import csv
        from dateutil import parser
        from datetime import datetime
         
        bitbucket_url = sys.argv[1]
        login = sys.argv[2]
        password = sys.argv[3]
        project = sys.argv[4]
        repository = sys.argv[5]
        since = sys.argv[6]
        until = sys.argv[7]
         
        s = requests.Session()
        s.auth = (login, password)
         
         
        class PullRequest:
         
            def __init__(self, pr_id, title, author, state, created, closed):
                self.pr_id = pr_id
                self.title = title
                self.author = author
                self.state = state
                self.created = created
                self.closed = closed
         
         
        def parse_date_ag_rest(date):
            return parser.isoparse(date).replace(tzinfo=None, microsecond=0)
         
         
        def get_date_from_timestamp(timestamp):
            return datetime.fromtimestamp(timestamp / 1000).replace(microsecond=0)
         
         
        def subtract_dates(minuend, subtrahend):
            if minuend is None or subtrahend is None:
                return None
            else:
                return round(((minuend - subtrahend).total_seconds() / 86400), 2)
         
         
        def get_pull_requests():
         
            pull_request_list = []
         
            get_prs_url = bitbucket_url + '/rest/awesome-graphs-api/latest/projects/' + project + '/repos/' + repository \
                + '/pull-requests'
         
            is_last_page = False
         
            while not is_last_page:
         
                response = s.get(get_prs_url, params={'start': len(pull_request_list), 'limit': 1000,
                                                      'sinceDate': since, 'untilDate': until}).json()
         
                for pr_details in response['values']:
         
                    pd_id = pr_details['id']
                    title = pr_details['title']
                    author = pr_details['author']['user']['emailAddress']
                    state = pr_details['state']
                    created = parse_date_ag_rest(pr_details['createdDate'])
         
                    if pr_details['closed'] is True:
                        closed = parse_date_ag_rest(pr_details['closedDate'])
                    else:
                        closed = None
         
                    pull_request_list.append(PullRequest(pd_id, title, author, state, created, closed))
         
                is_last_page = response['isLastPage']
         
            return pull_request_list
         
         
        def get_first_commit_time(pull_request):
         
            commit_dates = []
         
            commits_url = bitbucket_url + '/rest/api/latest/projects/' + project + '/repos/' + repository + '/pull-requests/' \
                + str(pull_request.pr_id) + '/commits'
         
            is_last_page = False
         
            while not is_last_page:
         
                commits_response = s.get(commits_url, params={'start': len(commit_dates), 'limit': 500}).json()
         
                for commit in commits_response['values']:
                    commit_timestamp = commit['authorTimestamp']
                    commit_dates.append(get_date_from_timestamp(commit_timestamp))
         
                is_last_page = commits_response['isLastPage']
         
            if not commit_dates:
                first_commit = None
            else:
                first_commit = commit_dates[-1]
         
            return first_commit
         
         
        def get_pr_activities(pull_request):
         
            counter = 0
            comment_dates = []
            approval_dates = []
         
            pr_url = bitbucket_url + '/rest/api/latest/projects/' + project + '/repos/' + repository + '/pull-requests/' \
                + str(pull_request.pr_id) + '/activities'
         
            is_last_page = False
         
            while not is_last_page:
         
                pr_response = s.get(pr_url, params={'start': counter, 'limit': 500}).json()
         
                for pr_activity in pr_response['values']:
         
                    counter += 1
         
                    if pr_activity['action'] == 'COMMENTED':
                        comment_timestamp = pr_activity['comment']['createdDate']
                        comment_dates.append(get_date_from_timestamp(comment_timestamp))
                    elif pr_activity['action'] == 'APPROVED':
                        approval_timestamp = pr_activity['createdDate']
                        approval_dates.append(get_date_from_timestamp(approval_timestamp))
         
                    is_last_page = pr_response['isLastPage']
         
            if not comment_dates:
                first_comment_date = None
            else:
                first_comment_date = comment_dates[-1]
         
            if not approval_dates:
                approval_time = None
            else:
                approval_time = approval_dates[0]
         
            return first_comment_date, approval_time
         
         
        print('Collecting a list of pull requests from the repository', repository)
         
        with open(f'{project}_{repository}_prs_cycle_time_{since}_{until}.csv', mode='a', newline='') as report_file:
            report_writer = csv.writer(report_file, delimiter=',', quotechar='"', quoting=csv.QUOTE_MINIMAL)
            report_writer.writerow(['id',
                                    'title',
                                    'author',
                                    'state',
                                    'first_commit',
                                    'created',
                                    'first_comment',
                                    'approved',
                                    'closed',
                                    'cycle_time_d',
                                    'time_to_open_d',
                                    'time_to_review_d',
                                    'time_to_approve_d',
                                    'time_to_merge_d'])
         
            for pull_request in get_pull_requests():
         
                print('Processing pull request', pull_request.pr_id)
         
                first_commit_time = get_first_commit_time(pull_request)
         
                first_comment, approval = get_pr_activities(pull_request)
         
                cycle_time = subtract_dates(pull_request.closed, first_commit_time)
         
                time_to_open = subtract_dates(pull_request.created, first_commit_time)
         
                time_to_review = subtract_dates(first_comment, pull_request.created)
         
                time_to_approve = subtract_dates(approval, first_comment)
         
                time_to_merge = subtract_dates(pull_request.closed, approval)
         
                report_writer.writerow([pull_request.pr_id,
                                        pull_request.title,
                                        pull_request.author,
                                        pull_request.state,
                                        first_commit_time,
                                        pull_request.created,
                                        first_comment,
                                        approval,
                                        pull_request.closed,
                                        cycle_time,
                                        time_to_open,
                                        time_to_review,
                                        time_to_approve,
                                        time_to_merge])
         
        print('The resulting CSV file is saved to the current folder.')
        <p>

        To make this script work, you’ll need to pre-install the requests and dateutil modules. The csvsys, and datetime modules are available in Python out of the box. You need to pass the following arguments to the script when executed:

        • the URL of your Bitbucket, 
        • login, 
        • password, 
        • project key, 
        • repository slug, 
        • since date (to include PRs created after), 
        • until date (to include PRs created before).

        Here’s an example:

        py script.py https://bitbucket.your-company-name.com login password PRKEY repo-slug 2020-11-30 2021-02-01

        Once the script’s executed, the resulting file will be saved to the same folder as the script.

        What to do with the report

        After you generated a CSV file, you can process it in analytics tools such as Tableau, PowerBI, Qlik, Looker, visualize this data on your Confluence pages with the Table Filter and Charts for Confluence app, or integrate it in any custom solution of your choice for further analysis. 

        An example of the data visualized with Table Filter and Charts for Confluence.

        By measuring Cycle Time, you can:

        • See objectively whether the development process is getting faster or slower.
        • Analyze the correlation of the specific metrics with the overall cycle time (e.g., pull requests that open faster, merge faster).
        • Compare the results of the particular teams and users within the organization or across the industry.

        What’s next?

        The report described in this article is built with the help of the Awesome Graphs for Bitbucket app as a data provider, available for Bitbucket Server and Data Center. Using it, you can gain more visibility into the development process to analyze patterns and find bottlenecks.

        If you want to learn more about how to use Cycle Time and the related metrics, write in the comments below and upvote this post, and we’ll show you how to visualize the data, what to look at and how to get insights from it in the future posts!

        Related posts