Table Filter and Charts with the Jira macro

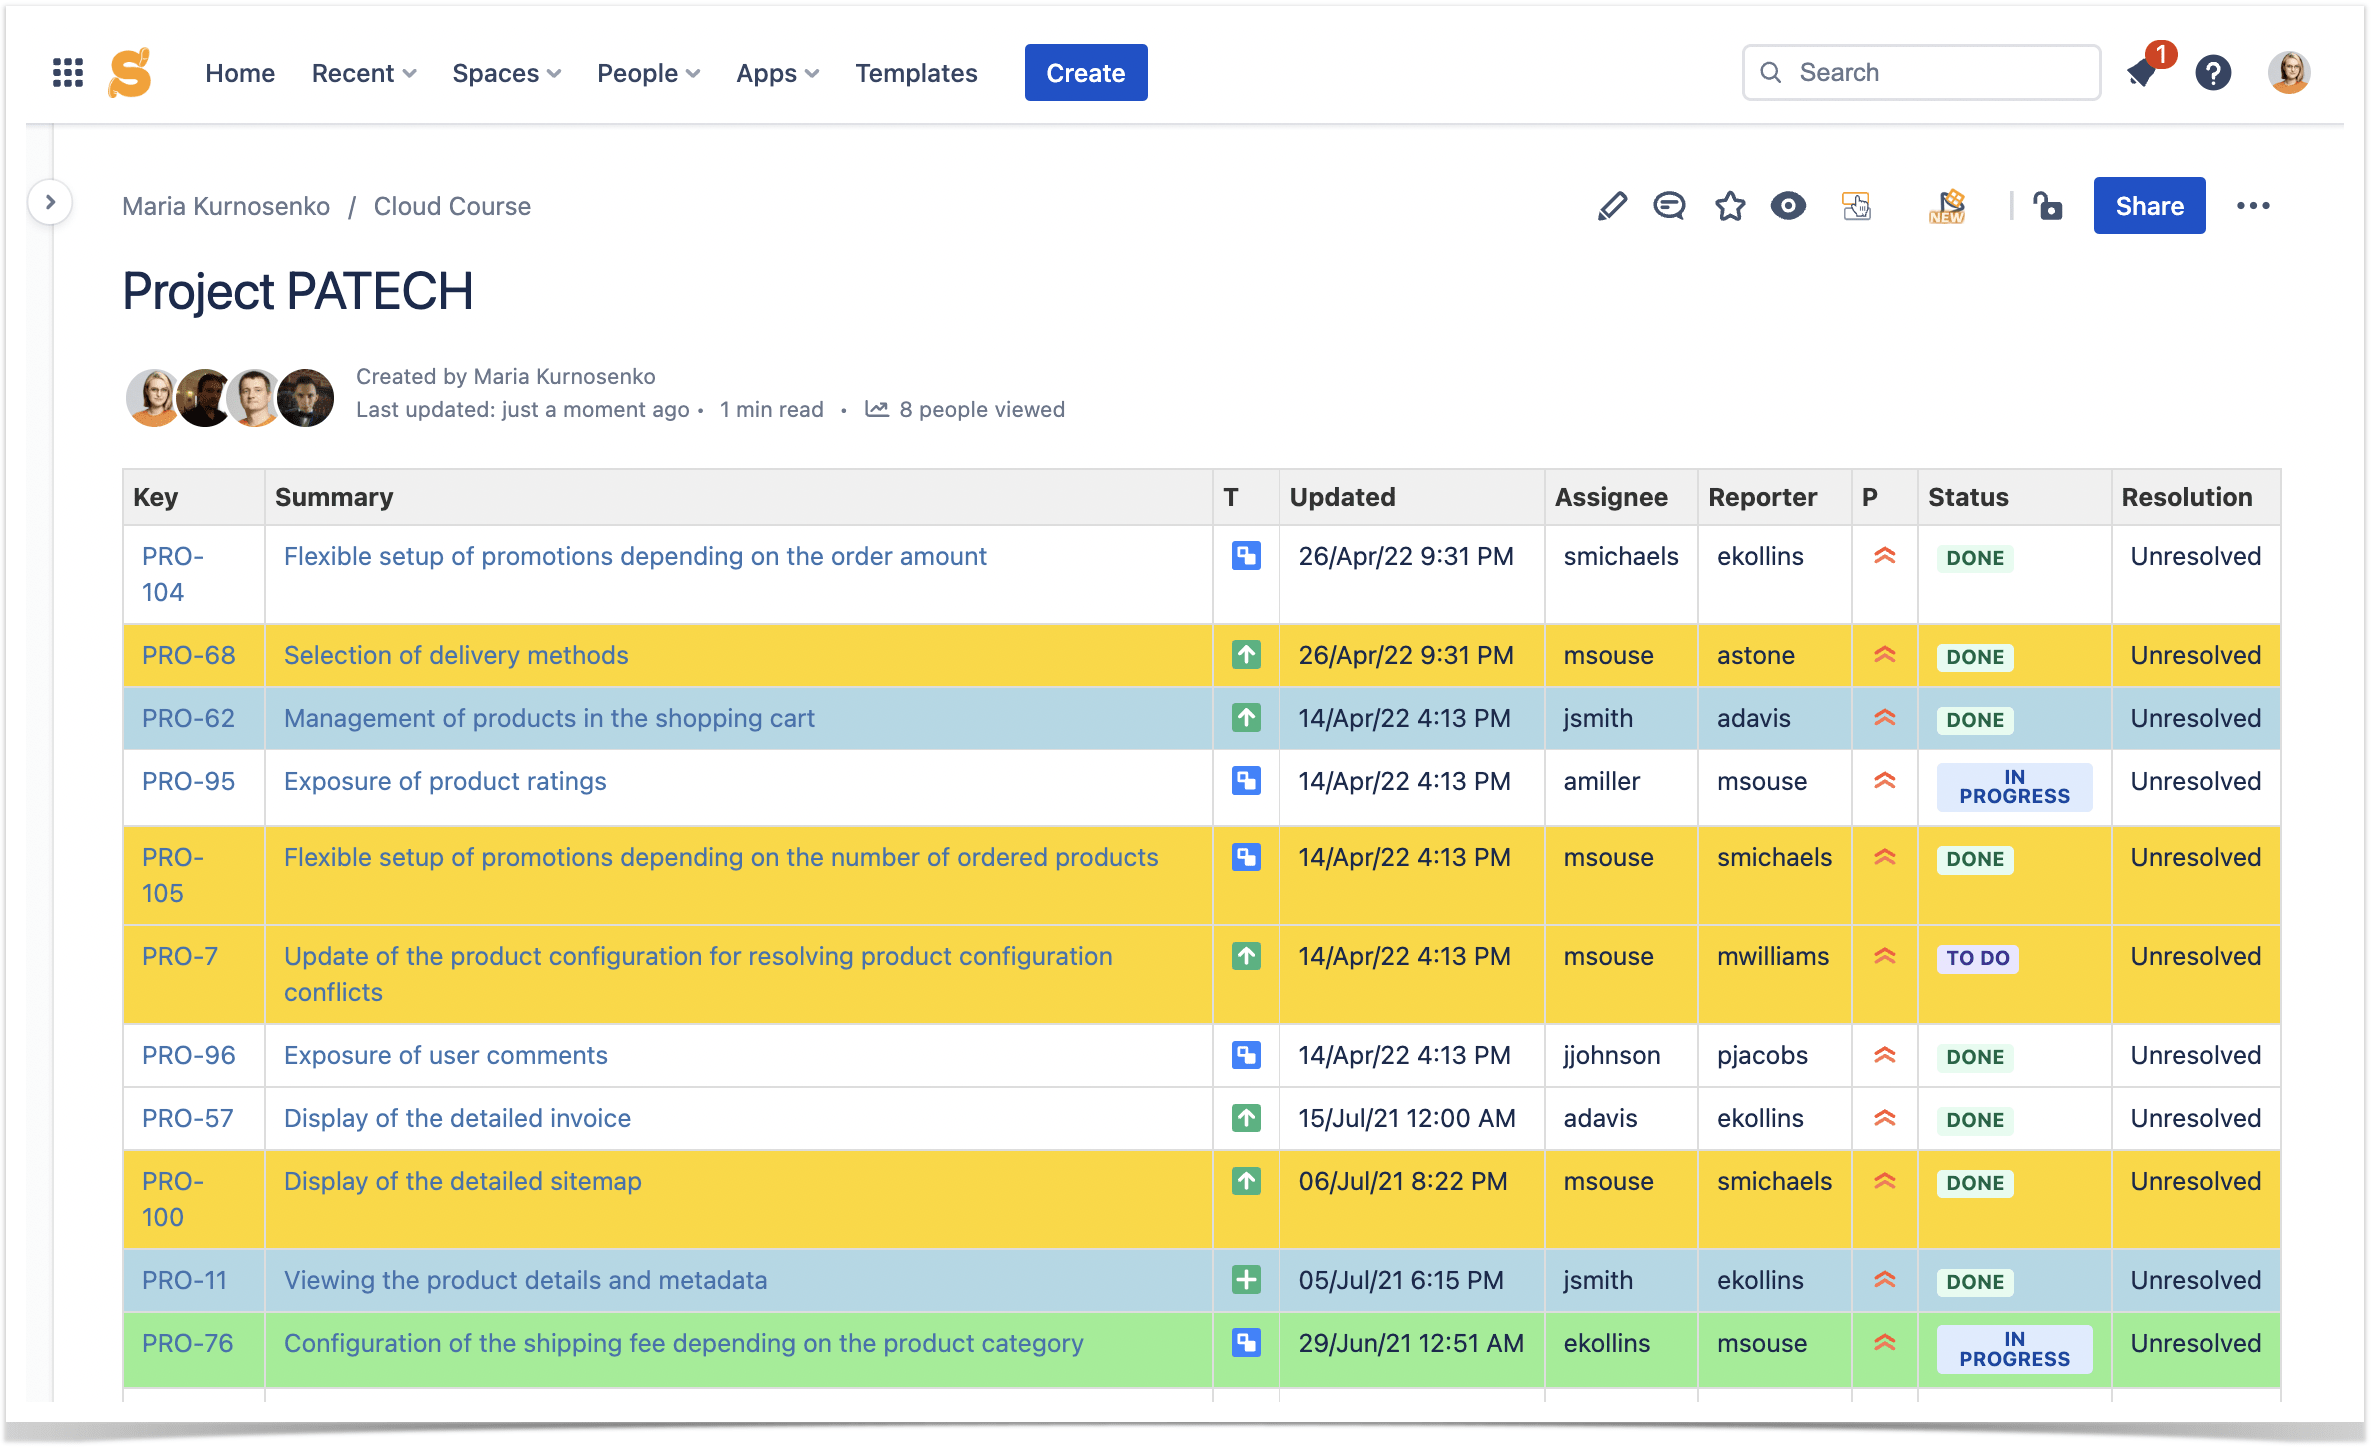
The Jira macro helps us fetch the list of Jira issues and transform it into a table with user-defined columns. We’ll show you how to arrange Jira issues just right to get the data you require at the moment.
The Jira Macro
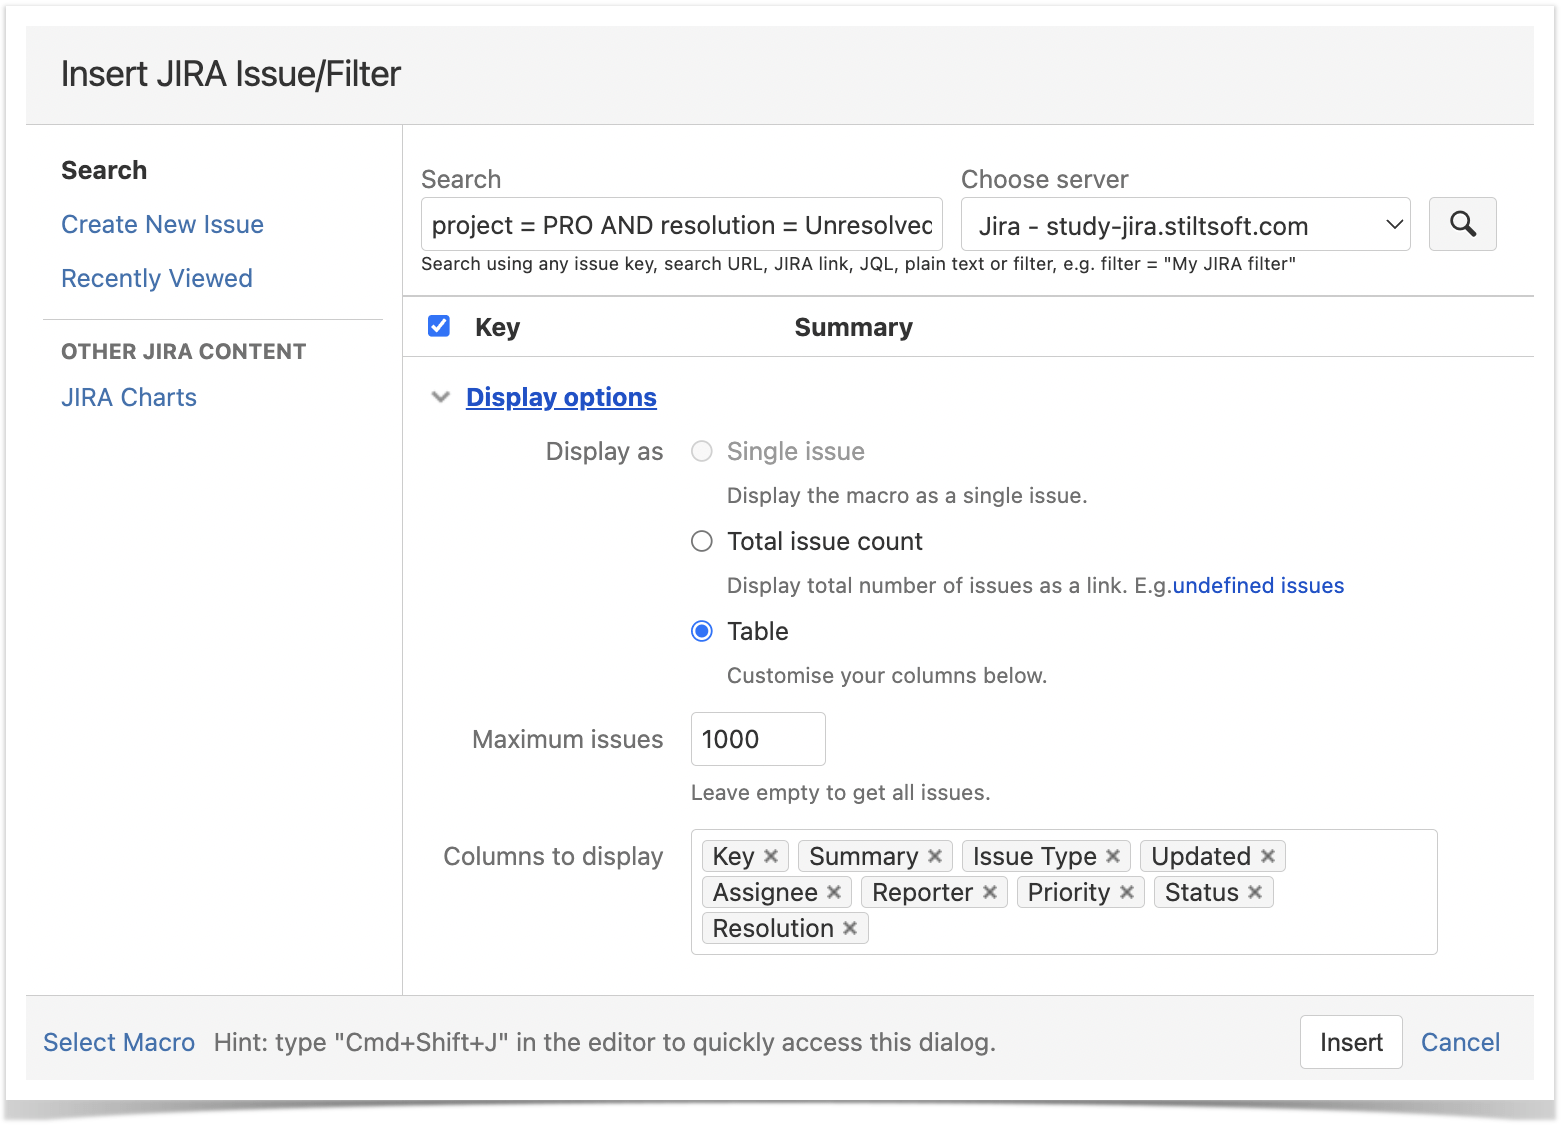
The Jira macro is a native Confluence tool that allows you to fetch the list of issues matching the entered JQL query. After inserting the macro on the page, you can select the necessary application link and type the JQL query for issue output. Alternatively, you can filter the issues in Jira and copy the link to the pre-selected category.
Additionally, you can pick the settings which help you regulate the count of displayed issues (up to 1000). You can define which columns to show and which ones to hide in the generated table if needed. If you use custom fields in your Jira projects, you can list these and standard columns.
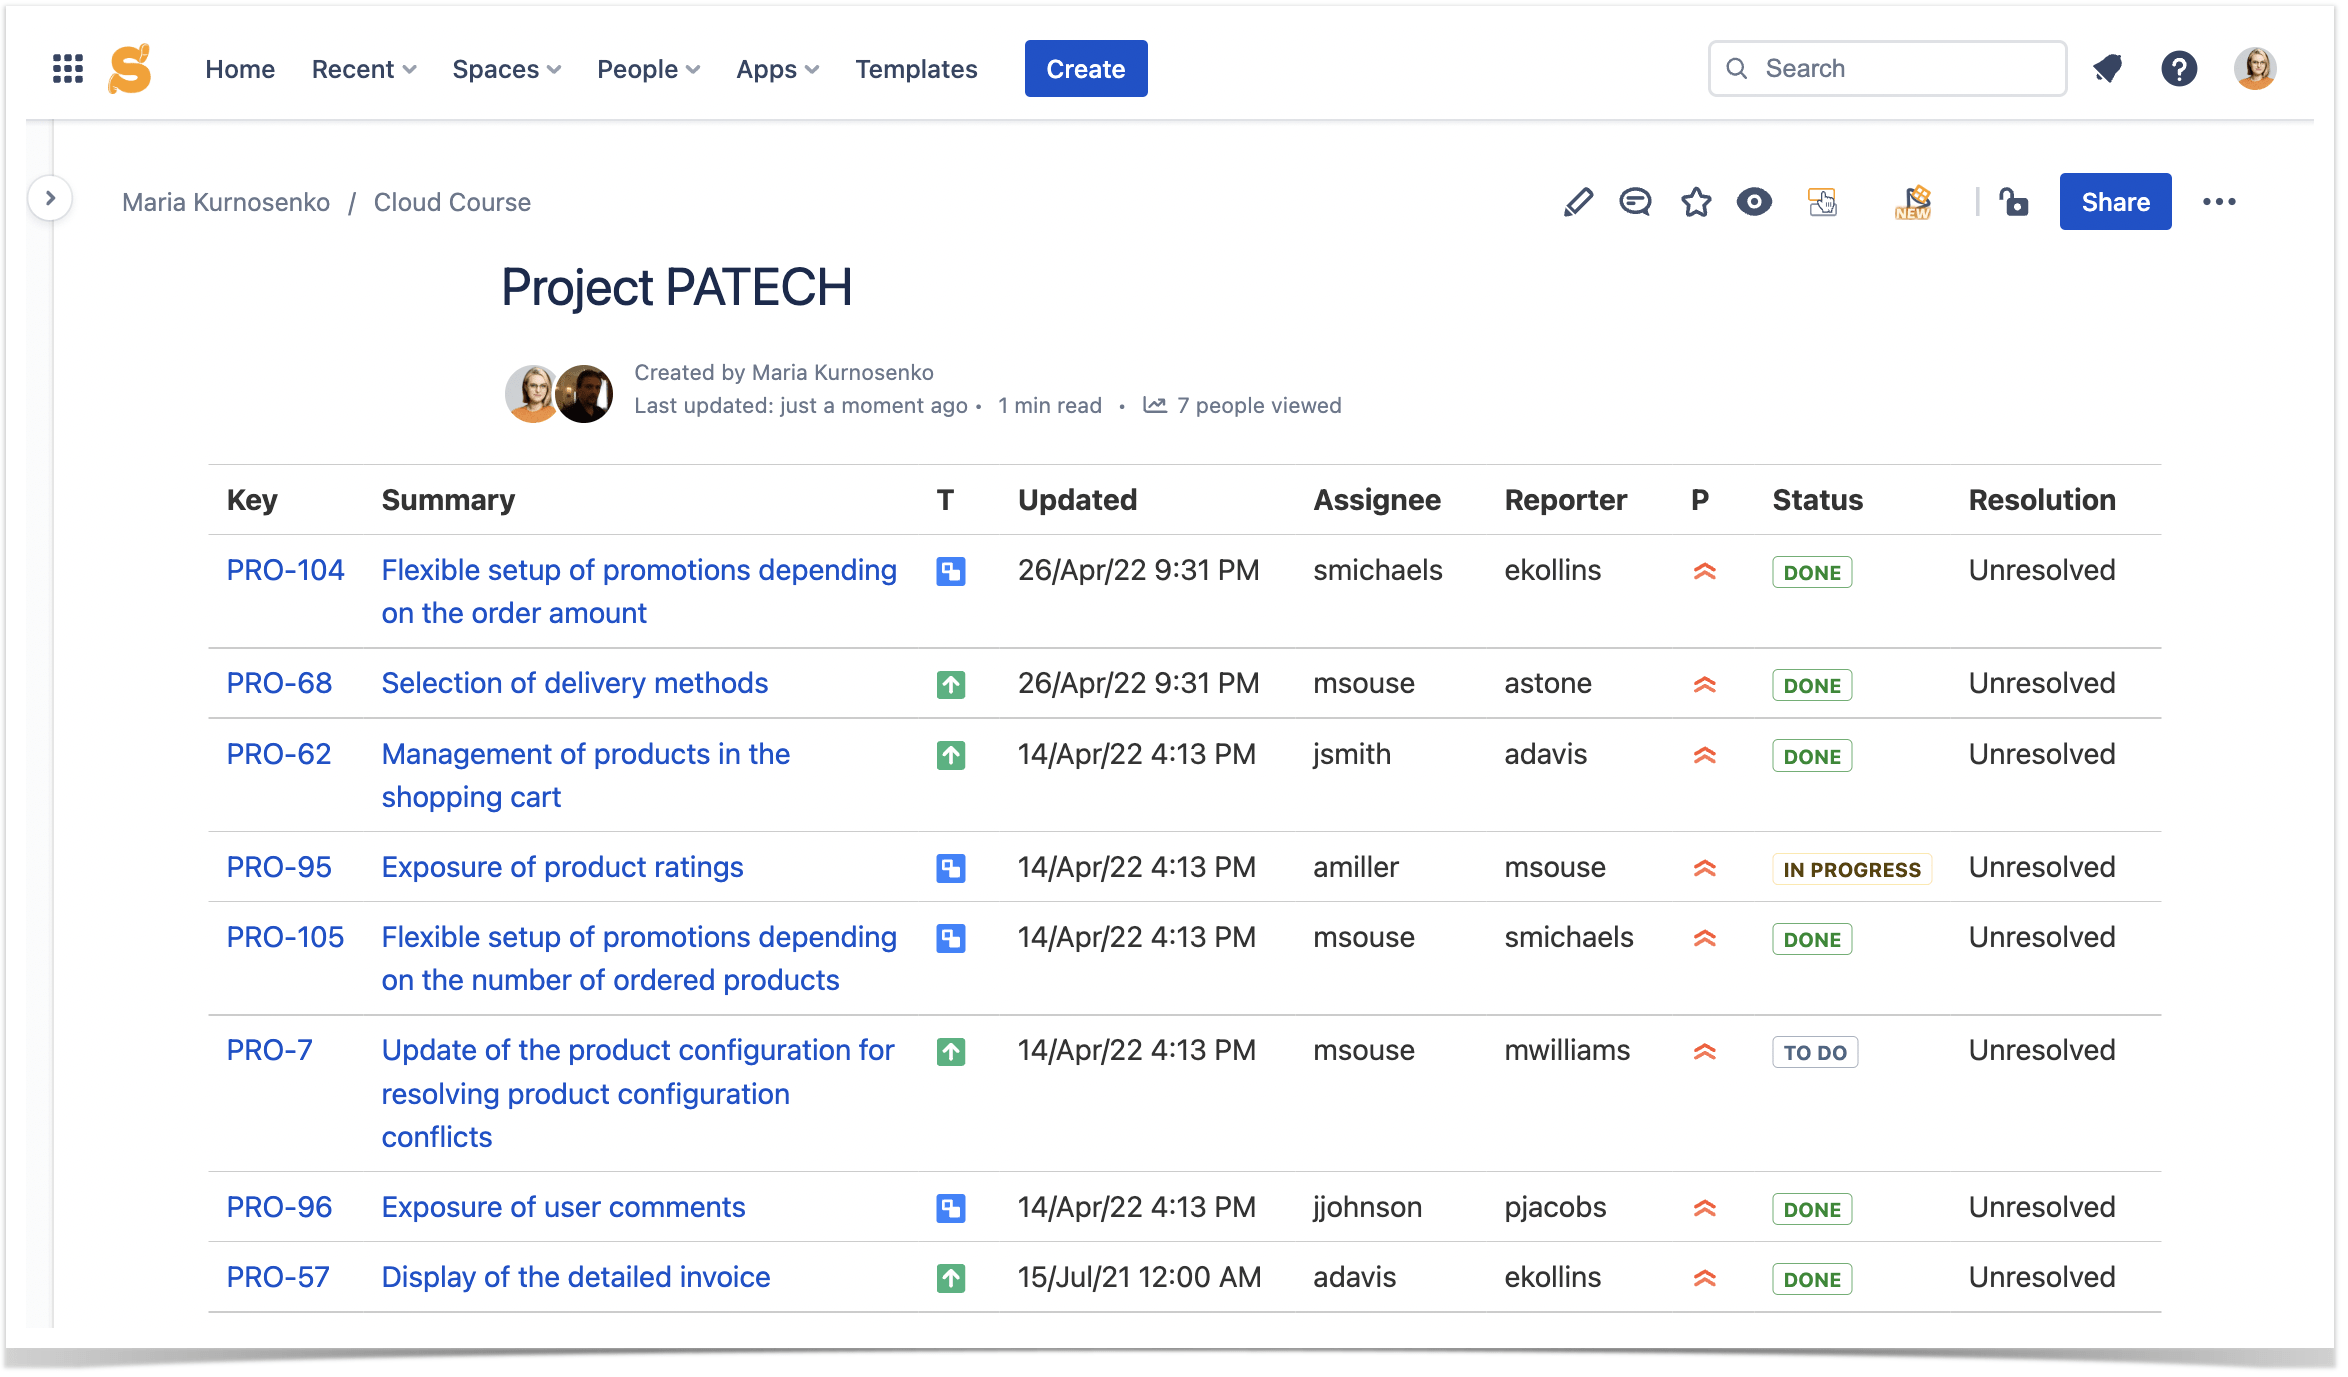
After saving the macro and the page, you will get a table with Jira issues. If you want to choose different settings and request a more detailed list of issues, you need to go back to the edit mode and change the JQL query and the settings of the macro.
Native Confluence features don’t offer many options for further processing the table apart from sorting its columns in the view mode.
If you want to manage your tabular data comprehensively, you can apply the bundle of macros from the Table Filter and Charts for Confluence app. Here’s what it can help you achieve.
Finding relevant data
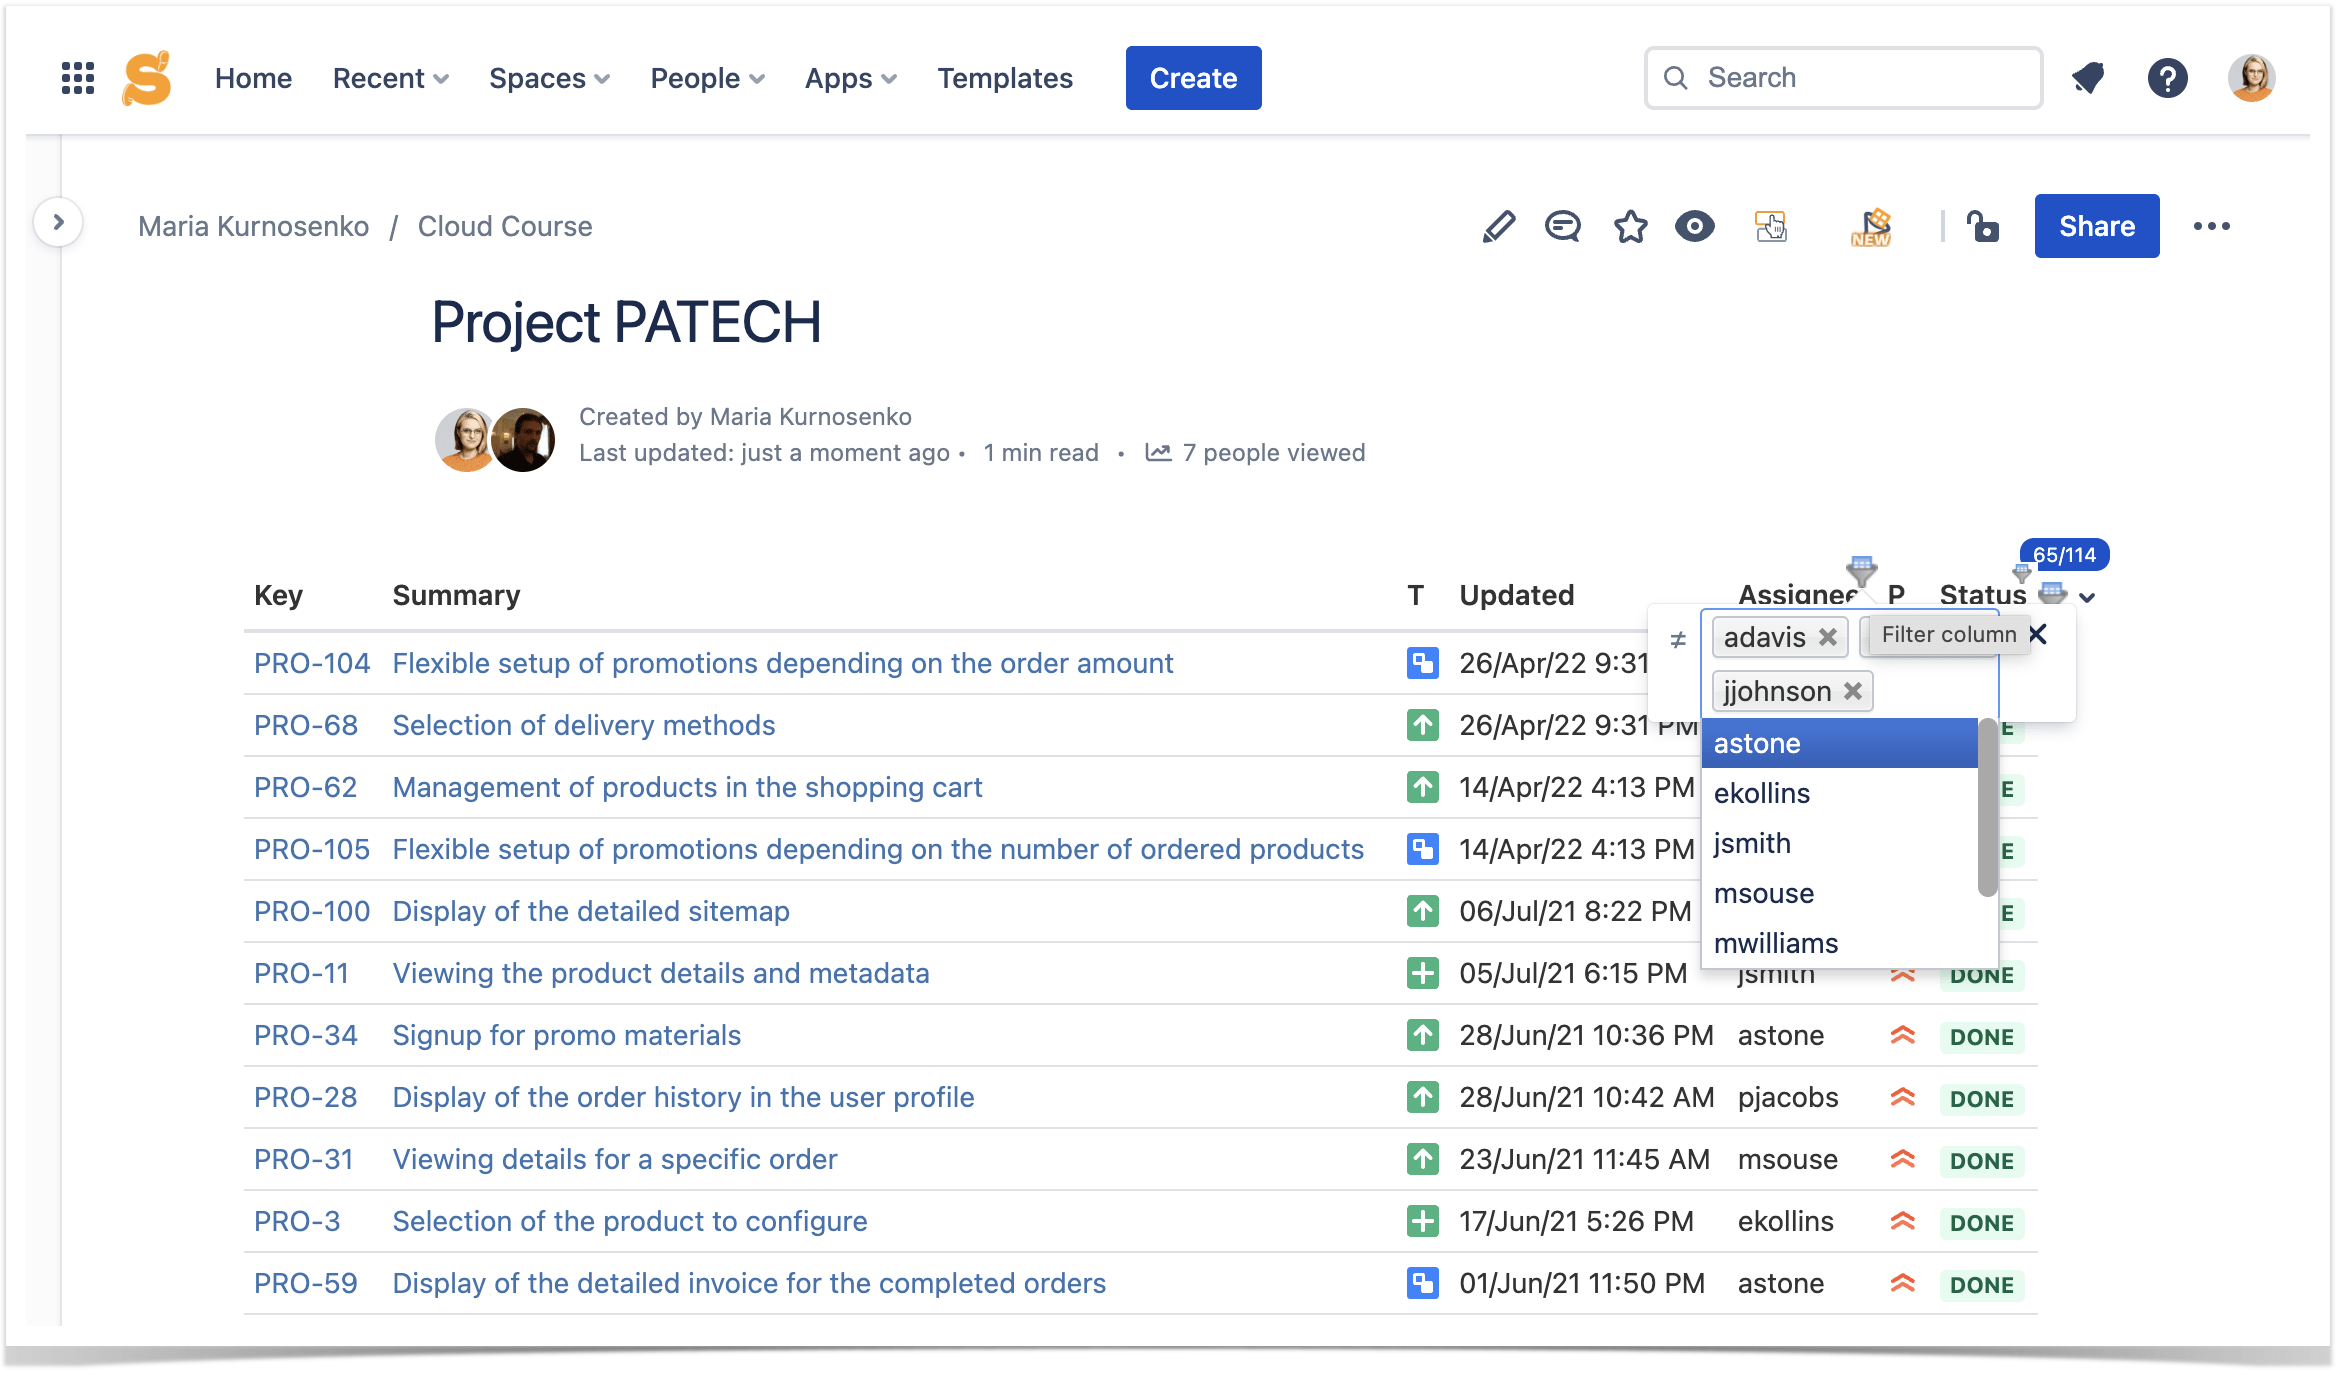
The Table Filter macro provides a broad set of filters for different data types. After you add the macro, it automatically applies relevant filters to each table column. After that, you can select filter settings. Filtering data allows you to easily navigate through large tables and find the necessary information in just a few clicks.
Getting more insights
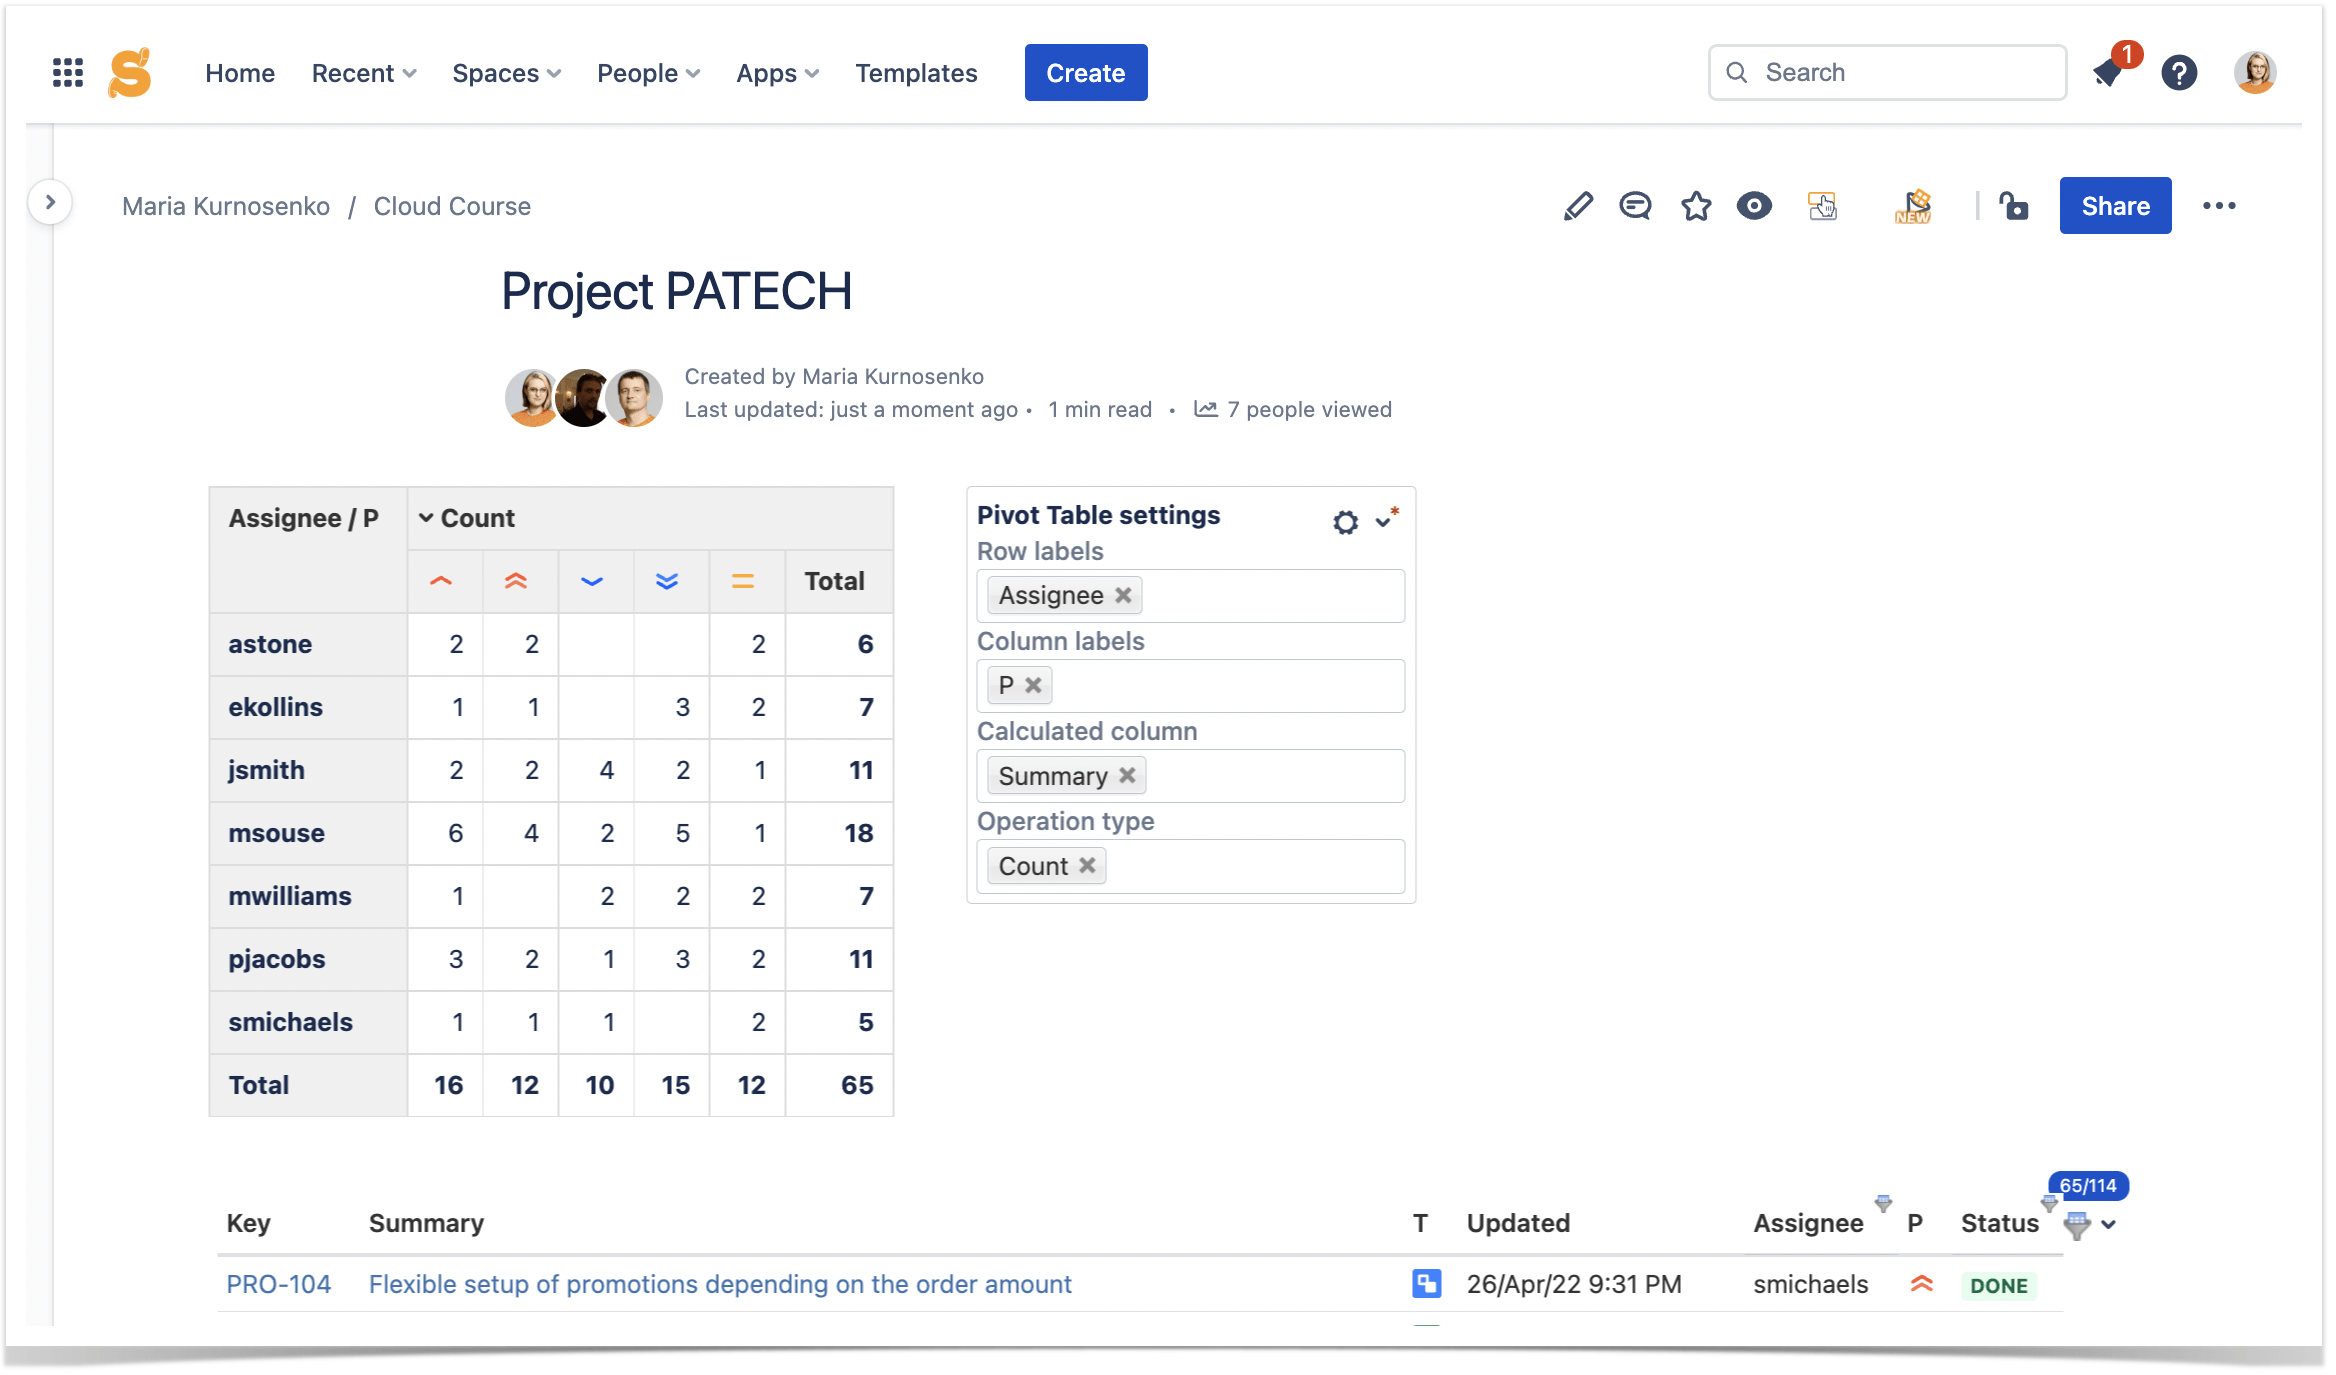
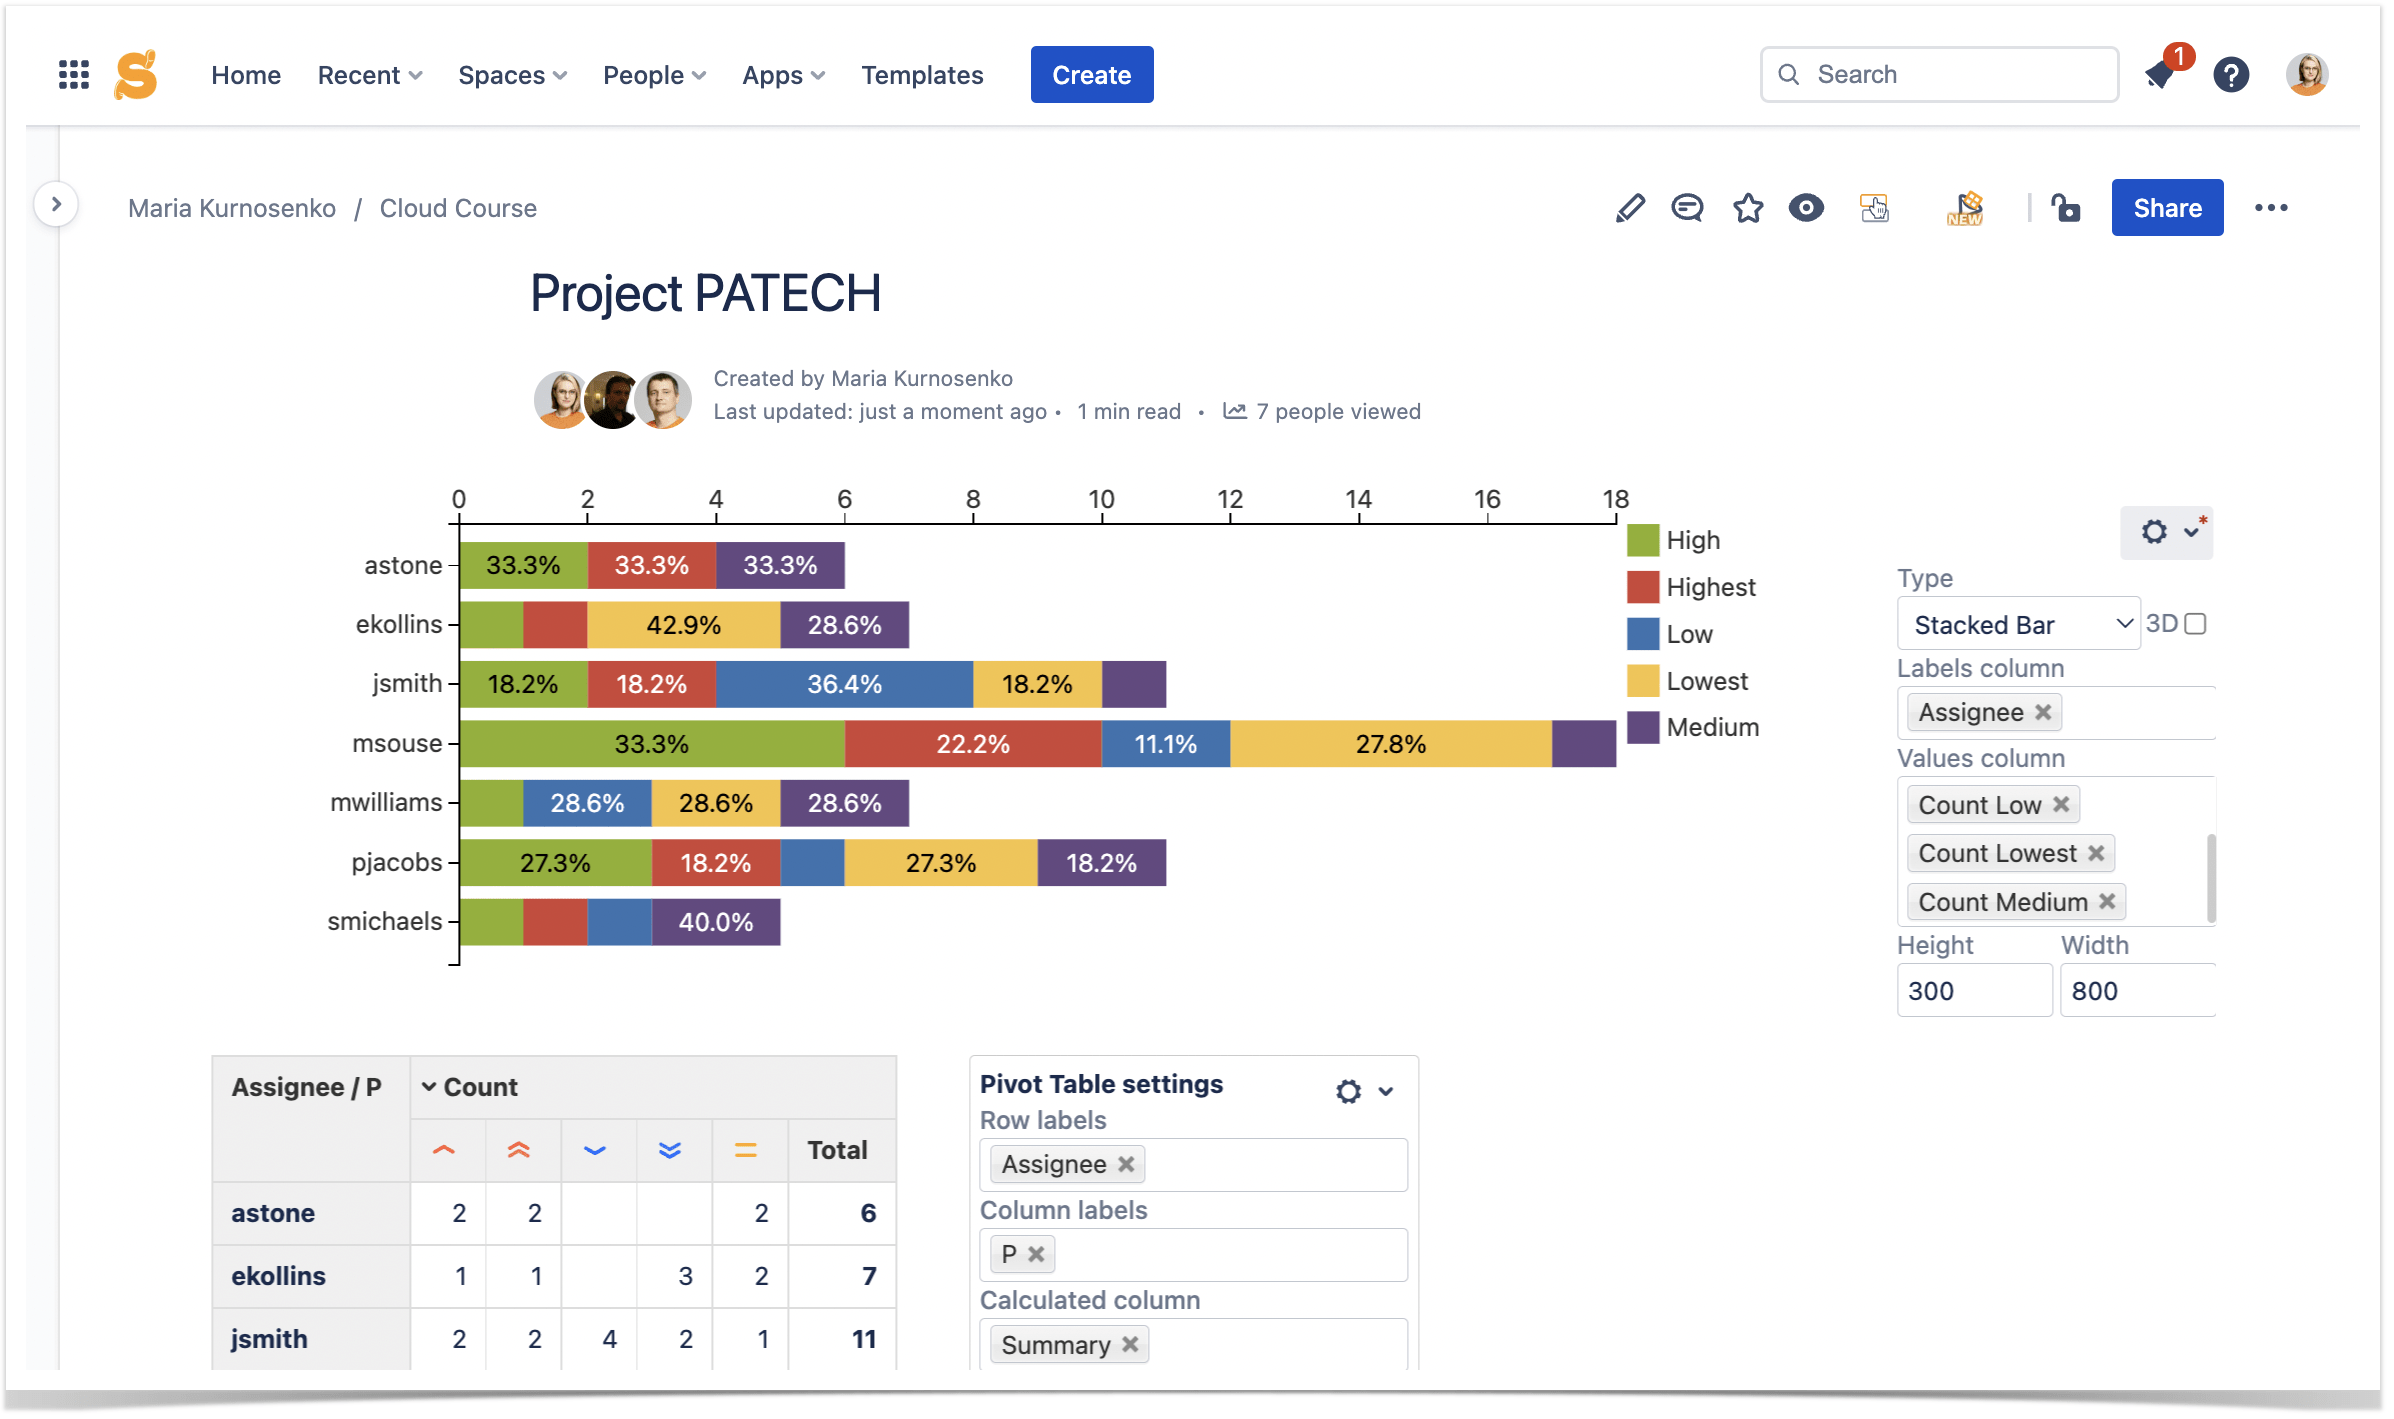
Tables with Jira issues usually contain repeated values, such as types of tasks or statuses. You can aggregate data based on these values and perform simplistic calculations. For example, to discover the workload of each team member, you can use the Pivot Table macro to summarize the number of tasks of each status per employee.
And if you want to calculate something more complicated or set conditions for table formatting, you can use the Table Transformer macro. It requires writing an SQL query to define the settings but gives you more freedom in managing your Jira issues table.
Creating engaging visualizations
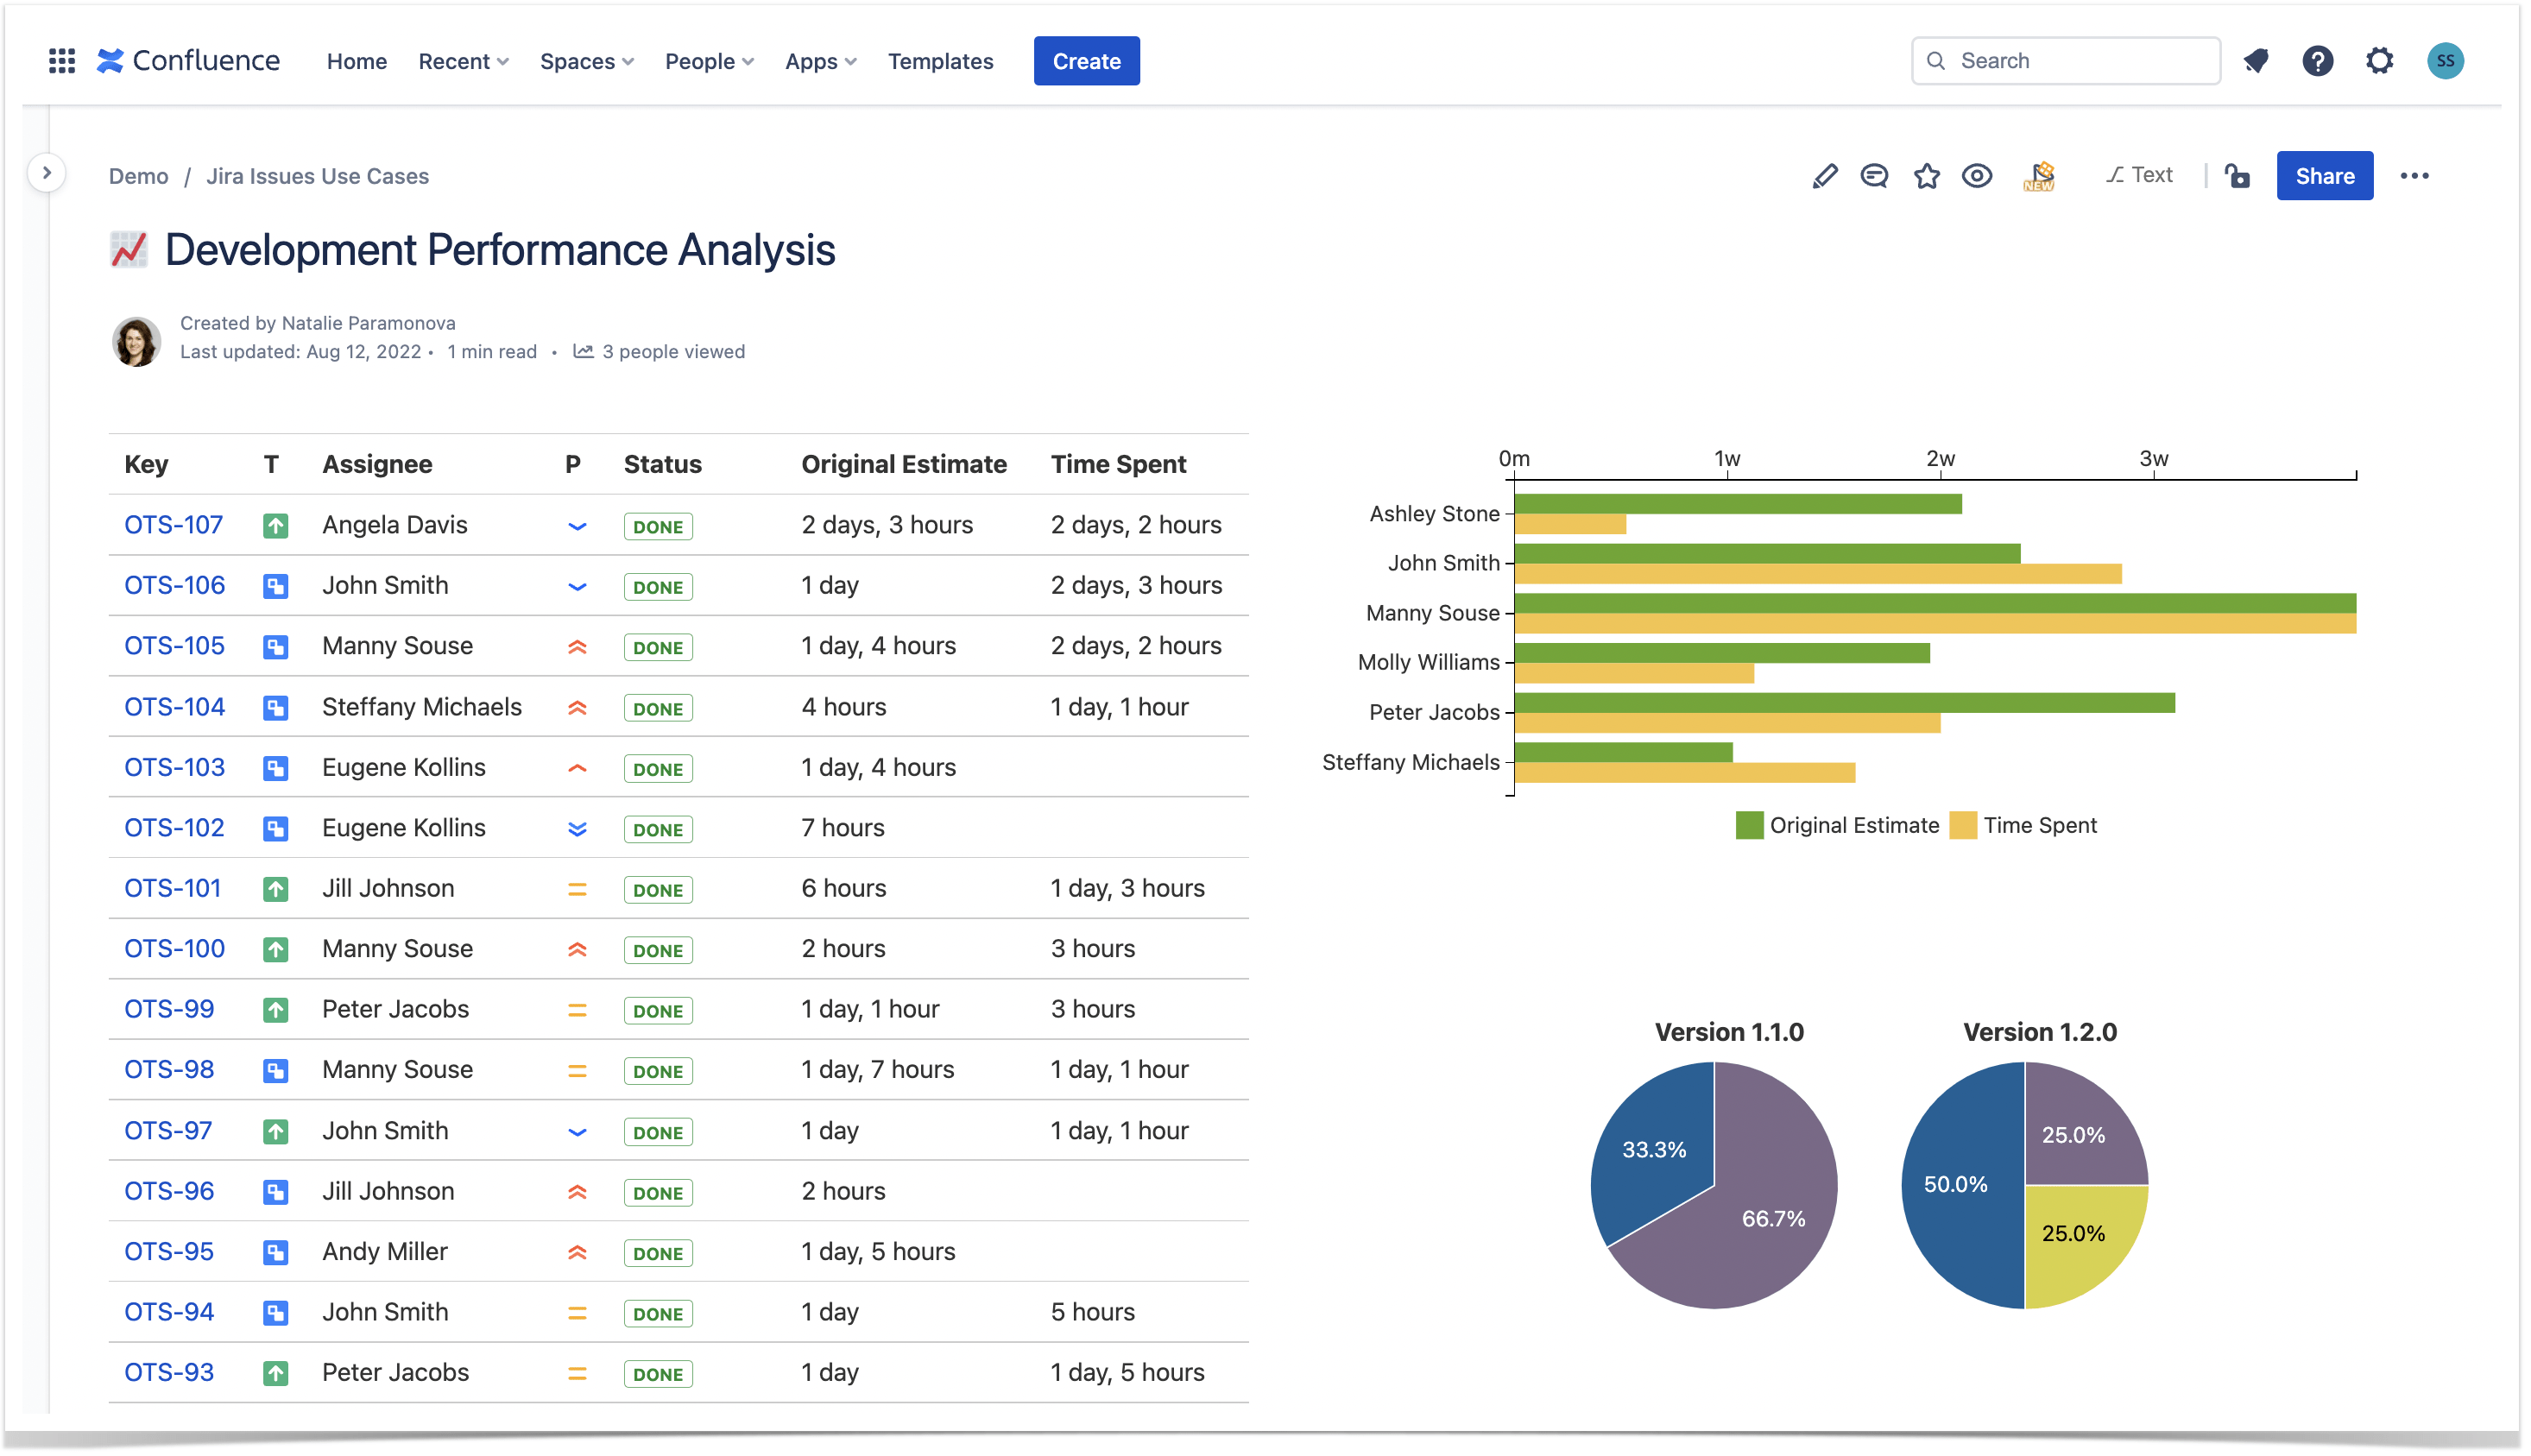
Charts and graphs can give you a different perspective on data and help you understand it better. The Chart from Table macro offers you various chart types and suggests the most suitable options for data organization. All charts are customizable, which means you can change included table columns, chart types, and even the color scheme however you prefer. And if you update the source table, the chart will renew instantly.
If needed, you can use a combination of macros to create engaging and interactive dashboards. You can read our article to learn more about it.
What’s the next step?
Watch our video to learn more about using Jira issues in Confluence with the Table Filter and Charts app.
And if you decide to try it out, just follow the instructions below!


