Boost your Confluence experience with powerful status management tools. Discover how to effectively use native status macros and enhance workflows with Handy Macros. Streamline updates, track progress, and create interactive dashboards effortlessly.


Boost your Confluence experience with powerful status management tools. Discover how to effectively use native status macros and enhance workflows with Handy Macros. Streamline updates, track progress, and create interactive dashboards effortlessly.


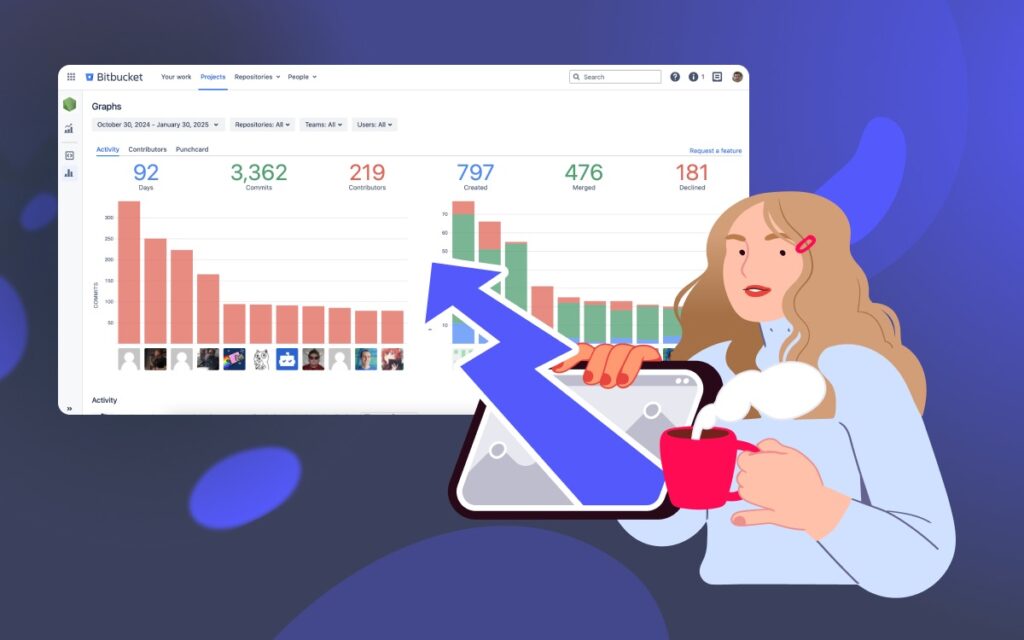
Learn how to analyse project contributions in Bitbucket Cloud with ready-to-use graphs and reports.

Code review is one of the cornerstone processes in the software development workflow. While it ensures the quality of merged pull requests, many teams experience code review bottlenecks that prolong…

Understanding how developers feel about their work and value their contributions is often overlooked when measuring developer productivity. At the same time, some studies have shown that a better developer experience leads to increased productivity….

A data-driven mindset is key to eliminating bottlenecks and improving delivery time. This is why tracking Bitbucket statistics is crucial for development teams that are looking to streamline their processes….

A great developer experience is key to creating top-notch products and improving developer productivity. At Awesome Graphs, we rely on open-ended questionnaires to review our tools and processes and brainstorm…

One of the best ways to track developer activity is by using reports that visualize engineering metrics relevant to your team. However, as built-in graphs and reports are not available…