Table Filter and Charts with Dynamic Forms Created with ConfiForms

This year we continue our series of blog posts featuring powerful approaches to table data management in Atlassian Confluence. In our recent posts, we have already outlined the quick recipes of how to work with the Page Properties Report and JIRA Issues macros, dynamic Scaffolding tables, and data pulled from external databases.
This time we will show a quick, but efficient method to gather requirements from a group of stakeholders with a dynamic form created with ConfiForms add-on. And further process this data with Table Filter and Charts add-on.
So let’s get started!
ConfiForms add-on
ConfiForms. Data Forms & Workflows add-on is a powerful solution to design complex data entry forms with smart validation rules and customizable look. This add-on provides you with around 60 field types that you can use for building forms of any kind and for any purpose imaginable.
The collected data can be presented in a variety of views like cards, tables, lists, or can be combined into some intermediate view with the merged data and the look adapted to specific needs of yours.
In addition to this, you can take advantage of mathematical and boolean operators, as well as use different functions for performing advanced calculations on the collected data. The add-on provides you with the sufficient audit and control mechanism. You can track changes in the collected information and export this data to JSON, XML, Excel or CSV formats for further evaluation. The available API lets you quickly and easily migrate data between instances or load data from some external system or database. For the full list of add-on capabilies, see its documentation.
Designing the Form for Collecting Requirements
Is it easy to start a new project from scratch? Not, for sure. But what if try a new approach for gathering requirements from all involved stakeholders in Confluence? You can use the built-in blueprint for doing this, but it is so formal and there is too much information for entry at once.
Is not it better to create a separate form? So all stakeholders can quickly submit their requirements for the system or application you are planning to develop.
Let’s start from design of this form.
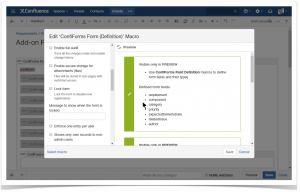
First of all, you need to insert the ConfiForms Form (Definition) macro on the page. Here you need to enter the form name, its title, and adjust the behavior of the form to different circumstances and situations.
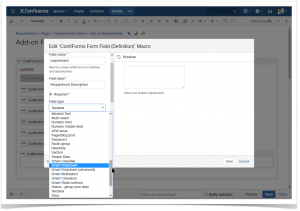
Once this is done, you can proceed to adding the data entry fields. And here’s a great set of fields to choose among.
You can add anything you want – captchas, text fields and areas, dropdown boxes, timestamps, calculated fields, and a lot of other useful fields. For each field, it is possible to set visibility and edibility by specific users or user groups, as well as apply validation rules and modify CSS styles.
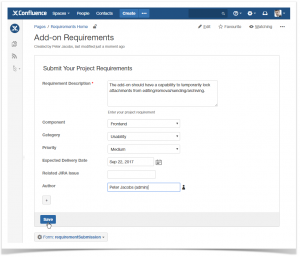
Once you have completed the design of your form, just add the ConfiForms Form Registration Control macro and save the page. Now it is ready for information submission and aggregation.
After saving, you can share the page with stakeholders and ask them to submit their requirements.
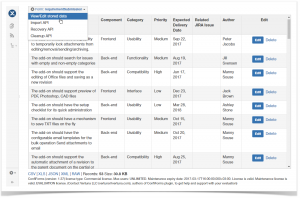
You can directly view the submitted information by clicking the button with the cogwheel located under the submission form. Here, you can look through the collected requirements and update them if some information is missing. Optionally, you can download a CSV, XLS, JSON or XML file with the collected data.
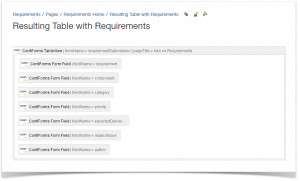
ConfiForms add-on also provides a capablity to output a table with collected results on any Confluence page and this is what we really need. For doing this, you need to insert the ConfiForms Table View macro and add the ConfiForms Form Field macros, one macro for each data input field used on the form. If needed, you can skip adding some column for this or that field, so this information will not be available in the resulting table. While doing this you need to enter the form name, page name hosting the form, and field names for building the correct correspondences between fields and outputting columns.
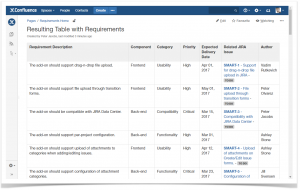
After saving the page, you get a table listing all the submitted requirements.
Once the requirements are collected and verified, it is time to manage them. For doing this we need some tool, that will provide us with filtration, aggregation and visualization capabilities, so we can get the big picture of our project.
Table Data Management in Confluence with Table Filter and Charts
Table Filter and Charts add-on is the right tool which gives enough flexibility and power to manage tables in Confluence and transform them into the readable and easily-perceptible format.
So what capabilities does this add-on offer?
The add-on provides you with a rich set of filters that you can apply to any data format in your tables. The following filter types are available:
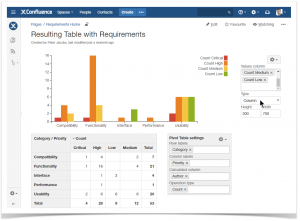
In addition to various filters, you get two macros to aggregate table data in the form of a pivot table in Confluence, and further visualize this summarized information with the dynamic chart.
Watch the video tutorial and find out how to do this with Table Filter and Charts add-on!
If you have any questions, feel free to drop an email to tech-support@stiltsoft.com


