


Extend izi – LMS for Confluence with Table Filter and Charts Add-on
With izi – LMS for Confluence you can create tests and quizzes to assess job candidates, evaluate the skills and knowledge of employees, set up training courses in Confluence. You can assign a quiz to participants (including people without a Confluence account) by sharing a quiz link via email or set up a page for self-enrollment to let users select and take quizzes at their pace.
Table Filter and Charts for Confluence provides filters, pivot tables, charts and graphs that you can use for basically any table in Confluence, including tables generated by izi LMS.
hese capabilities can be a big help when working with tables of:
- Quiz Reports and Quiz Results Reports
- Course Results Reports
A quiz administrator can benefit by using the following features of Table Filter and Charts:
- filters to easily find needed records in the report and hide report columns
- exporting results to CSV and create custom reports in Excel
- pivot tables to get ‘average’ and ‘total’ statistics of scores, statuses and results
- graphs and charts to visualize the results data
Let’s learn more about izi LMS reports and see how they can be extended with Table Filter and Charts.
Quiz Reports
By default each quiz has two reports:
Quiz Results – where you can track participants’ progress over this quiz and check their answers.
Quiz Questions – which can help you find out the questions participants fail more often than others
Quiz administrators can use the Quiz Results Report macro to build custom quiz reports based on their needs. For example:
- all quizzes of a specific person – to track quizzes of a particular participant
- all quizzes and all participants – to use it as a dashboard or global report
- several quizzes – in case you have several connected quizzes and want to track them all in one place
Hint: To set up the results report of one particular quiz (e.g. to share it with participants), you can simply copy the report from a quiz administration page and paste it on another Confluence page.
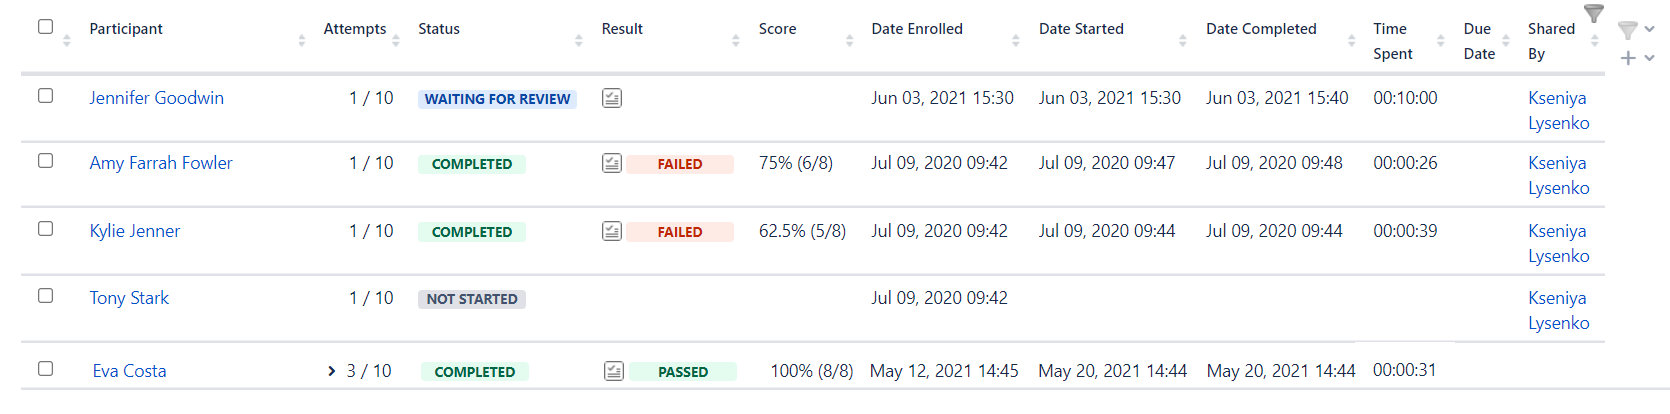
Table Filter and Charts Macros
Table Filter and Charts works using three macros:
- Table Filter – provides filters of different types
- Pivot Table – summarizes table values
- Chart from Table – visualizes table data with dynamic graphs and charts
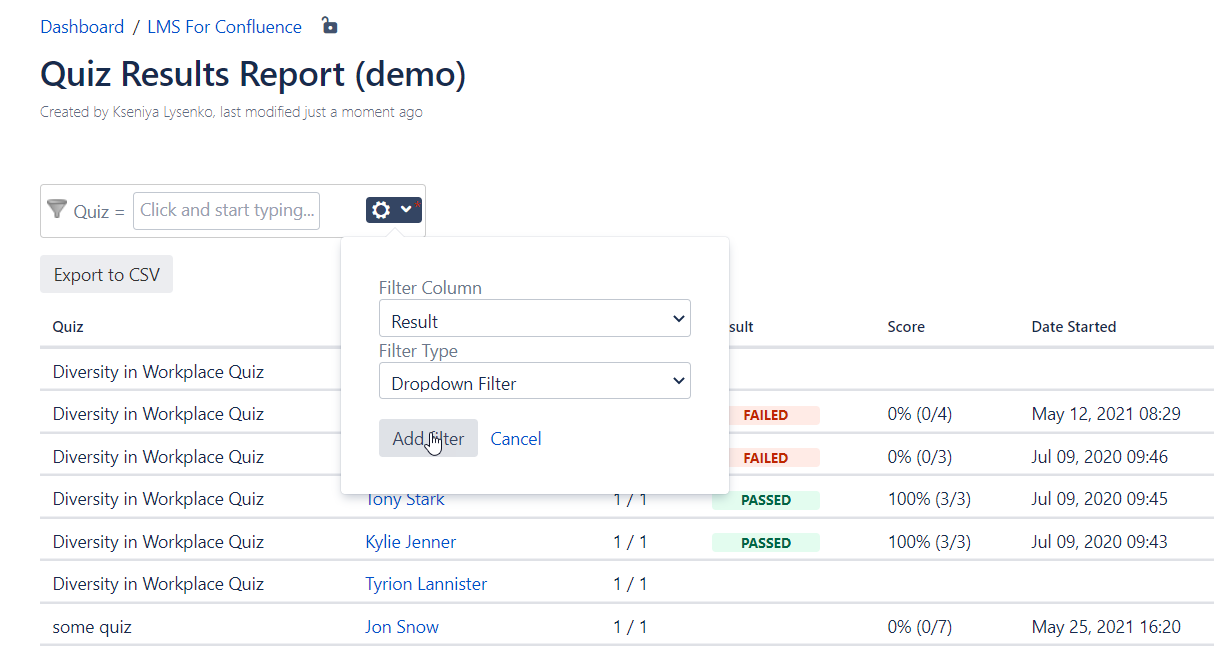
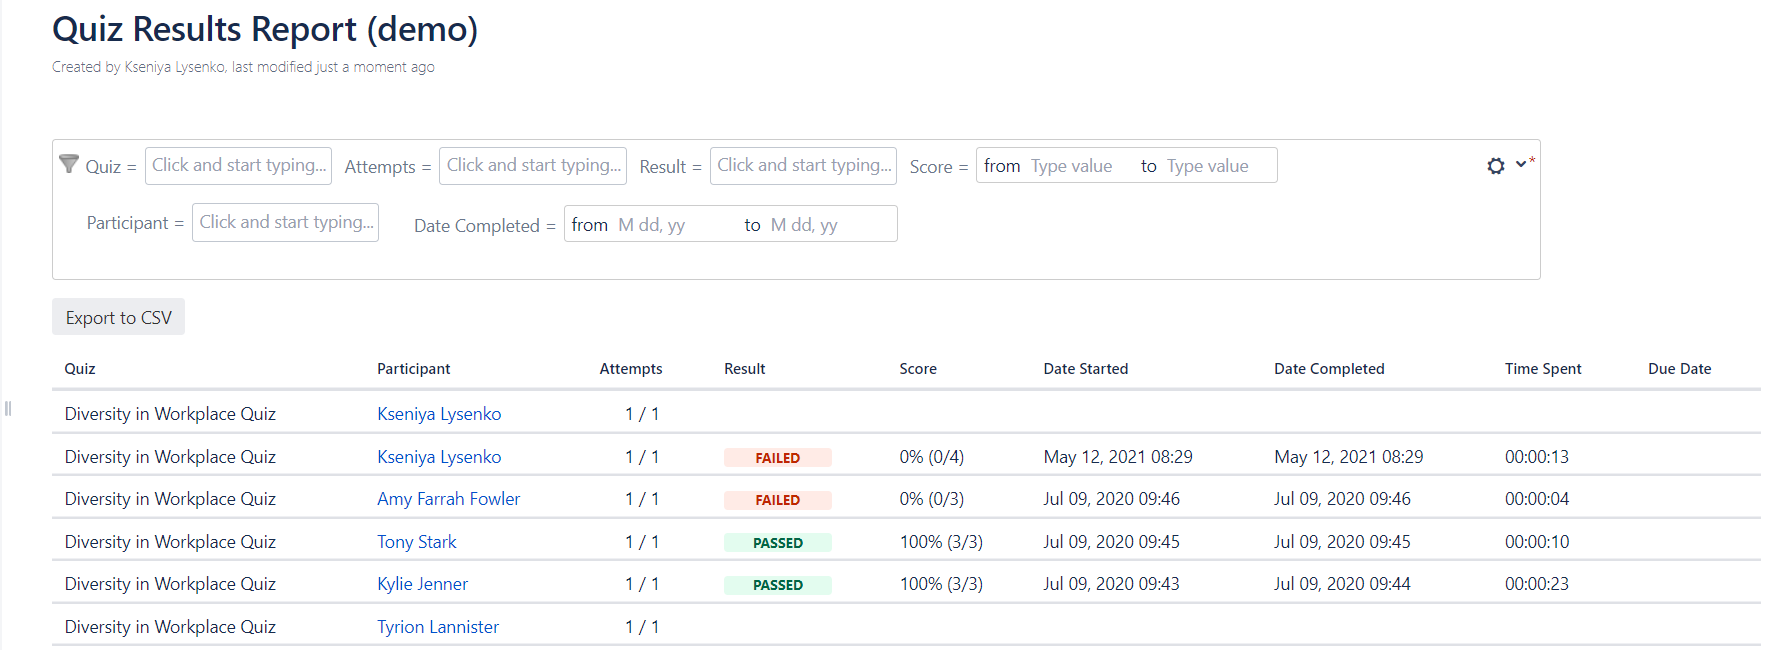
Sample Quiz Results Report
- Dropdown Filter (for Status column) – to see participants who haven’t taken course/quiz yet, completed or overdue it.
- Free Text Filter (for a column with a single choice question) – to learn what participants answered the question wrong (type the correct answer option in the filter and revert it)
- Number Filter (for Score column) – to browse participants who had a score within a given range (enter from and to values in the filter)
- Date Filter (for Date Started or Date Completed column) – to view course or quiz submissions for a certain time period (enter from and to values in the filter)
- Hide Columns Filter – to dynamically collapse and expand columns of the report
Pivot Table
- Count by Result – to see how many participants have failed and passed a course/quiz
- Average of Score – to get the average score for a quiz
Chart from Table
- Pie Chart by Status – to view the breakdown of courses and quizzes ( who Started/Not Started, Completed or Overdue).
- Bar Chart by Question success rate – to see at a glance the questions with the lowest success rates (can be the most difficult or poorly written questions)
- Average course progress of all participants in all courses.
- Filter on Course status (completed, started, overdue)
Below are step-by-step examples of combining izi – LMS for Confluence and Table Filter and Charts. You can adjust them to create your own combinations.
Filter Report with All Quizzes and All Participants
Report used: Quiz Results report with all quizzes and all participants
Filters used:
- Dropdown Filters for Quiz, Status, Results columns
- Free text Filter for User column
- Number Filter for Score column
- Date Filter for Date Started column
- Hide Columns Filter for the whole report
Steps:
- Open the page with the report in the editor.
- Insert Table Filter macro and move Quiz Results Report macro inside Table Filter macro.
- Save the page – you can set up the filters in the View mode.
- Add filters one by one by selecting columns you want to use for a filter and a filter type.
- Save changes.
- Now your report has the filtration panel.
Hint: Collapse the filtration panel when you don’t need it.
Summarize Report with All Quizzes of a Single Participant
Report used: Course Results Report with all quizzes of a selected participant.
- Open the page with the report in the editor.
- Insert Pivot Table macro and move Course Results Report macro inside Pivot Table macro.

3. Save the page – you can manage the pivot table in the View mode.
4. Select Count in Operation type, Status in Calculated column and Row labels.
5. Save changes.
6. Your pivot table is ready.
You can have a similar pivot table for Quiz Results Report. Just change values in Calculated column.
Hint: You can hide the source table (the report itself) and/or the control panel to only view the pivot table. It can be useful when your pivot table is located on a dashboard.
Combine Table Filter and Charts Macros to Empower Course Results Report
Reports used: Course Results Report based on a course.
Macros used:
- Table Filter: Dropdown Filters for Status, Results columns; Free text Filter for User column; Number Filter for Score column; Hide Columns Filter for the whole report
- Pivot Table: Count by Result
- Chart form Table: Pie chart by Result
Steps:
- Create a report based on some course.
- Embed Course Results Report, Table Filter, Pivot Table, Chart from Table macros as shown below.

- Save the page to continue in the View mode.
- Set up filters in the report (See the ‘Filter Report with All Courses and All Participants’ section).
- Generate a pivot table with Count by Result (See the ‘Summarize Report with All Quizzes of a Single Participant’ section).
- Configure a pie chart – just select Pie in Type – the chart will be built from the pivot table.

Conclusion
Learning administrators can easily build custom reports suitable for their goals. Table Filter and Charts gives you powerful and easy-to-use tools to get the most out of tracking training in Confluence. Combining all 3 macros of Table Filter and Charts, you get filters, charts and pivot tables working together and dynamically updating as you change their settings.
Try izi – LMS for Confluence and Table Filter and Charts for free and have assessments, tests and courses right in your Confluence!


