


New in Awesome Graphs for Bitbucket Cloud: Lines of Code Statistics and Aggregated Stats for All Repos

Awesome Graphs for Bitbucket Cloud visualizes statistics of Git repositories. View this video to see the new features and the improvements we’ve recently made to the app or keep reading.
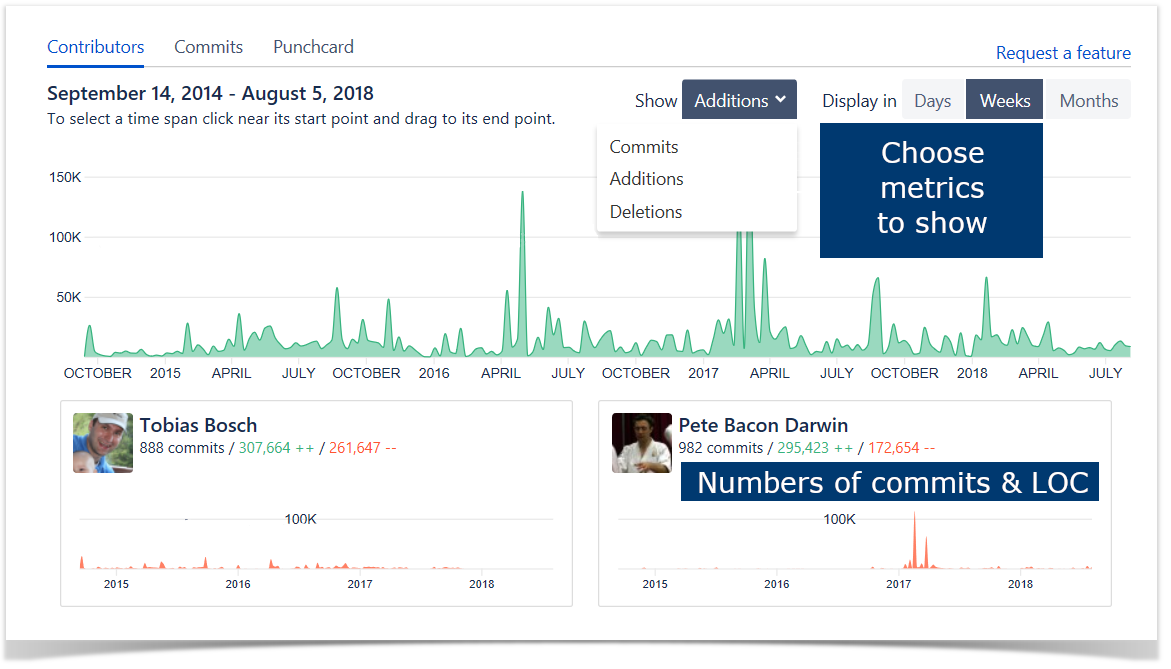
Lines of code statistics
Previously Contributors graph showed only commits statistics. Now it visualizes repository and user activity in terms of lines of code (LOC).
You can choose what data to show on the summary graph and individual contributor graphs:
- commits
- added lines of code
- deleted lines of code
Lines of code metrics are more informative than the number of commits. They will help you to get a better understanding of project activity and efficiency of your team members.
Aggregated stats for all repositories
Now Awesome Graphs can show Contributors, Commits, and Punchcard graphs with aggregated statistics across all repositories of a user or a team.
This feature will help you to:
- see your personal progress
- monitor performance of your team
- evaluate work of your team members

Awesome Graphs for Bitbucket Cloud is an analytical tool visualizing repository and user activity. With it, you can evaluate team’s performance, track process improvements, and deliver products faster by eliminating guesswork. Try the app now for free!
Learn more about how to install Awesome Graphs or click here to install the app.


