


How to Perform Code Review and Track Team Activity in Bitbucket
Resolution Time Distribution Reports have helped a lot during the development of a high priority module to increase the reviewers, review frequency and also track team activity in Bitbucket.
Eduard Pal, Innoface
Innoface GmbH, one of our customers, is one of the leading providers of interfaces between PDM and ERP systems worldwide. Its applications help ensure a direct and reliable flow of information between engineering and logistics. They also offer additional products and services in order to facilitate seamless integration of the involved systems.
Innoface product development team uses Awesome Graphs for Bitbucket mostly for making data-driven management decisions. They find it very useful to:
- track the activity of each developer and a team in general;
- check if code review goes according to the plans;
- predict time to resolve pull requests.
Let’s see how Innoface benefits from using Awesome Graphs for Bitbucket.
Tracking team activity in Bitbucket
Activity graph helps Innoface have a high-level overview of the total number of commits and contributors in a specific period, for example, a week. It also provides an opportunity to track the number of open pull requests from all the contributors and the repositories.
Using this graph, the manager can assess the activeness of a contributor. This gives the manager an idea of whether an employee is following the company’s development policy or not as well.
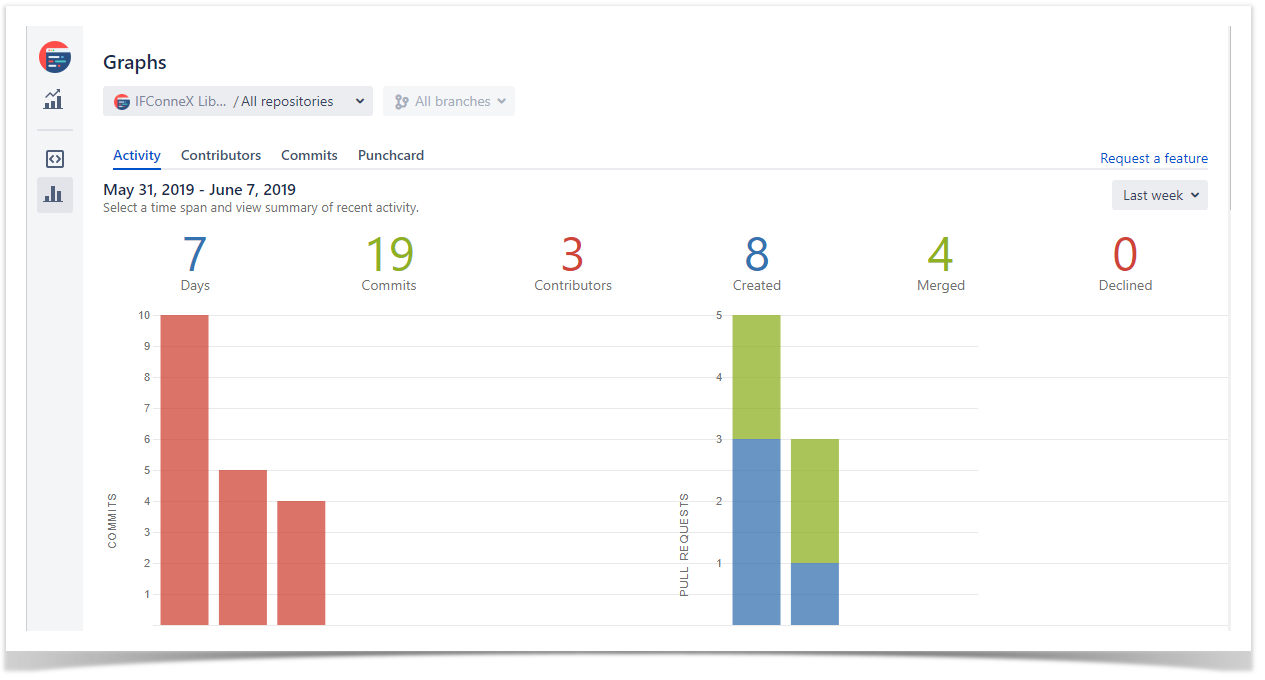
Based on the number of open pull requests, the manager in Innoface can actually plan time to review the code and merge them. This graph also gives an opportunity to process the pull requests from the contributors that are working on the high-priority projects.
Analyzing code review practices
Innoface management finds Resolution Time Report very helpful when it comes to tracking the frequency of processing the pull requests.
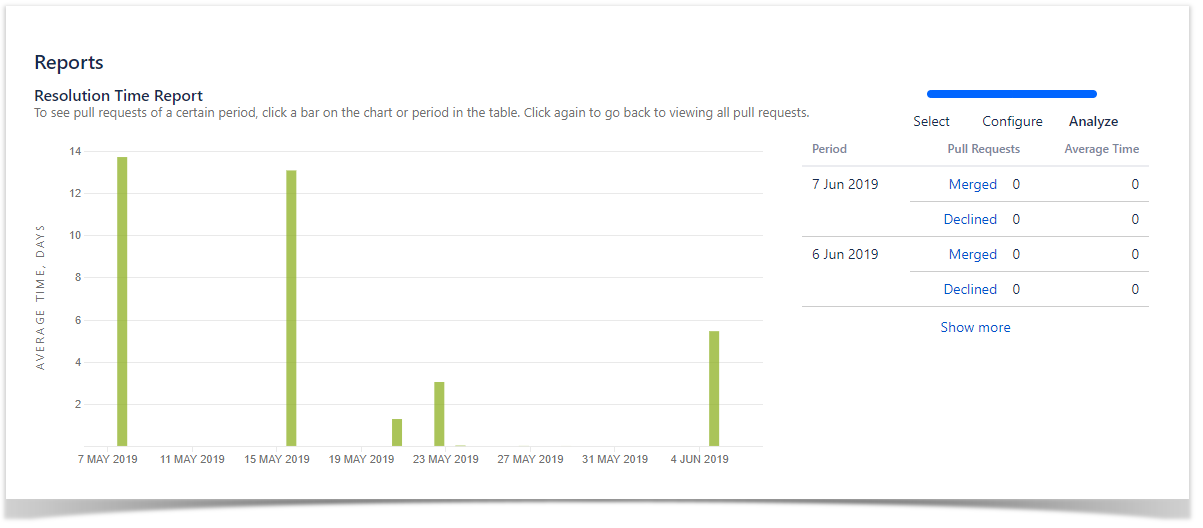
The manager uses this report in order to see the frequency with which the reviewers are processing the pull requests. Based on the data that this report provides, it’s easier to make a reasonable decision and to assign either more reviewers or increase the frequency of the reviewers, especially for the high-priority projects.
Predicting pull requests resolution time
Resolution Time Distribution report helps Innoface estimate resolution time for future pull requests to make more accurate release dates planning.
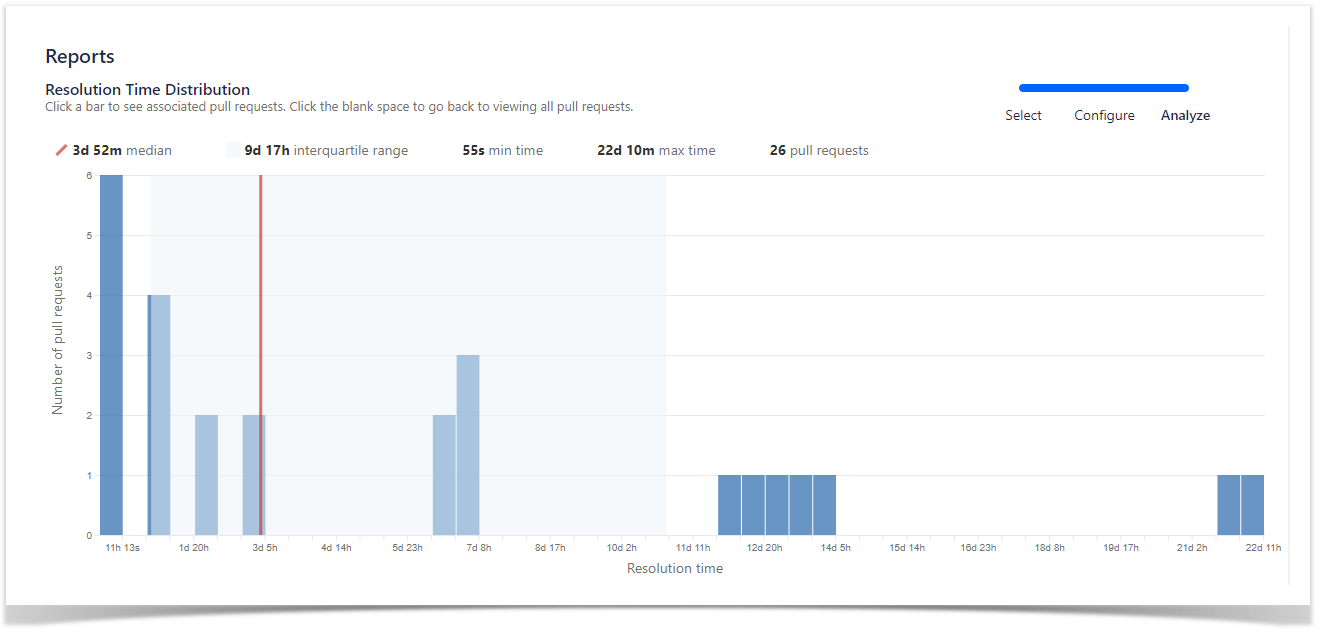
The manager of a product team uses this report in addition to the Resolution Time Report in order to estimate the resolution time for future pull requests.
Conclusion
Awesome Graphs greatly enriches the Bitbucket user experience for Innoface. With its help, it becomes much easier to make decisions based on data and keep an eye on how efficient their development practices are.
Read more case studies to see how our customers benefit from using Awesome Graphs for Bitbucket in their work:


