


Introducing New Feature: Graphs for Teams in Awesome Graphs

There is no doubt that effective working and communication processes in a team greatly influence the overall success of a product or company. Atlassian products like Bitbucket, Jira, and Confluence aim to improve collaboration and bring distributed colleagues together.
Awesome Graphs for Bitbucket app is our contribution to the teamwork of more than 2,000 companies, as its primary goal is to help identify the bottlenecks in the development workflow and increase the speed. We are eager to make the processes transparent for both developers and managers and, thereby, improve the communication and narrow the gap between them.
We’ve discovered that lots of our clients use similar workflows: they have multiple teams working on the same project or repository. Therefore, tracking the productivity of a particular group that a project or delivery manager, or team lead manages can be tricky as the app showed graphs for all the activity across a project or repository that included the statistics about all the teams together. That’s why we decided to implement a feature that can make their lives easier: graphs for teams.
View the statistics for your team
Teams feature is designed to visualize the statistics about your team performance if there’s a lot of people working on a project or repository. It excludes the contributions of the members of other teams and helps get rid of noisy data.
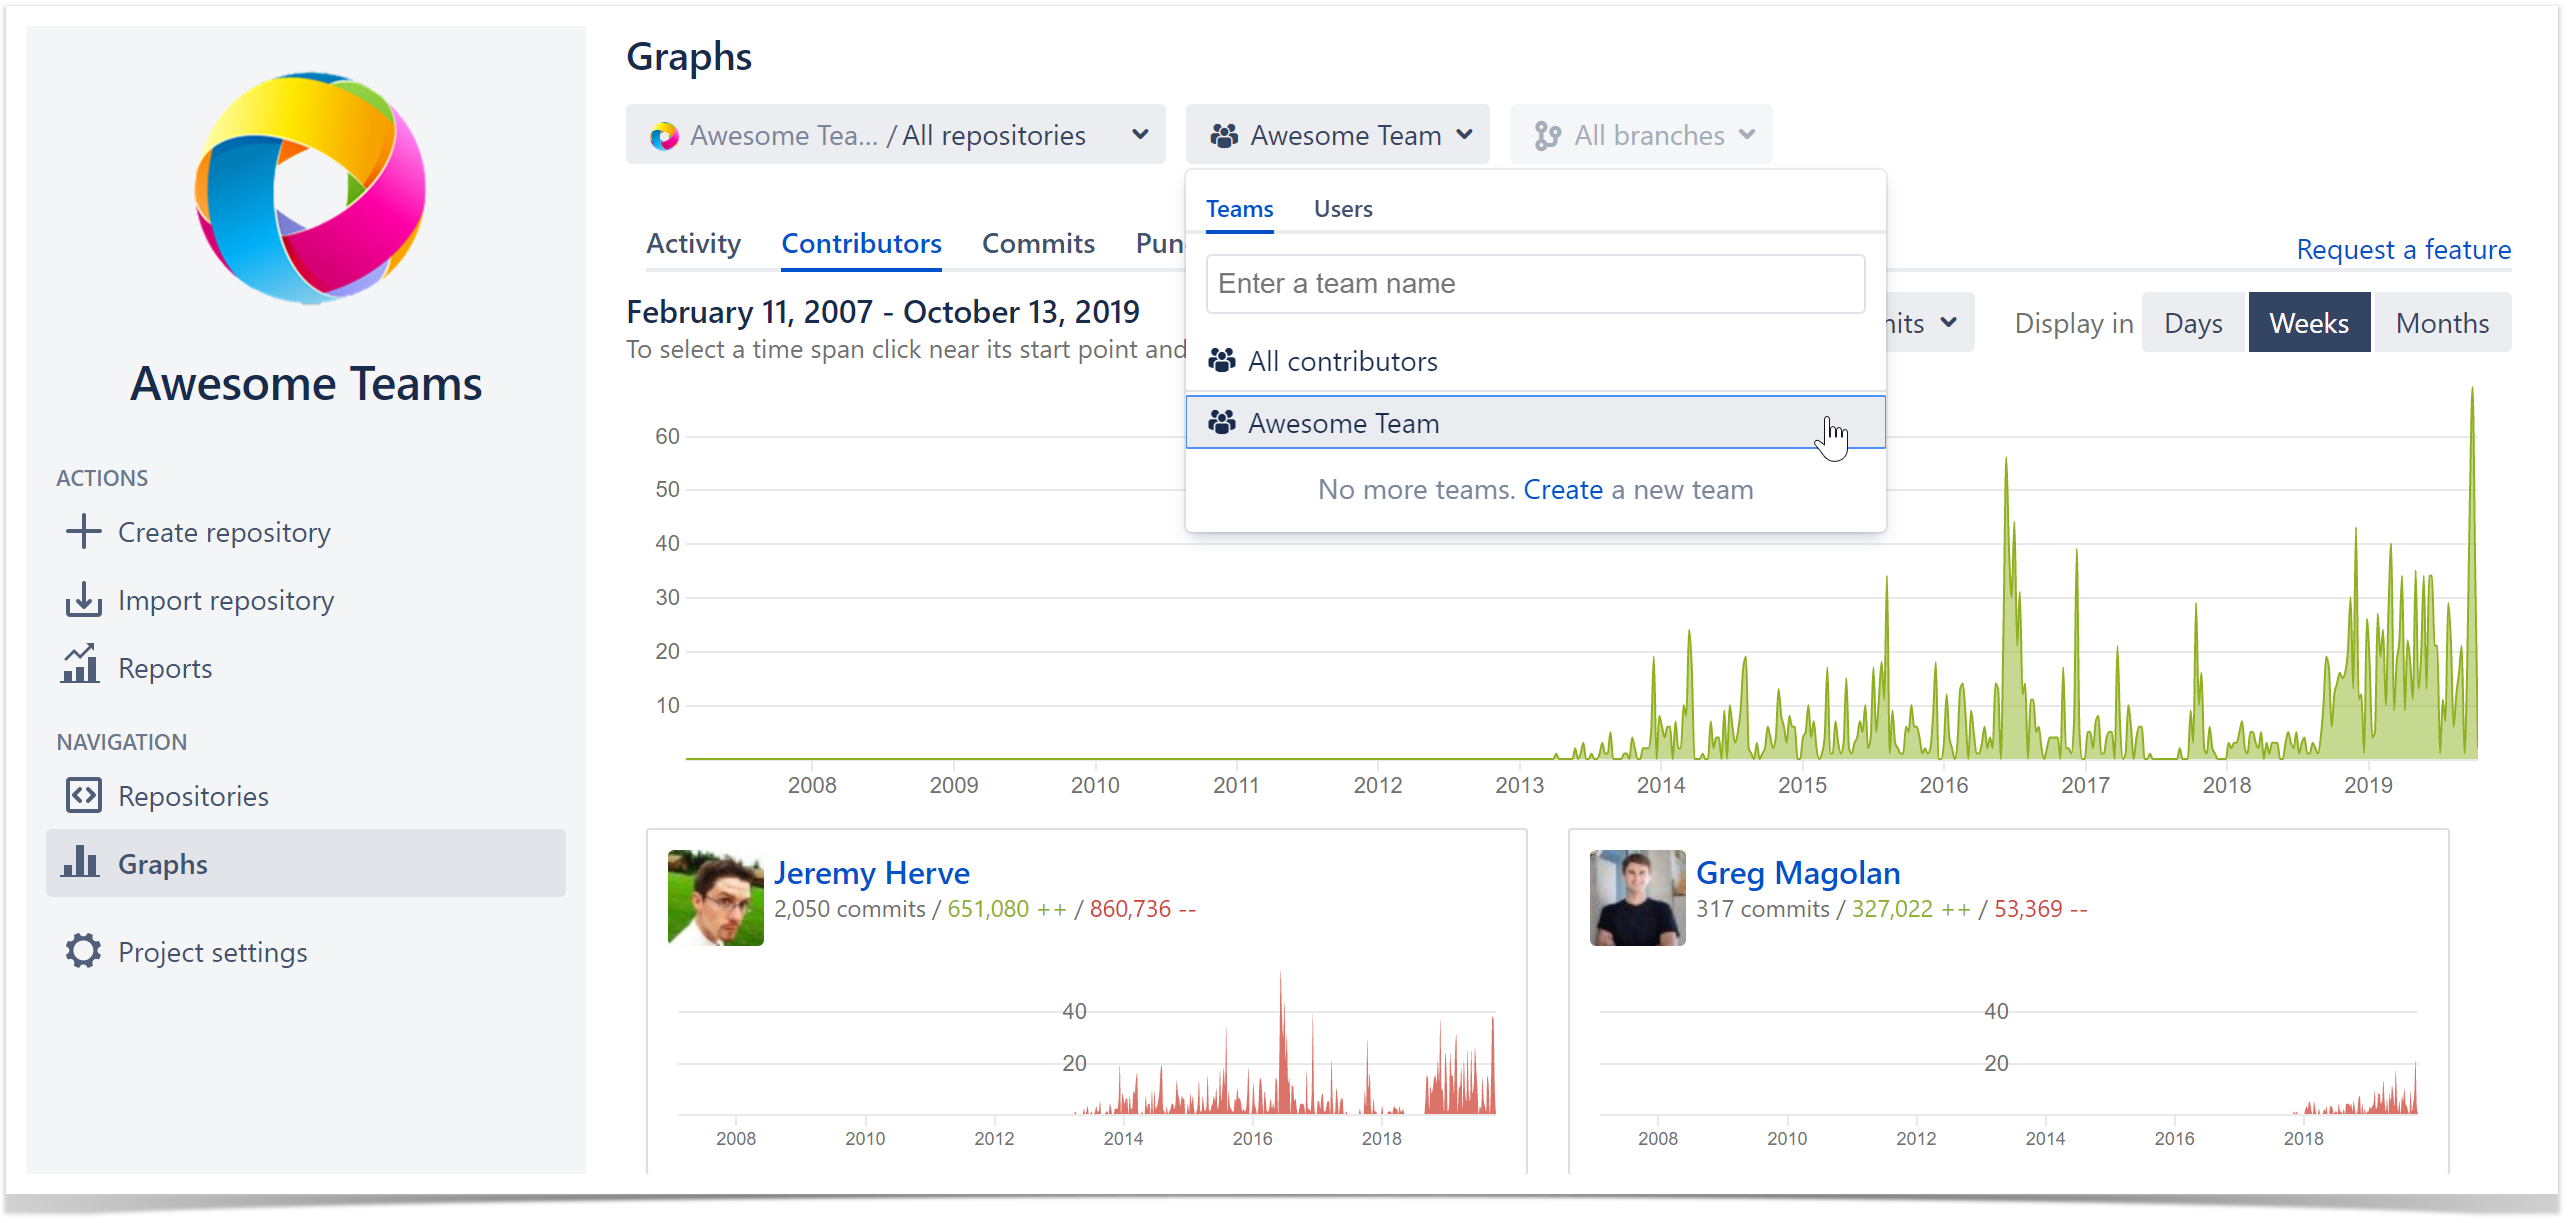
Configure your teams in the settings and choose it in the All contributors drop-down menu on the Graphs page and analyze how much commits, pull requests, and lines of code a team produces apart from others.
Compare the activity of different teams
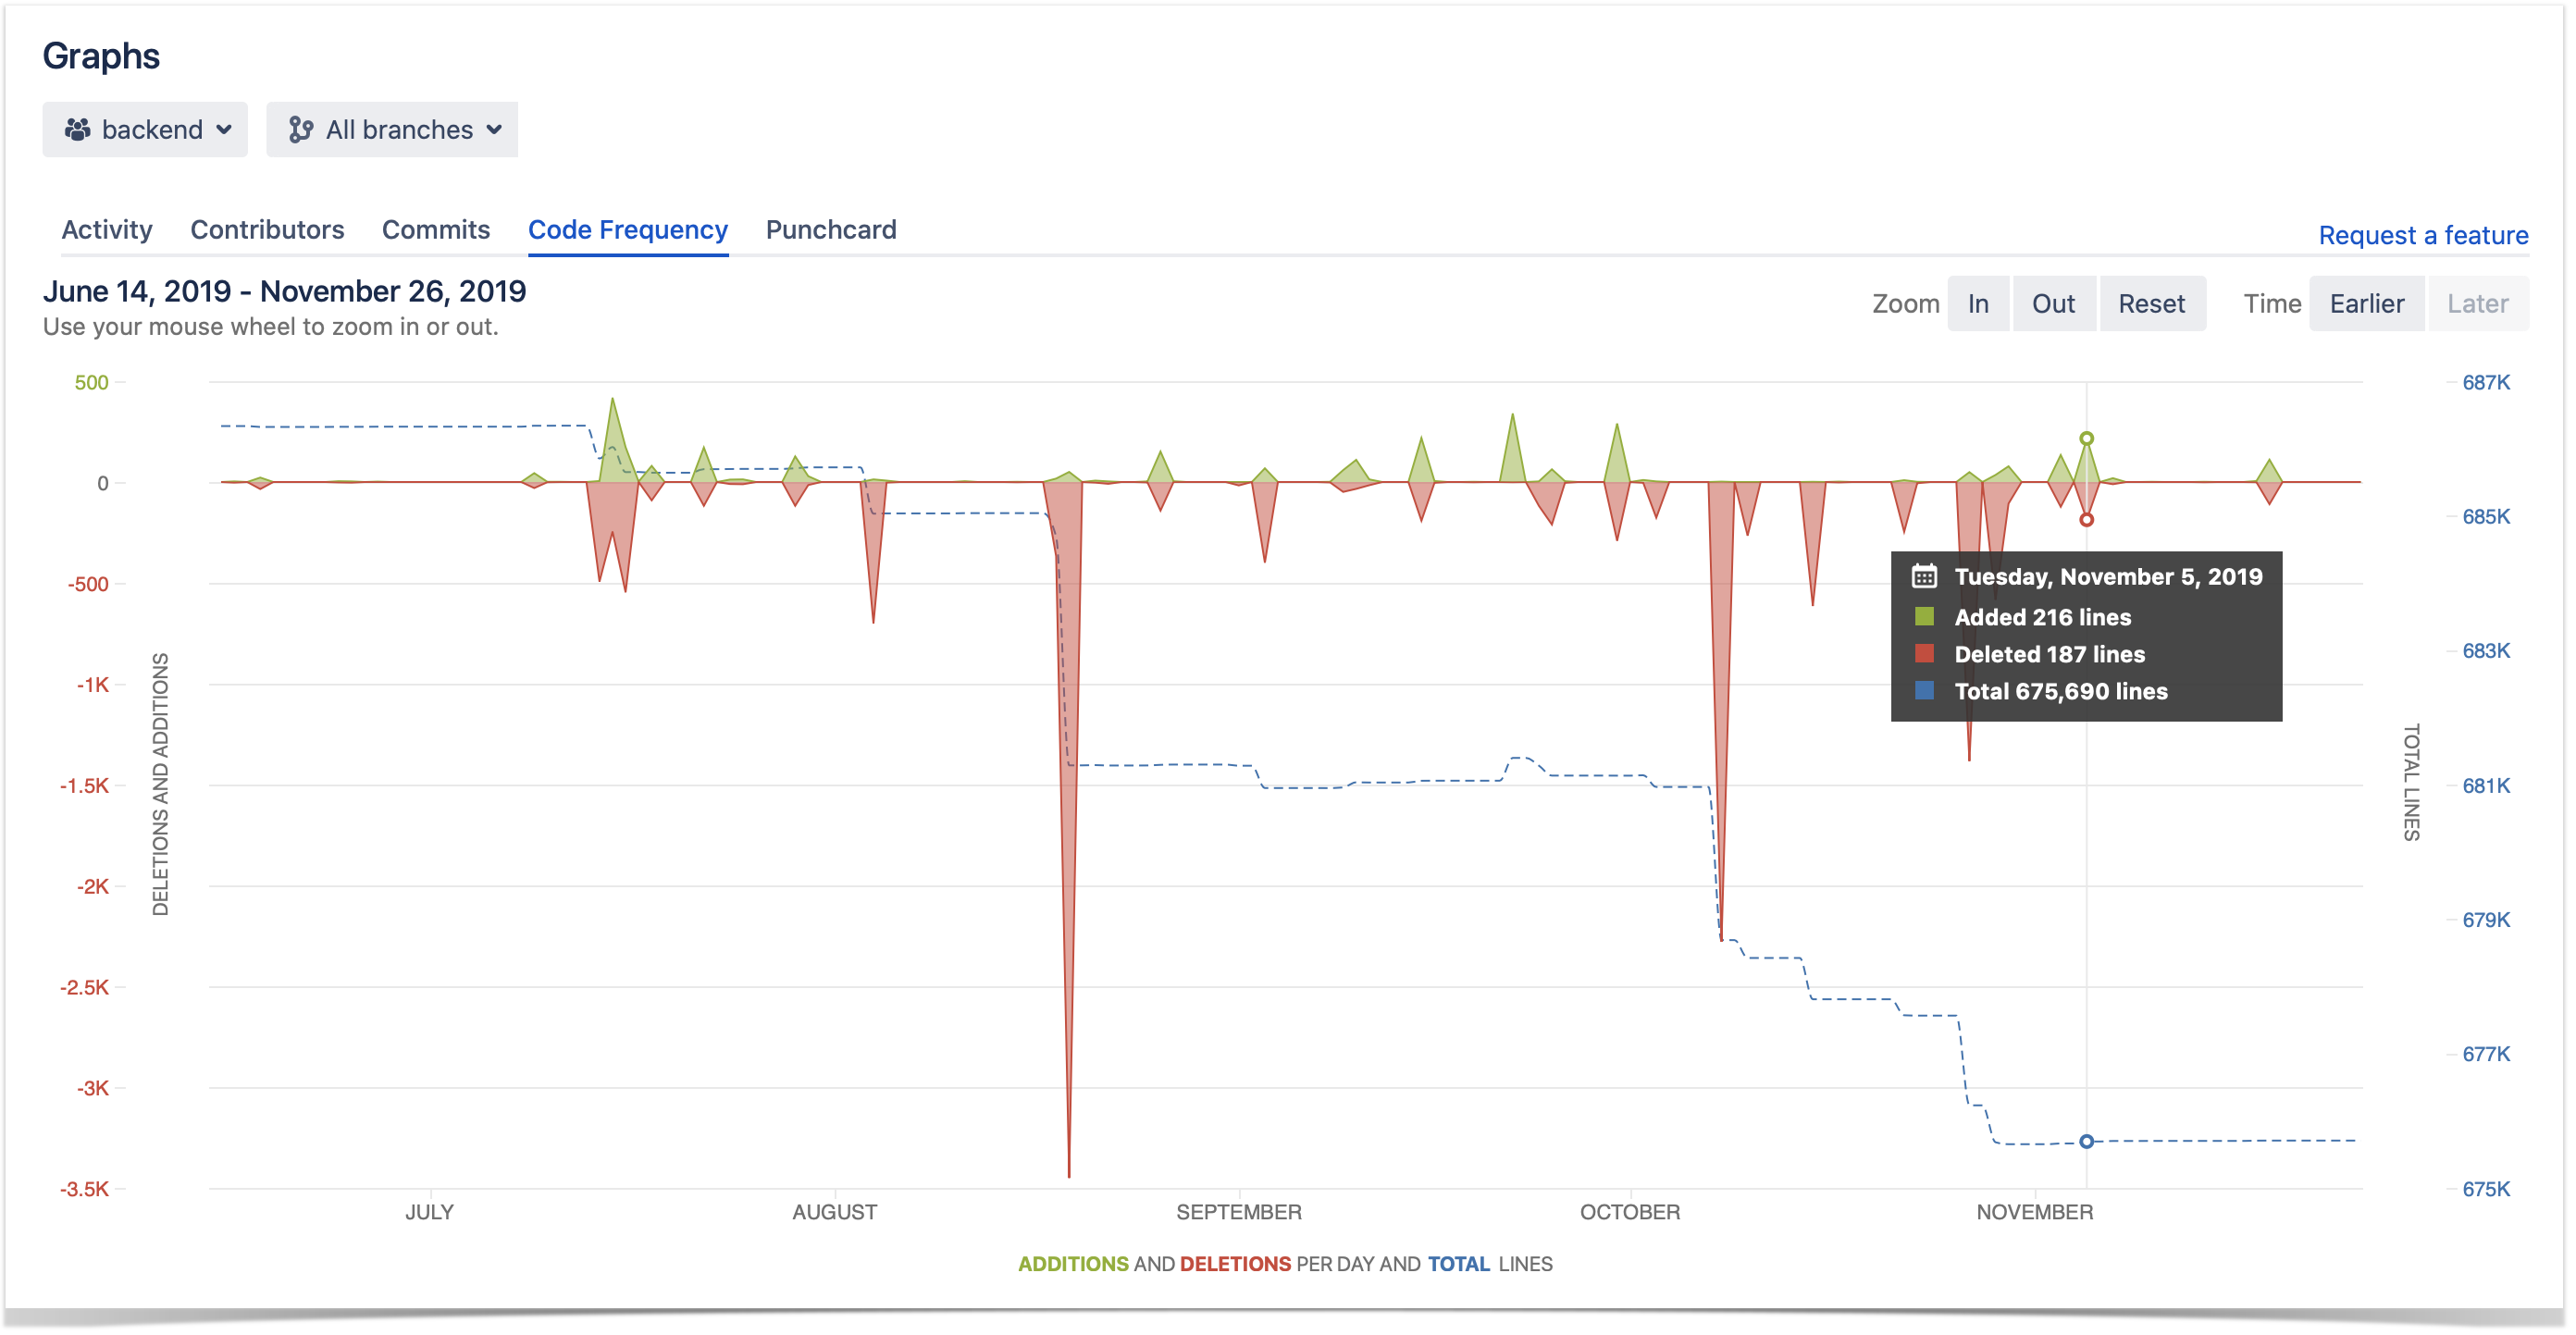
If you manage multiple teams working on the same project or repository, you may find it useful to separate their statistics from each other. For example, compare their impact in a codebase of your repository using the Code Frequency graph. That’s what you can easily do with our new feature!
Let’s say you manage two teams: back-end and front-end developers. Open a graph for each team in different tabs and compare their performance.
From the screenshot below, you may identify that your back-end team is continuously deleting the lines of code. They are probably involved in some bug fixing or refactoring activities or implement changes in the API.
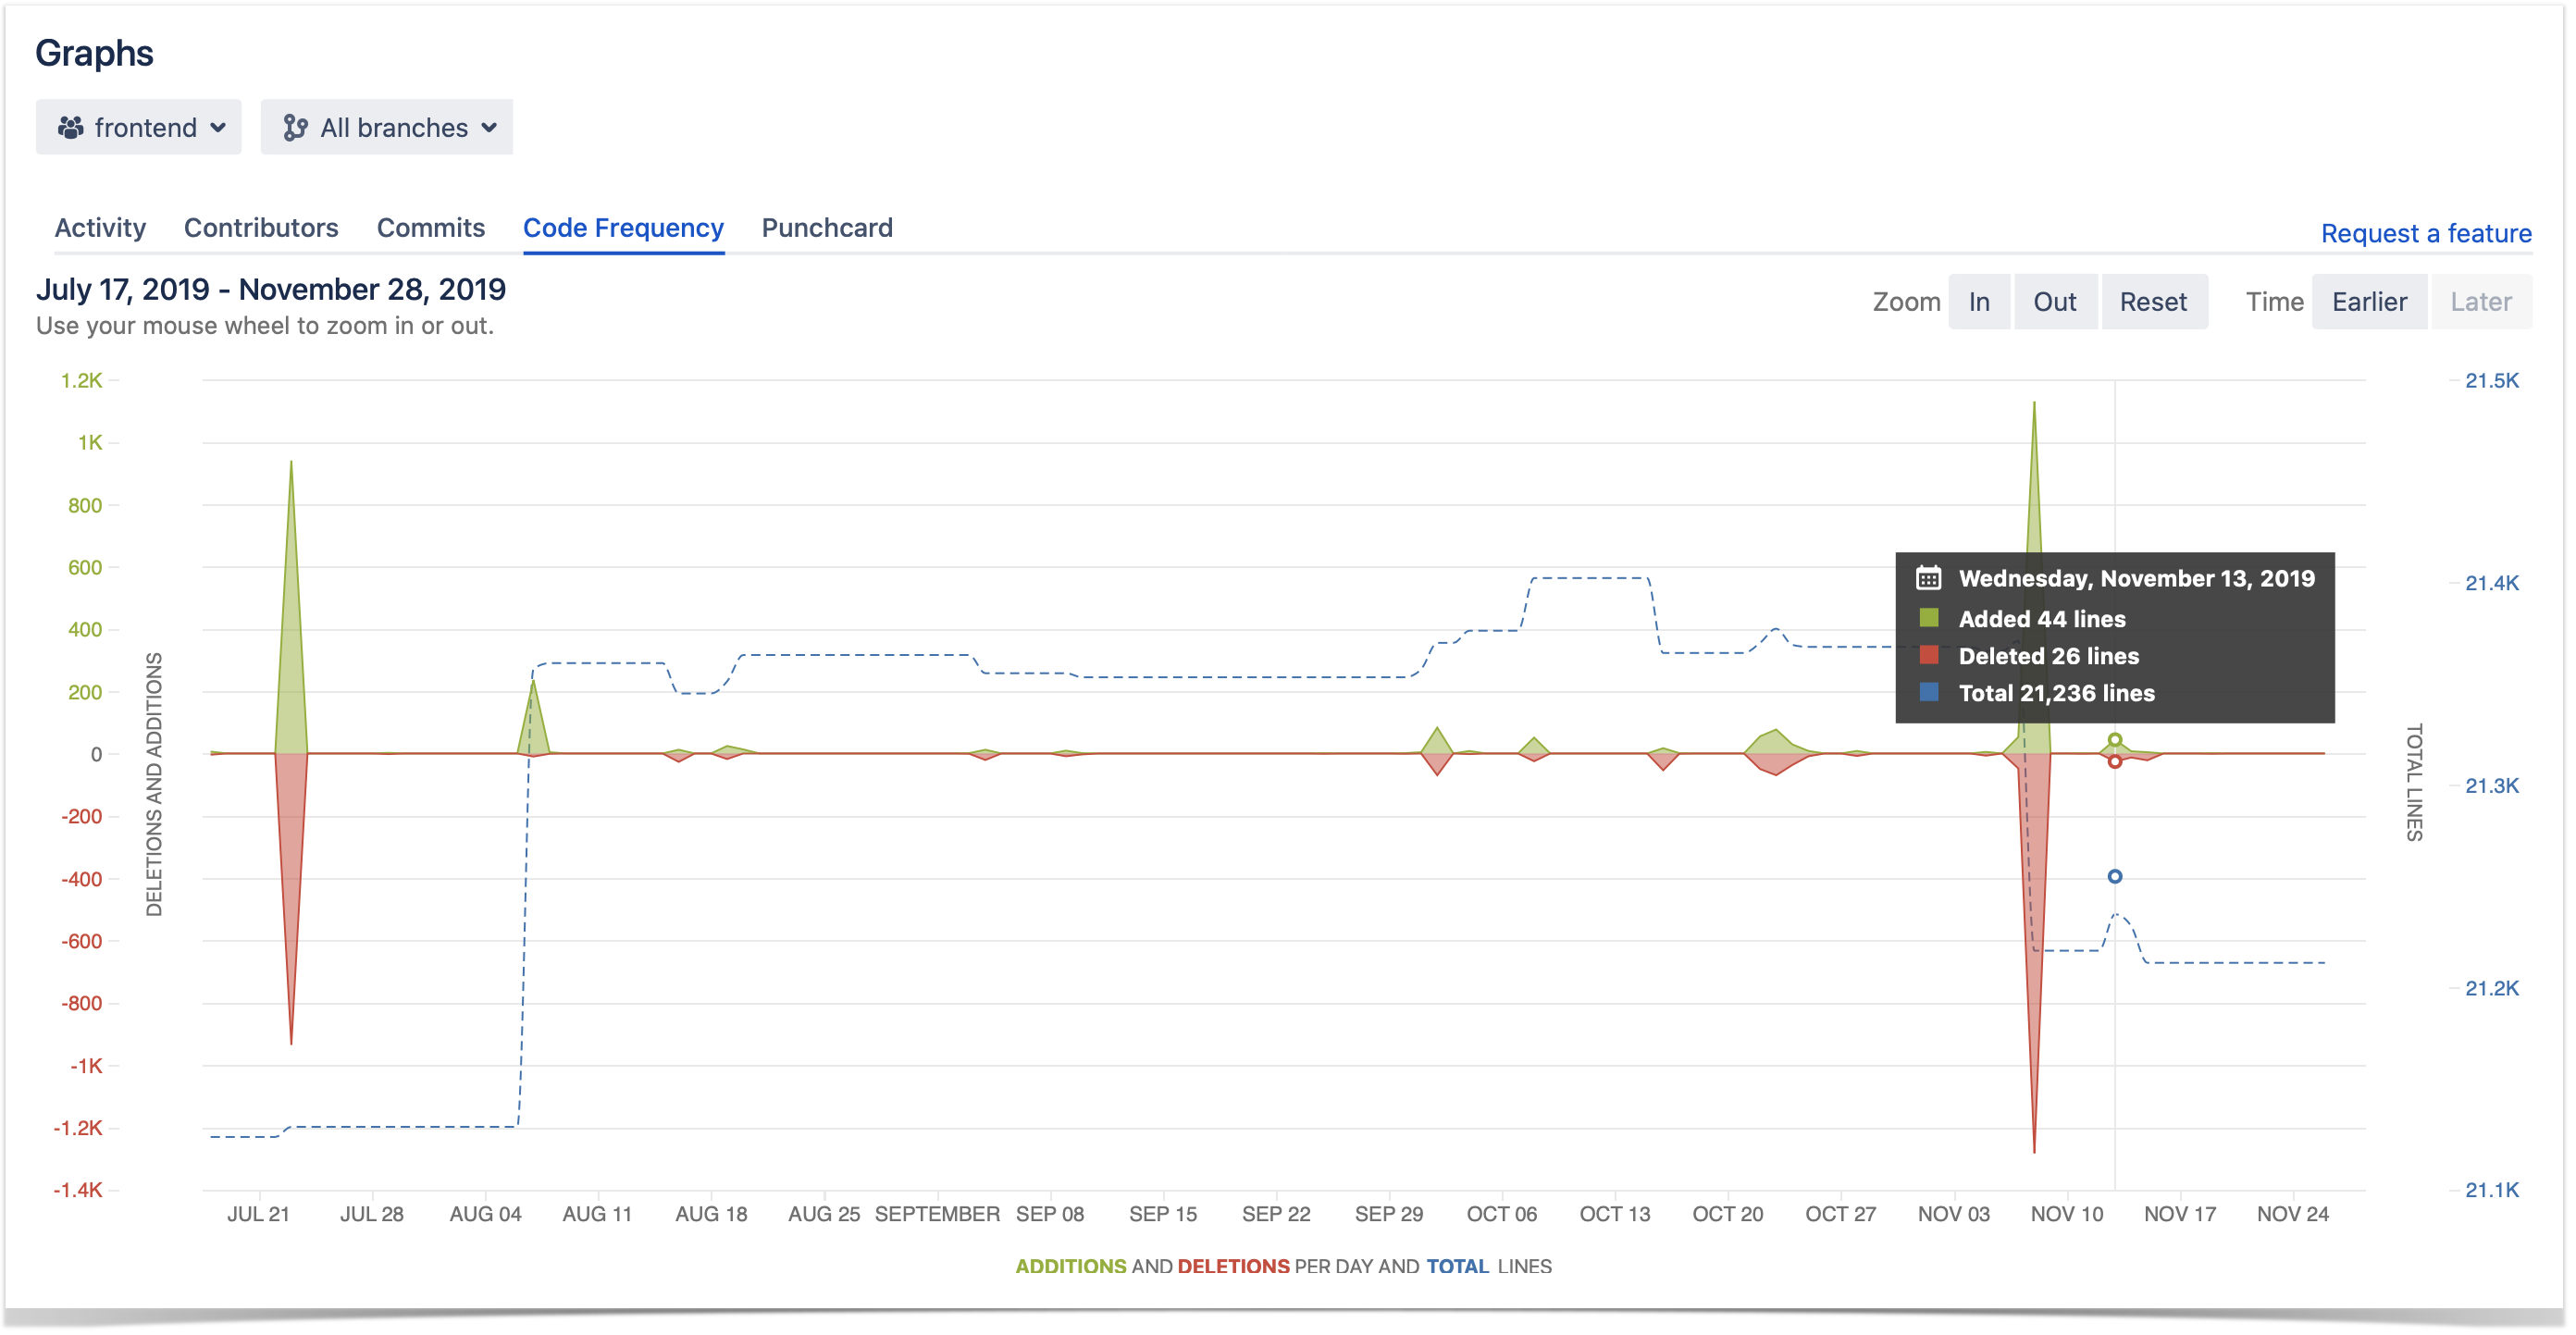
Meanwhile, the front-end team has to rewrite some pieces of code to adjust the changes in the backend.
Exclude automated users from the statistics
If you use automation in your repositories, the graphs may show the information that is not related to the activity of your team. Lots of commits and lines of code added by CI/CD users and automated scripts may complicate the performance analysis since it’s not obvious which contributions are made by real people and which of them are not.
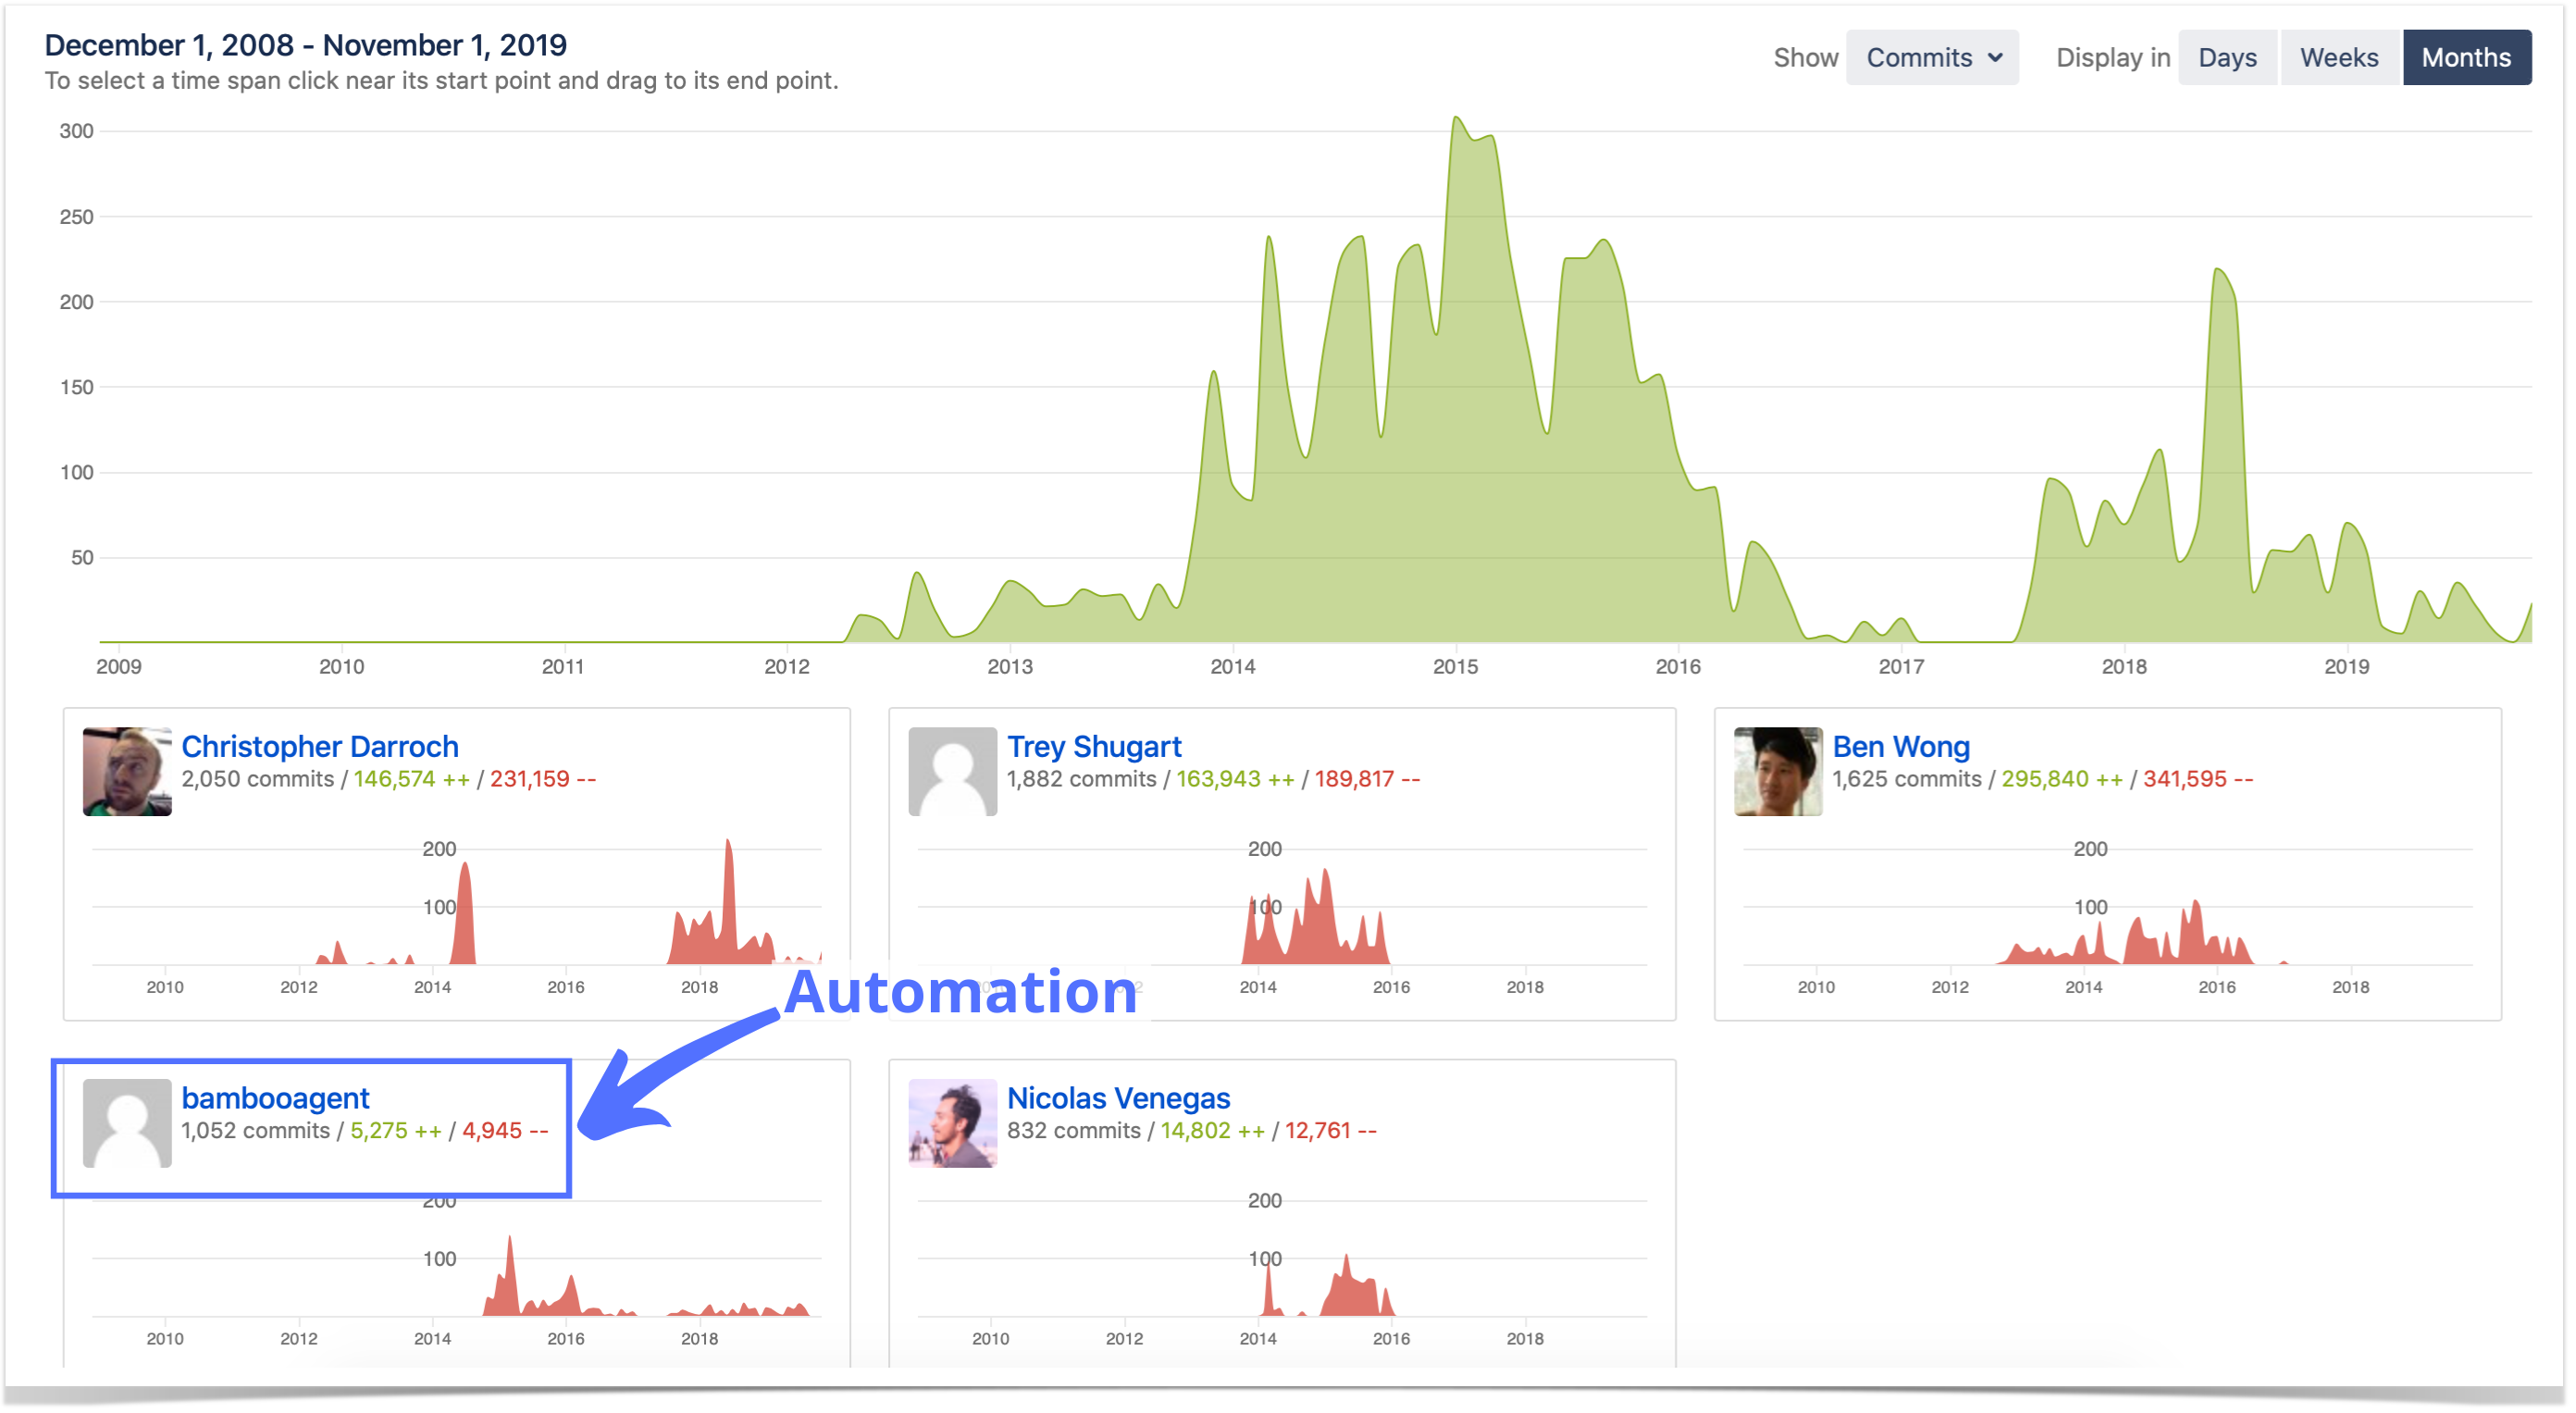
Use teams feature to solve this problem by creating a team with all the people you need except for the automated users.
Teams management
A team can be made on the global, project, and repository level by the user with administrative permissions on this level. A team can include whole Bitbucket groups or individual users.
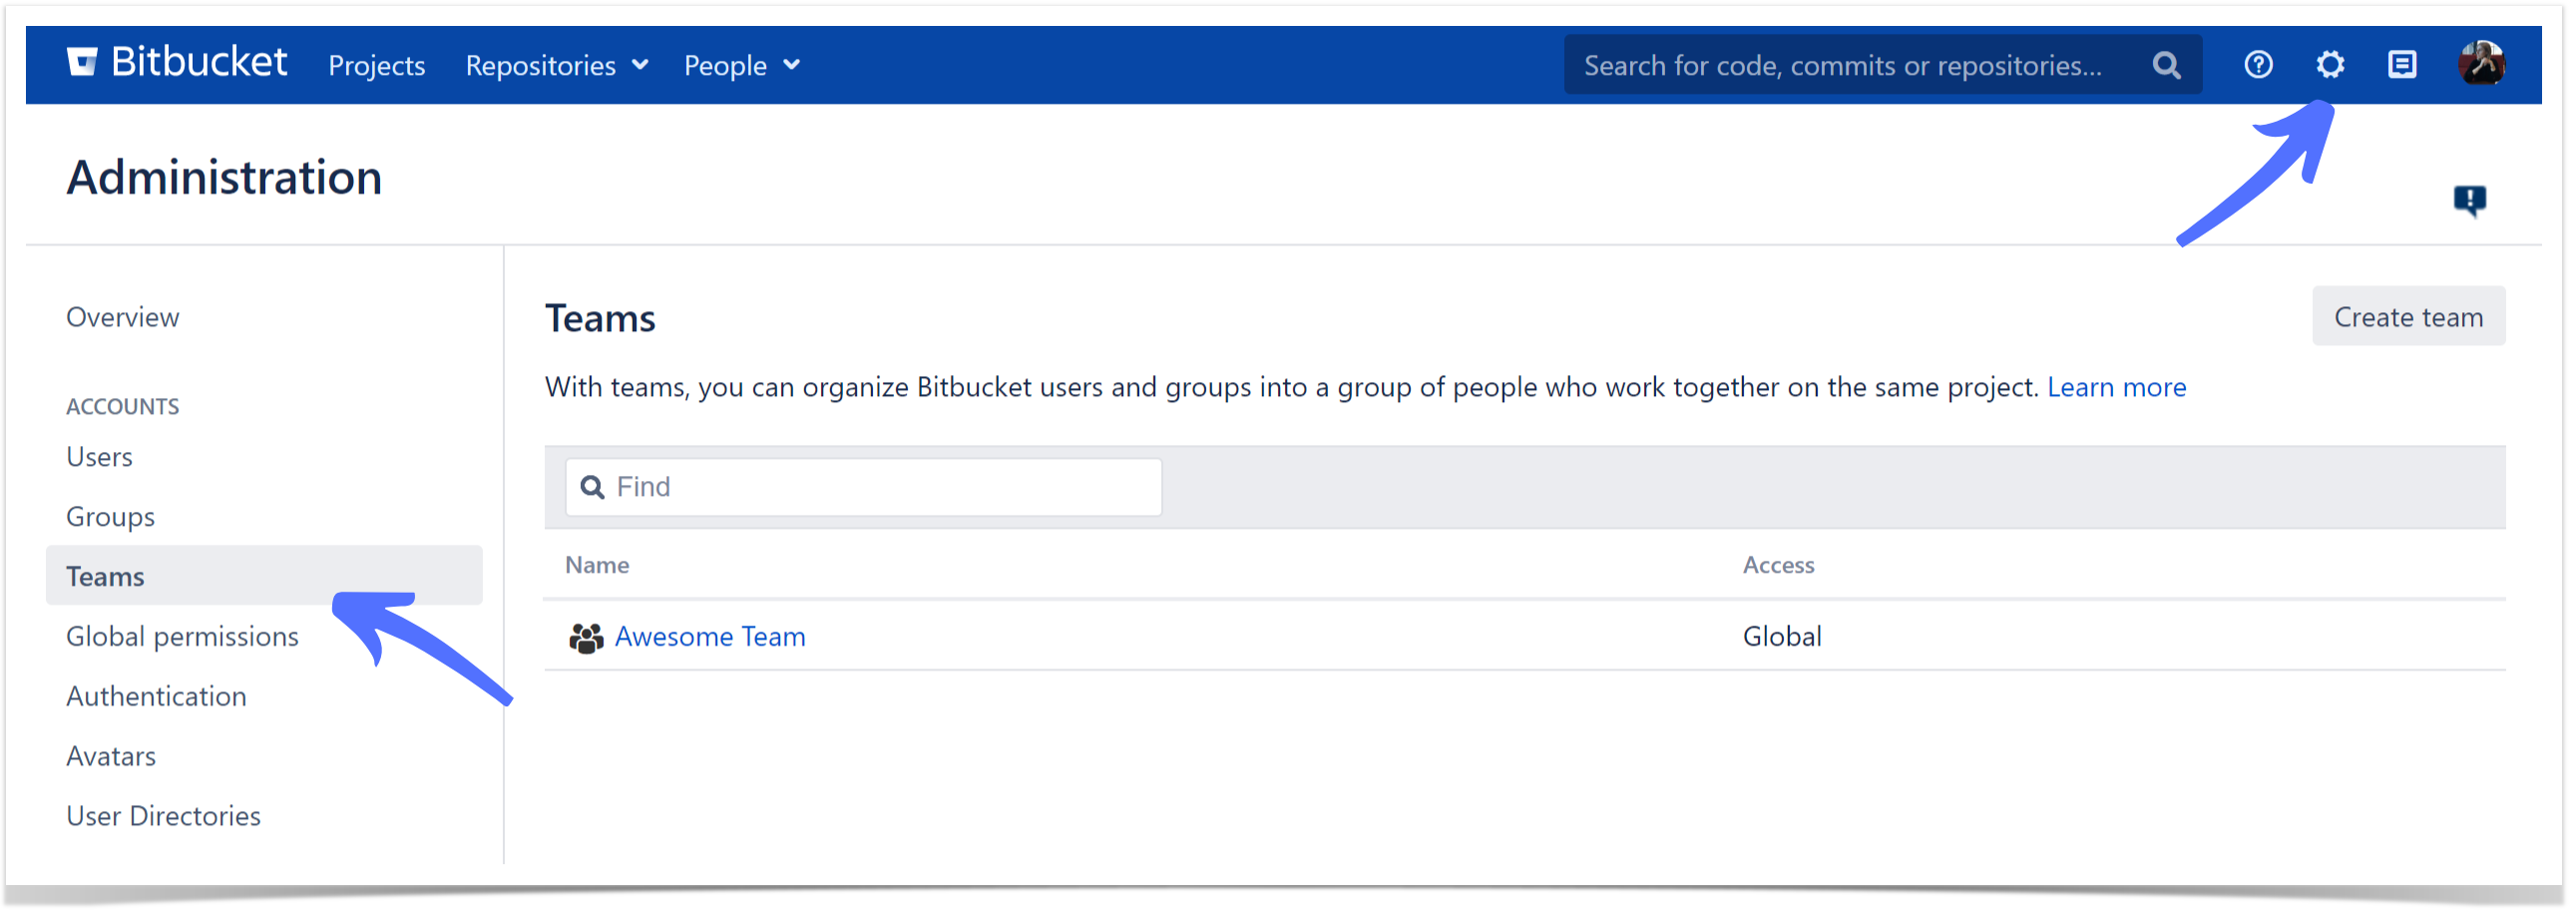
It’s possible to create a global team in the Teams tab in the Administration page and view graphs for it in all projects and repositories.
There’s no need to disturb your Sys Admins from their work to create a team. If you’re a project or repository admin, you may do it in the Teams tab in the settings. In this case, your teams’ graphs will be available only in your repository or project and higher.
Improve your teams’ activity tracking
At the moment, graphs for teams are available only for the Graphs page, but we’ll add this feature to the People page and Reports soon in the next releases.
Try a new version of Awesome Graphs for Bitbucket to get even more useful insights on your team productivity and compare the activities of different teams!
We are delighted to implement the team feature that our customers were asking for, and we hope to make their working process a bit easier and better! So, we appreciate any feedback on the app and suggestions that could help you get the most benefit from Awesome Graphs. If you have any, please, feel free to write to us here as we’re looking forward to learning about your needs!


