


Remote Teams Management: How to Turn Data into Code Review Insights

Remote teams management can be quite challenging. Distance makes it more difficult to monitor your distributed team activity. So, you have to either rely on them, hoping it won’t end up as a disaster, or annoy developers with overcontrol.
Fortunately, there’s no need to go blindly as you can go data-driven and use the statistics of developers’ activity to your advantage.
In this article, we focus on pull requests metrics as a way to identify bottlenecks in the code review process and check if it’s healthy or not. You will find the answers to the following questions:
- What metrics to choose as a subject to analyze and how to organize them.
- How to retrieve them using Bitbucket REST API.
- How to interpret metrics to get as many insights as possible.
Pull Requests status dashboard
If you want to keep in touch with the pull requests on your project status, you may find it useful to create a dashboard that visualizes the statuses of pull requests. This helps you see:
- the number of pull requests your team created for the last week/month/sprint
- how many pull requests are already merged and which of them are still open
- if there are any pull requests open long ago and are not merged yet.
You can retrieve this data using this Bitbucket REST API request:
https://your-bitbucket-url/rest/api/1.0/projects/{projectKey}/repos/{repositorySlug}/pull-requests?state=all
Get the following information from the returned results: pull request ID, state, and the date it was created and merged in the Unix time format.
{
    "size": 25,
    "limit": 25,
    "isLastPage": false,
    "values": [
        {
            "id": 13,
            "version": 13,
            "title": "Looking for Sarah Connor",
            "description": "Trying to save the Future",
            "state": "MERGED",
            "open": false,
            "closed": true,
            "createdDate": 1583837364846,
            "updatedDate": 1583843660283,
            "closedDate": 1583843660283,
            "fromRef": {},
            "toRef": {},
            "locked": false,
            "author": {
                "user": {
                    "name": "arnie",
                    "emailAddress": "arnie@stiltsoft.com",
                    "id": 3,
                    "displayName": "Arnie",
                    "active": true,
                    "slug": "arnie",
                    "type": "NORMAL",
                    "links": {},
                "role": "AUTHOR",
                "approved": false,
                "status": "UNAPPROVED"
            },
            "reviewers": [
                {
                    "user": {
                        "name": "sarahconnor",
                        "emailAddress": "sarahconnor@stiltsoft.com",
                        "id": 4,
                        "displayName": "Sarah Connor",
                        "active": true,
                        "slug": "sarahconnor",
                        "type": "NORMAL",
                        "links": {},
                    "lastReviewedCommit": "",
                    "role": "REVIEWER",
                    "approved": true,
                    "status": "APPROVED"
                }
            ],
            "participants": [],
            "properties": {
                "resolvedTaskCount": 3,
                "commentCount": 1,
                "openTaskCount": 0
            },
            "links": {}
                ]
            }
        },
Then create a script that parses these data and turns it into a pull requests status dashboard.
There are some possible difficulties you may face due to the REST API restrictions:
- The number of returned results is limited, so you’ll have to make several requests to retrieve all data.
- It’s only possible to run the query on a repository level, so the more repositories you have, the more requests you’ll need to make.
- The Bitbucket performance may be affected in large instances.
The same can be done using the Pie Chart report in Awesome Graphs for Bitbucket. Grouped by state, it shows the number of pull requests created during the chosen time span with their current statuses.
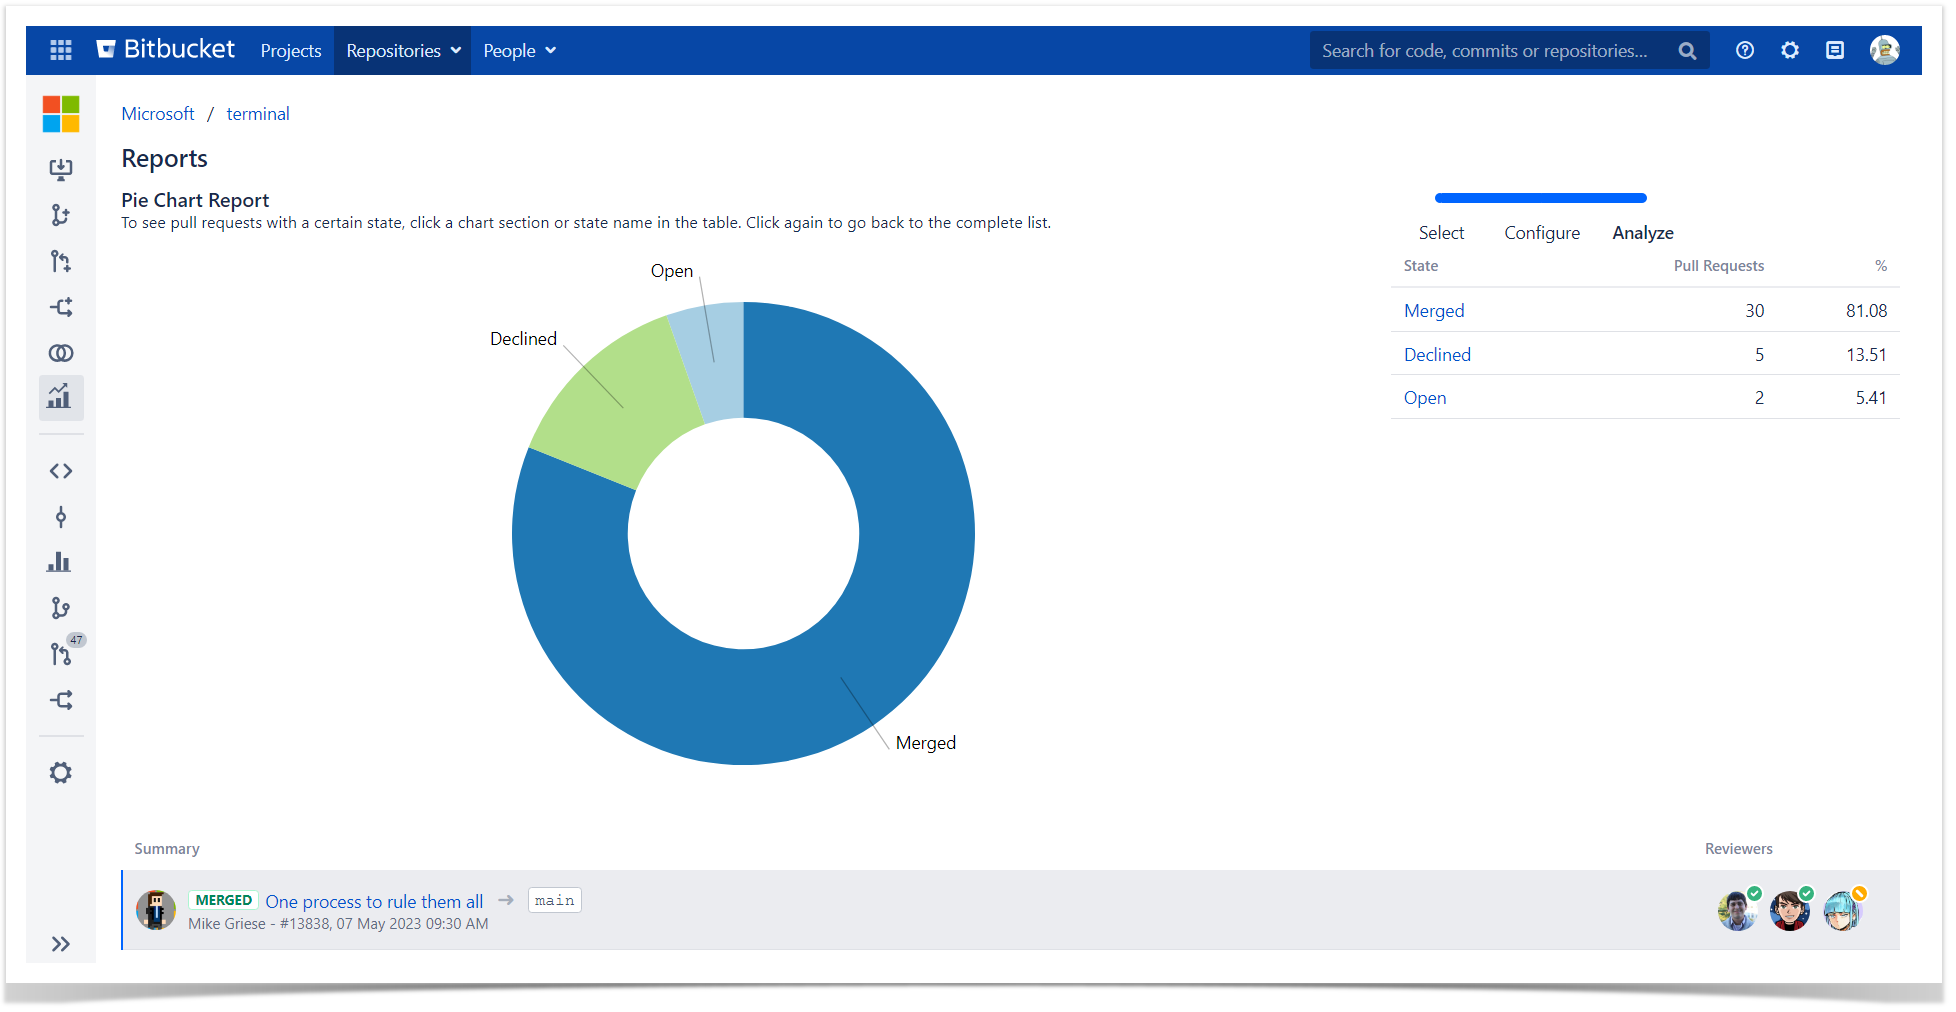
Tip: find pull requests created long ago and not merged yet by selecting a previous week or month as a period to analyze.
Reviewers’ involvement
Another pattern to watch is whether all team members participate in the code review. If not, there are some possible consequences:
- knowledge sharing in a team is poor, and junior developers miss the opportunity to grow their skills without watching the examples of more experienced programmers’ work
- pull requests resolution may be slow if there are more pull requests created than people who can review it
- those who review all pull requests may have no time to write new code.
The same REST API request from the previous paragraph retrieves the data about the participants of pull requests. Organize these data as a list of reviewers and the number of pull requests they reviewed to get insights about the developers’ involvement in the peer review.
The Pie Chart report grouped by reviewer serves the same purposes and gives you a breakdown of pull requests reviewed by all members of your team.
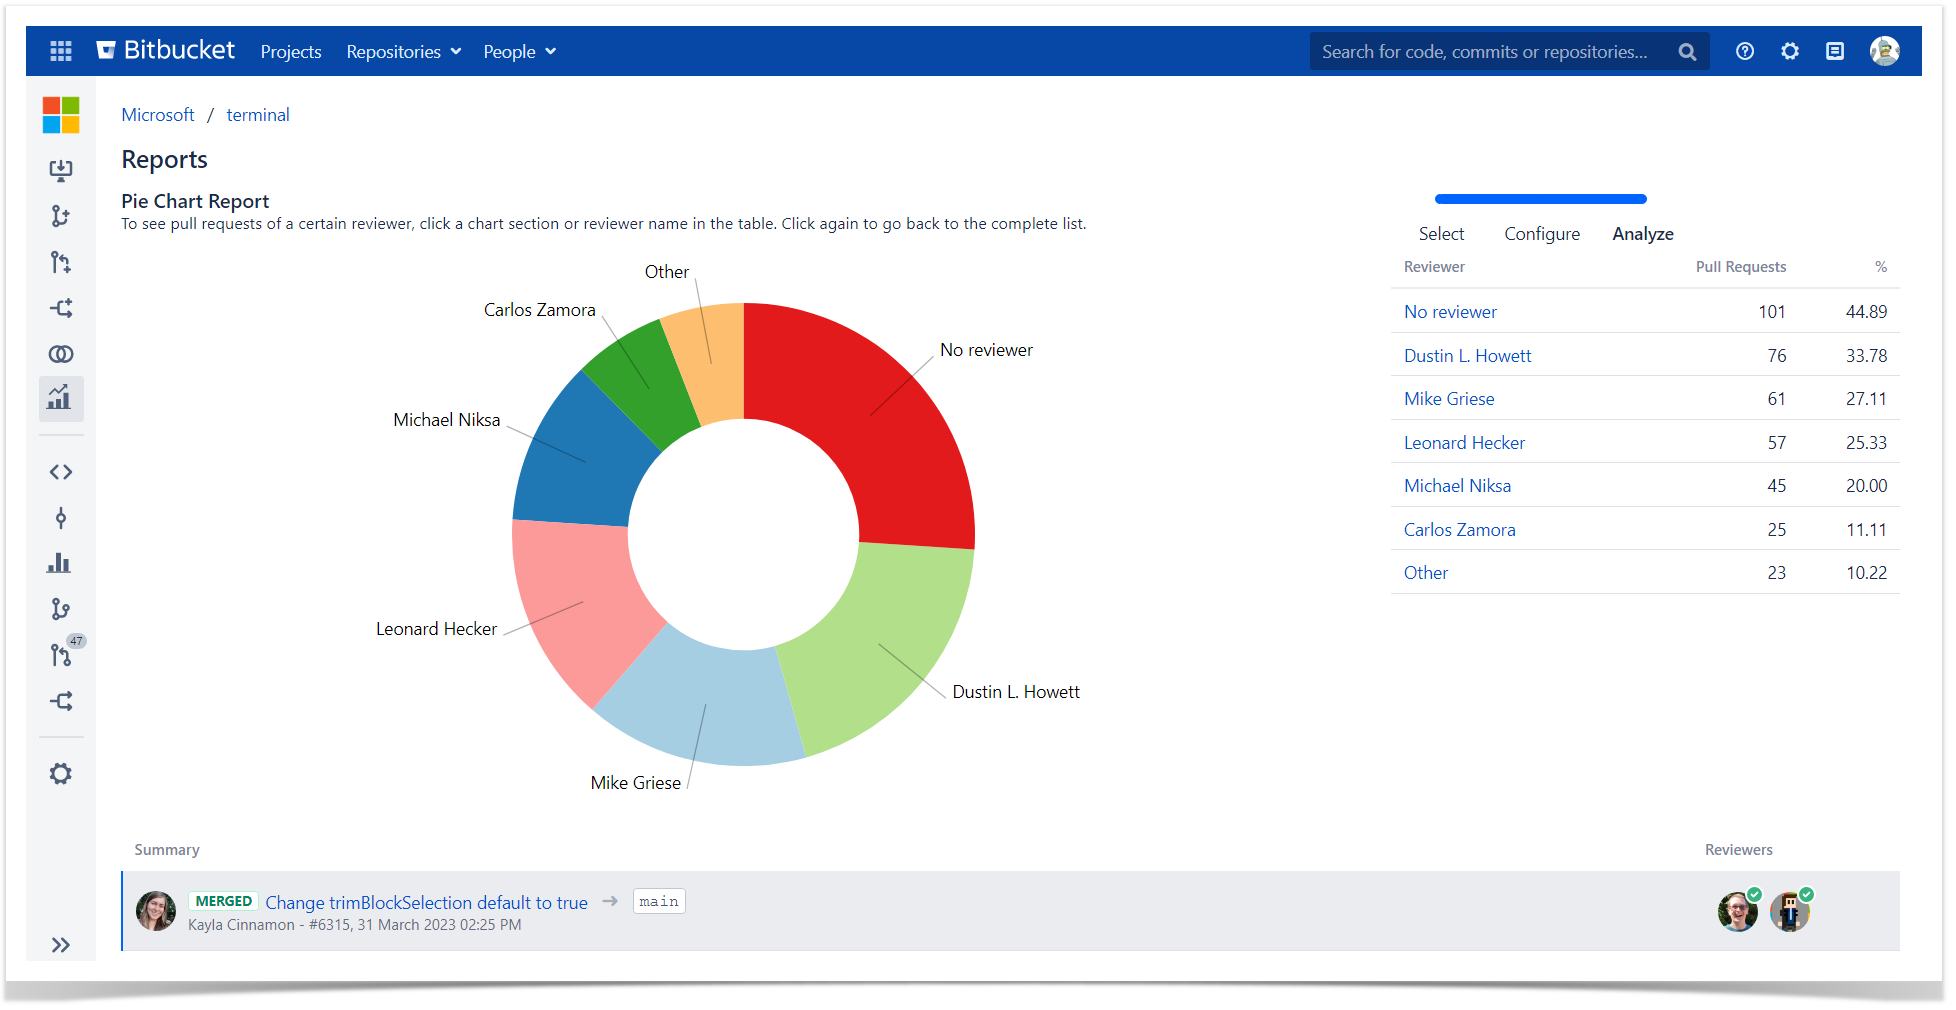
Tip: pay attention to pull requests that are merged without reviewing. Those are the areas where you may have a risk as the code was not checked as appropriate.
Reviewers’ activity chart
The difference between just being assigned as a reviewer and truly reviewing the new code and suggesting improvements to it is huge. Luckily, there are a couple of metrics to watch that may help you get a clear view of the thoroughness with which developers check each other’s work.
Use this REST API request and retrieve the data about the number of tasks, comments, needs work, or approved actions per pull request and group it by user:
https://your-bitbucket-url/rest/api/1.0/projects/{projectKey}/repos/{repositorySlug}/pull-requests/{pullRequestId}/activities
The example of the returned results with the data that needs to be parsed:
{
    "size": 5,
    "limit": 25,
    "isLastPage": true,
    "values": [
        {
            "id": 46766,
            "createdDate": 1574762295000,
            "user": {
                "name": "sarahconnor",
                "emailAddress": "sarahconnor@stiltsoft.com",
                "id": 3,
                "displayName": "Sarah Connor",
                "active": true,
                "slug": "sarahconnor",
                "type": "NORMAL",
                "links": {}
            },
            "action": "MERGED",
            "commit": {}
        },
        {
            "id": 46756,
            "createdDate": 1574690608000,
            "user": {
                "name": "johnconnor",
                "emailAddress": "johnconnor@stiltsoft.com",
                "id": 652,
                "displayName": "John Connor",
                "active": true,
                "slug": "johnconnor",
                "type": "NORMAL",
                "links": {}
            },
            "action": "APPROVED"
        },
        {
            "id": 46688,
            "createdDate": 1574431693000,
            "user": {
                "name": "arnie",
                "emailAddress": "arnie@stiltsoft.com",
                "id": 4,
                "displayName": "Arnie",
                "active": true,
                "slug": "arnie",
                "type": "NORMAL",
                "links": {}
            },
            "action": "COMMENTED",
            "commentAction": "ADDED",
            "comment": {
                "properties": {},
                "id": 6569,
                "version": 0,
                "text": "i need your jacket, boots, and motorcycle",
                "author": {}
                },
        {
            "id": 46668,
            "createdDate": 1574418254000,
            "user": {
                "name": "sarahconnor",
                "emailAddress": "sarahconnor@stiltsoft.com",
                "id": 3,
                "displayName": "Sarah Connor",
                "active": true,
                "slug": "sarahconnor",
                "type": "NORMAL",
                "links": {}
            },
            "action": "OPENED"
        }
    ],
    "start": 0
}
The visualization of the developers’ activity in pull requests provides you with the following insights:
- Most active reviewers in your team. These people check the code thoroughly. On the other hand, this pattern may have negative sides if the perfectionism slows down the feature delivery too much.
- Infrequent participants in the code review. These developers are not involved in the knowledge sharing process for some reason. Do they skip this part of work intentionally, or are they afraid to criticize their colleagues’ work?
- Periods with unusual activity. Check the values that go beyond the trend to find the answer to why the reviewer had to leave too many or too little comments. For example, there can be bad code or the pull request was too large, and nobody wanted to check it. These are the patterns that you’d definitely like to avoid.
The Contributions report provides the same view across projects and repositories with the swift access to each pull request in Bitbucket so you could check its content.
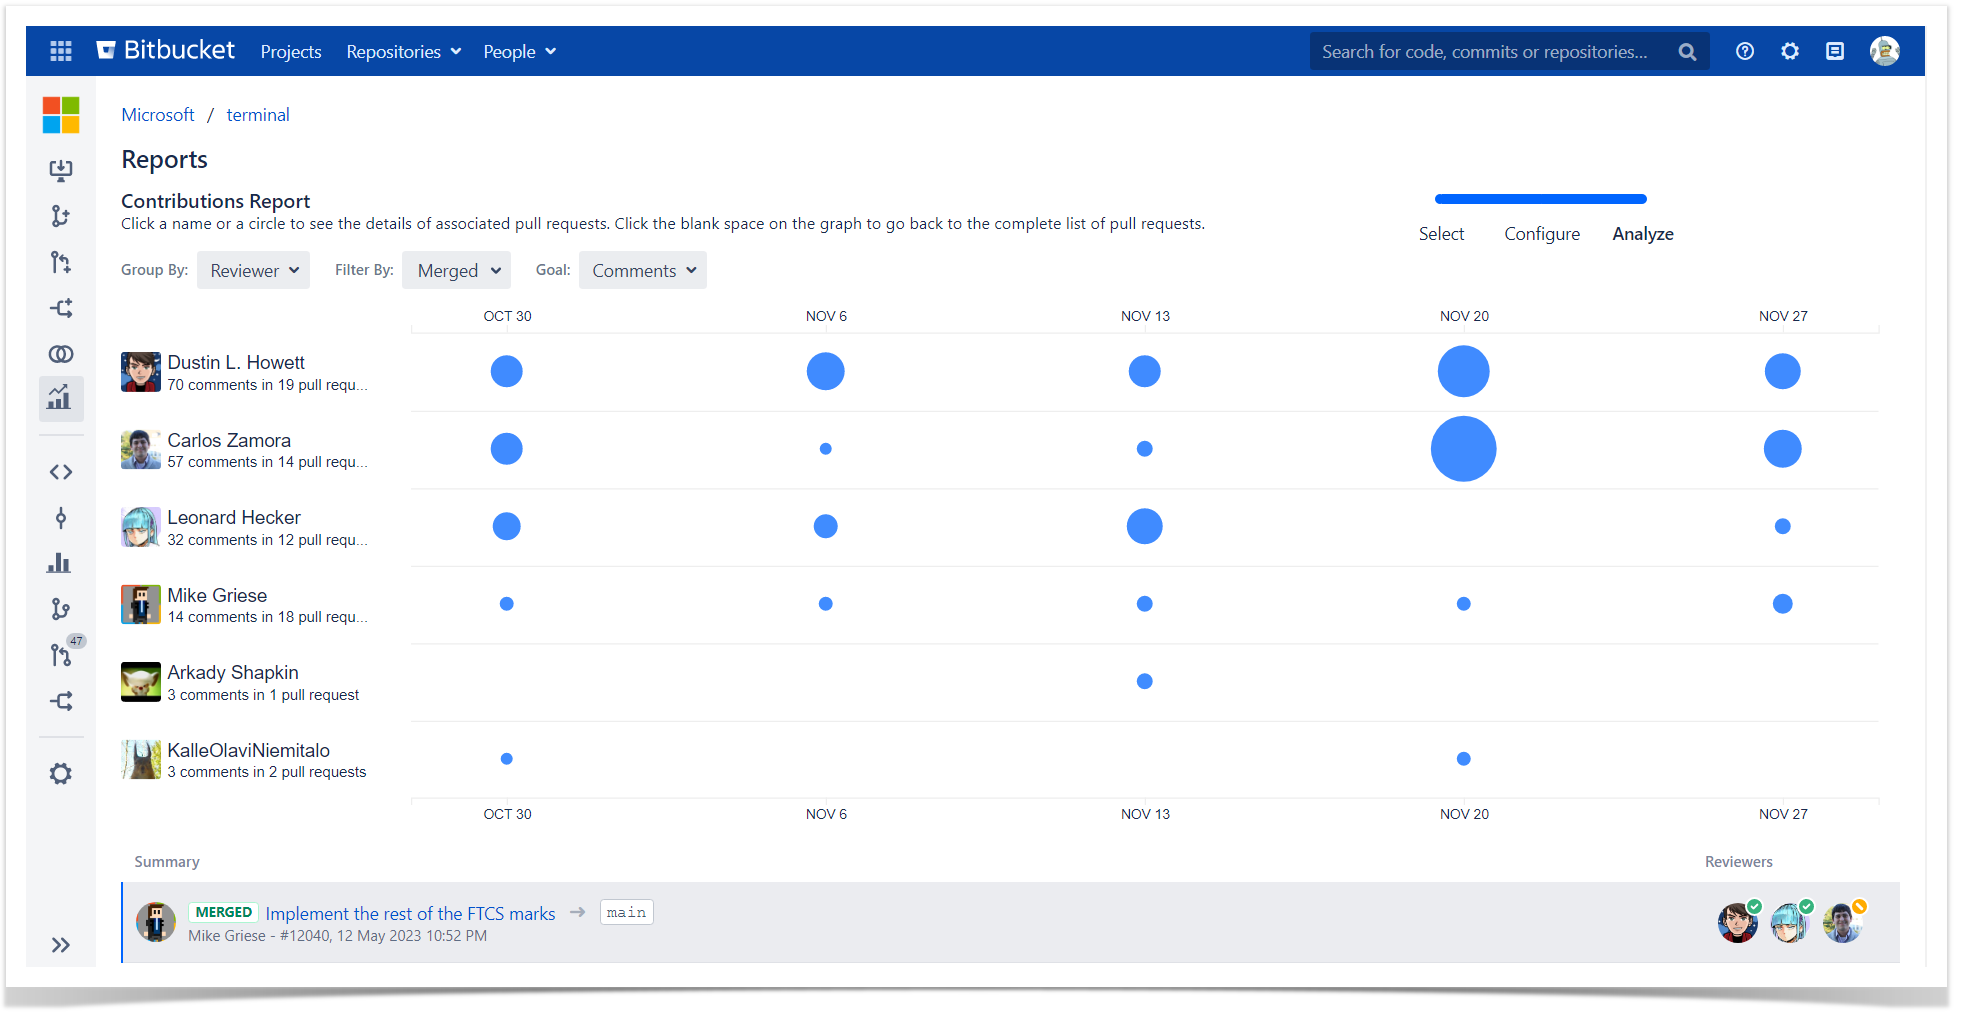
Tip: group this report by author to see who receives the largest number of tasks and comments in their pull requests. This may be a sign of a code that took lots of re-writing and may lead to bugs in the future. Besides, looking at the dynamics of these numbers makes it obvious if developers are improving their working patterns or not.
Try the data-driven approach to bring transparency into your code review processes
Tracking developers’ activity may be especially important in remote or distributed teams where it’s impossible to reach each other physically.
However, the benefits that software development metrics bring are valuable for any company as they help:
- find areas to improve in code review processes
- optimize peer review practices
- avoid slowdowns and poor quality code.
Create your dashboard using the Bitbucket REST API or try Awesome Graphs for Bitbucket for free to discover how you can benefit from it!


