Case Study: How a FinTech Company Improves Code Review Process

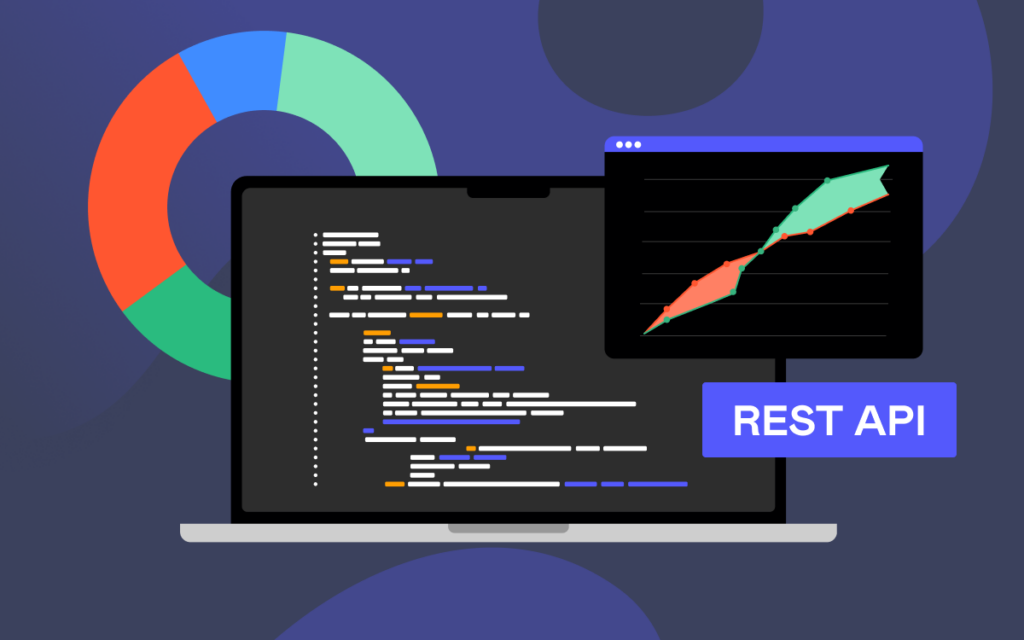
We’ve got pretty good with our Pull Request and Code Review process, but initially, our PRs were complex, not very well documented, and difficult to read. The Resolution Time Distribution graph shows how better we are getting at this, being able to merge PRs much quicker than before.
Pablo Reyes, VP Engineering at Strands
Strands is one of our customers that has been using Awesome Graphs for Bitbucket for a couple of years so far. Since 2004, Strands has been developing highly customizable digital money management software for top-tier financial institutions worldwide. Our team is happy to help them reach their goals and improve their development processes with the statistics visualizations we provide.
Pablo Reyes, VP of Engineering at Strands, shared best practices on how their team effectively uses our solution to:
- identify bottlenecks in code review
- track the process improvement with the implemented changes
- increase developers’ motivation by keeping an eye on their performance trends.
Code review process improvement
In fact, they’ve got pretty good with their Code Review process so far. But initially, the PRs were complex, poorly documented, and difficult to read. The Resolution Time Distribution report shows how better they are getting at this, merging PRs much quicker than before. 
Since they do a lot of code reviews at Strands, it’s always nice to see who and what teams are making the best use of it. It’s motivating for the team to see the progress, and the Pull Requests reports give them the perfect overview of these advancements.
A couple of years ago, they started improving their code review process. For example, they introduced the practice of approving PRs by at least three people. Moreover, they encouraged developers to leave many comments and suggestions and only approve a PR once it’s good enough.
As a result, PRs are resolved faster, not only because they are done better but also because the quality of suggested improvements rises constantly. The Contributions report gives an overview of code review activity and whether it improves or not.

Software development tracking
At Strands, managers don’t use Awesome Graphs to control the number of commits per developer. Still, they find it useful to look at the dynamics of the overall activity to capture the code development trends. For example, if there’s a significant drop, the developer is probably stuck at difficult tasks or disturbed by various activities, helping other teams or communicating with customers.
Most things are caught soon in the day-to-day communication and work, but mid-term changes in the trend (either a decrease or increase) give them a hint of something they may need to look at. This has been visible when people change projects or teams.
The developer’s Contributions graph gives a clear view of this kind of drops and rises, and it’s handy to compare two periods before and after certain changes were implemented.

Any emerging trend serves as a valuable point for discussion, enabling the team to identify potential bottlenecks or areas that can be enhanced within their software development process. Developers’ performance is complex and depends on lots of different things, some quantitative and some qualitative. Still, the aggregation of code contributions (comments, pull requests, tasks solved, commits, etc) gives some good indicators of how a team evolves with time.
Along with the others, the Contributors graph provides insights into the dynamics of code contributions by different teams and helps with software development tracking.

Try the best teams’ practices for your company
Awesome Graphs for Bitbucket has become a helpful tool for Strands to identify problem areas in their processes and track whether the implemented changes improve them. Besides, it is a handy instrument for regular monitoring of software development.
Try Awesome Graphs for Bitbucket for free and discover how it can benefit your workflow.
Read more case studies to see how our customers benefit from using Awesome Graphs for Bitbucket in their work: