Analyze How Code Review is Going in Bitbucket Data Center

Awesome Graphs is a data-providing and reporting solution that extends Bitbucket, a platform that teams use to host Git repositories and collaborate on code. Our app helps engineering leaders and software teams improve their own processes and deliver products faster by transforming invisible development activities into easy-to-understand insights and reports.
One of the key focuses of the app is the code review process analytics. In this article, we would like to share which features support this use case and how you can benefit from the app. Keep reading if you are interested in:
- Seeing how actively your team members review code.
- Analyzing what developers may need to improve their work patterns and who’s doing a great job.
- Learning what reviewers are most active and diligent.
- Knowing the average time taken to resolve pull requests.
Code review analysis
The Contributions Report analyzes activity in pull requests (tasks, comments, needs work/approved/declined statuses). It helps you understand:
- What developers create high-quality code, and who might need to improve their approach to work. E.g., when an engineer has fewer tasks, comments, and needs work flags in their pull requests, it suggests their work is approved as it is or with minor changes, and they create code of high quality.
- What reviewers are thorough when they review the work of developers. E.g., diligent reviewers come up with suggestions and improvements, so they have more tasks and comments than others.
- How the dynamics of code reviews changes over time. E.g., you can see if the number of pull requests with Needs work flags is getting bigger or smaller, if the number of tasks in pull requests is increasing or decreasing over time.
The average time taken to resolve pull requests
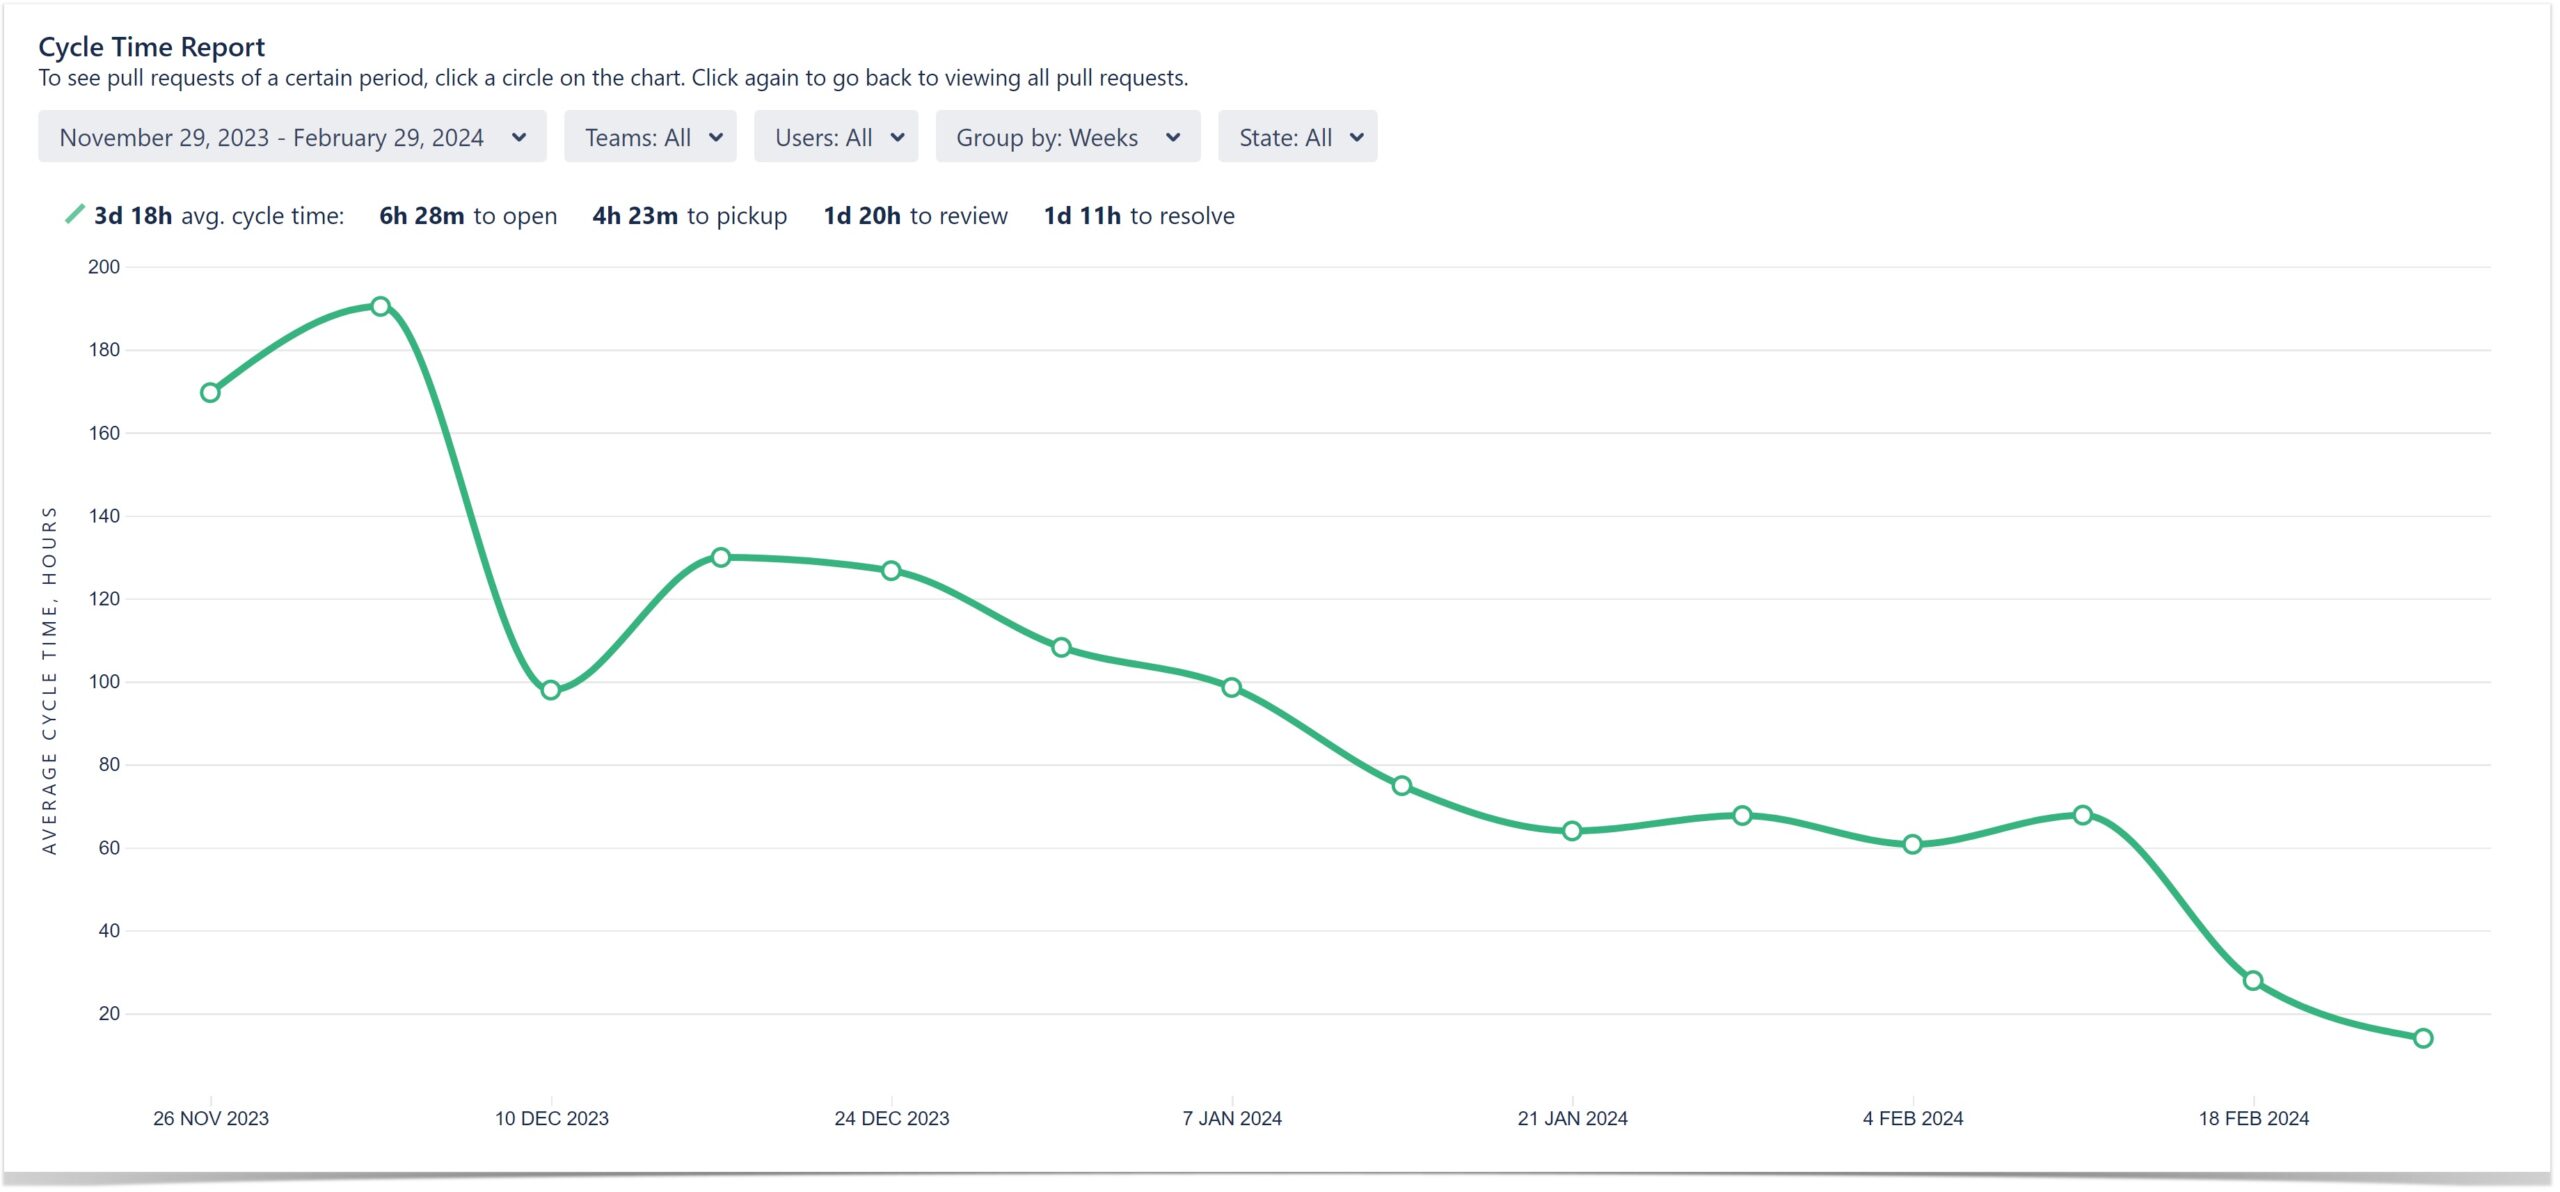
Cycle Time Report shows the average time taken to resolve pull requests. This is helpful to capture trends in cycle time. With this report, you can:
- Notice spikes in cycle time and then dive in to see what went wrong.
- See how average cycle time progresses over a period of time – an upward trend can be a signal to look into your code review process and determine what causes delays.
- Monitor how changes in your processes affect cycle time.
Knowledge sharing indicators
The Pie Chart Report is a handy way to check if all developers in your team are involved in the code review. This report shows the breakdown of pull requests by different statistics types.
Grouped by reviewer, the Pie Chart Report shows the following:
- How many pull requests each person reviewed. These metrics help understand how much everyone contributes to the project.
- Whether all people review code or there are one or two who are doing all job. This is an indicator of poor knowledge sharing.
- Who is too busy reviewing all pull requests of their team. These people can become a bottleneck that slows the delivery time, because they’re not available for immediate review.
Exporting pull requests for future processing
With Awesome Graphs, the historical data can be exported to a CSV file right on the People page.
As a result of the exporting, you receive the CSV file with the list of pull requests (alternatively, the list of commits) with their details about the author, reviewers, state, the date they were created and last updated. The files can be processed in Excel or integrated with analytics tools like Tableau, Power BI, etc. to create custom graphs and dashboards and merge with the data from other apps.
If you would like to try Awesome Graphs in your Bitbucket instance, make sure to activate your free trial.
Further reading:
–How to Analyze Project Contributions in Bitbucket Cloud
–How to Get Bitbucket Statistics for Commits and Pull Requests


