Bitbucket Analytics: Why, What and How to Use

It’s no secret that the business world has adapted to making decisions based on data. We analyze conversion and churn rates, track the number of active users and average revenue. We know how much we spend on advertising and how it correlates with web traffic growth.
But what about software development? In contrast to sales and marketing, the world of software engineering is less familiar with the same approaches, and all project development data remains hidden within repository management tools like Github, Gitlab, Bitbucket. It is widespread for software development decisions to be based on theory, instincts, experiments, or gut feelings. Sometimes they are backed up by a few numbers on commits or pull requests, but it is always tedious and time-consuming. Besides, it sometimes causes data errors due to manual work.
A combination of all of these factors can negatively impact the development of any product, leading to:
- Hidden inefficiencies and costs as invisible bottlenecks hamper team performance and productivity
- Inability to determine if everyone is on the right track due to lack of transparency and visibility in projects and teams
- Investing time in manual work instead of new ideas, core tasks, or favorite activities
- Slow development velocity, missed deadlines, and disappointed stakeholders
And it is up to everyone to decide how long this list should continue.
To simplify work and make processes of software development more transparent many organizations rely on a data-driven approach and comprehensive analytics of commits and pull requests.
64% of companies mark that improved efficiency and productivity as the top benefit of data analytics, while 56% say about faster, more effective decision-making
Source: Finance Online
What is a data-driven approach in software engineering?
Data-driven development means using and analyzing commits and pull request data as a primary source of information for decision-making. In this approach, engineering processes are viewed from a transparent, accurate, and unbiased perspective by defining and using metrics such as KPIs or OKRs. It lets everyone know where the business is moving and how personal work contributes to its success.
However, despite focusing on raw numbers and statistics, data-driven development also relies on people. It is not enough to count lines of code, the number of commits and pull requests, or to determine how long it takes to resolve pull requests. To be successful, metrics-based approaches need individuals and teams to understand the data, analyze it, and use it for continuous learning and improvement.
What are the pros of using data in software development management?
Processes transparency and optimization
Collecting and analyzing commits and pull request data on an ongoing basis gives engineering managers a clear view of what is going on in projects and within their teams. It helps to explore similar patterns and find ways to improve them.
Predictability of development and time-to-market
Graphs and reports empower teams to find hidden inefficiencies, resolve everyday challenges, and speed up the development process without affecting code quality. It helps reduce time-to-market and deliver on promises.
Informed decision-making based on well-rounded insights
Analyzing real-time data with past patterns and getting deeper insights across project development can confirm a new strategy’s success or force you to revisit your choices.
Keeping everyone on the same page
Providing greater visibility into in-progress work and enabling developers to see the impact of their efforts on overall project success ensures the commitment of team members as well as keeps them motivated and moving in the right direction.
How to implement a data-driven approach in Bitbucket?
Bitbucket is a real storehouse of information on everything happening inside engineering processes. Unlocking it is all that is required to identify bottlenecks, understand why things go wrong, and find solutions. Unfortunately, Bitbucket does not provide any functionality that allows getting a quick overview of what is happening on projects and within teams.
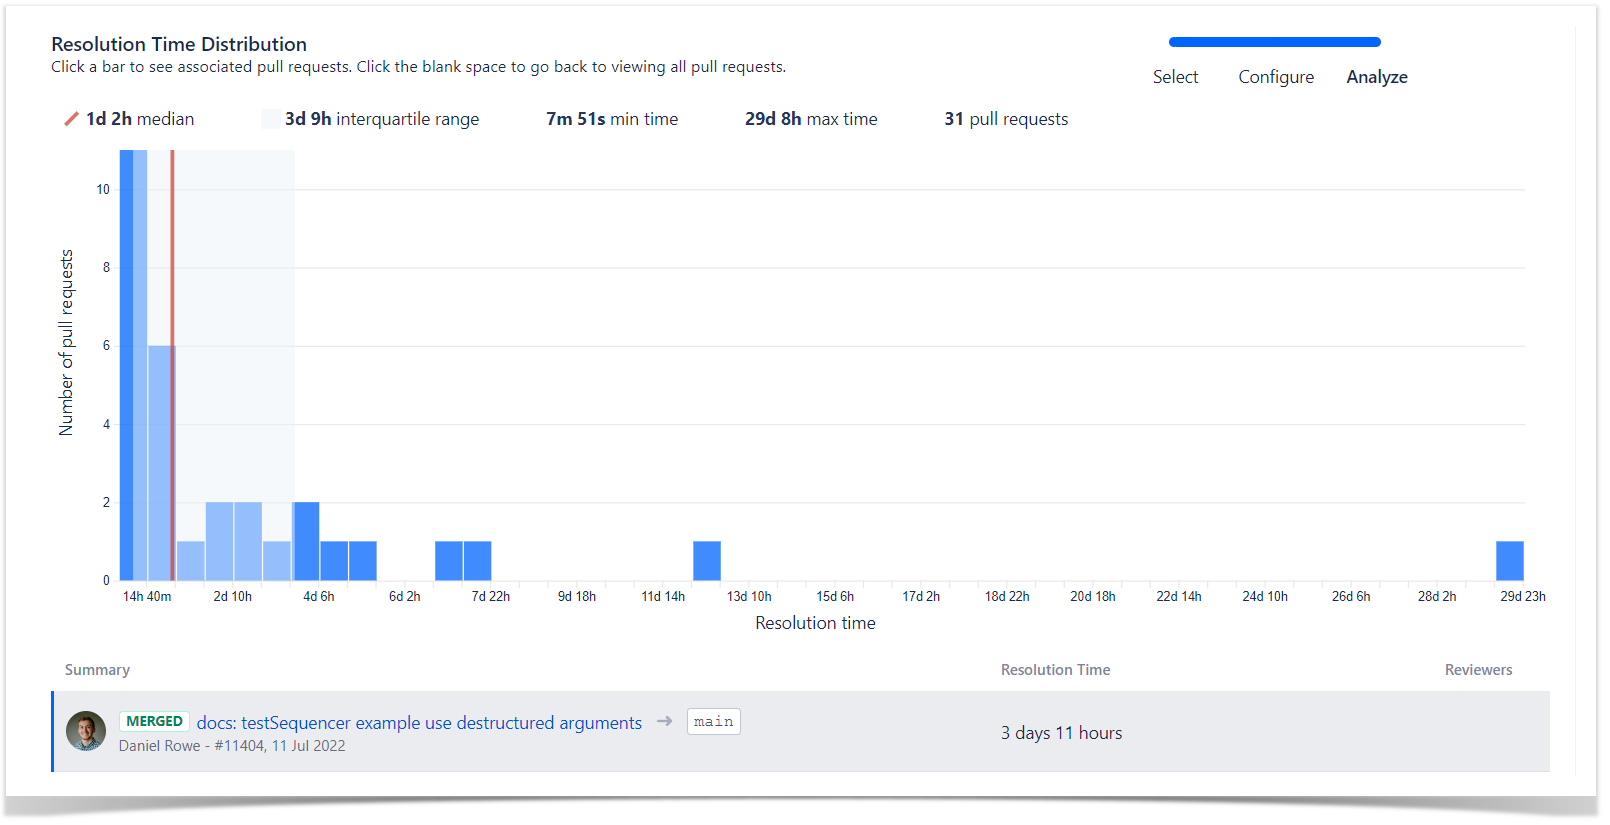
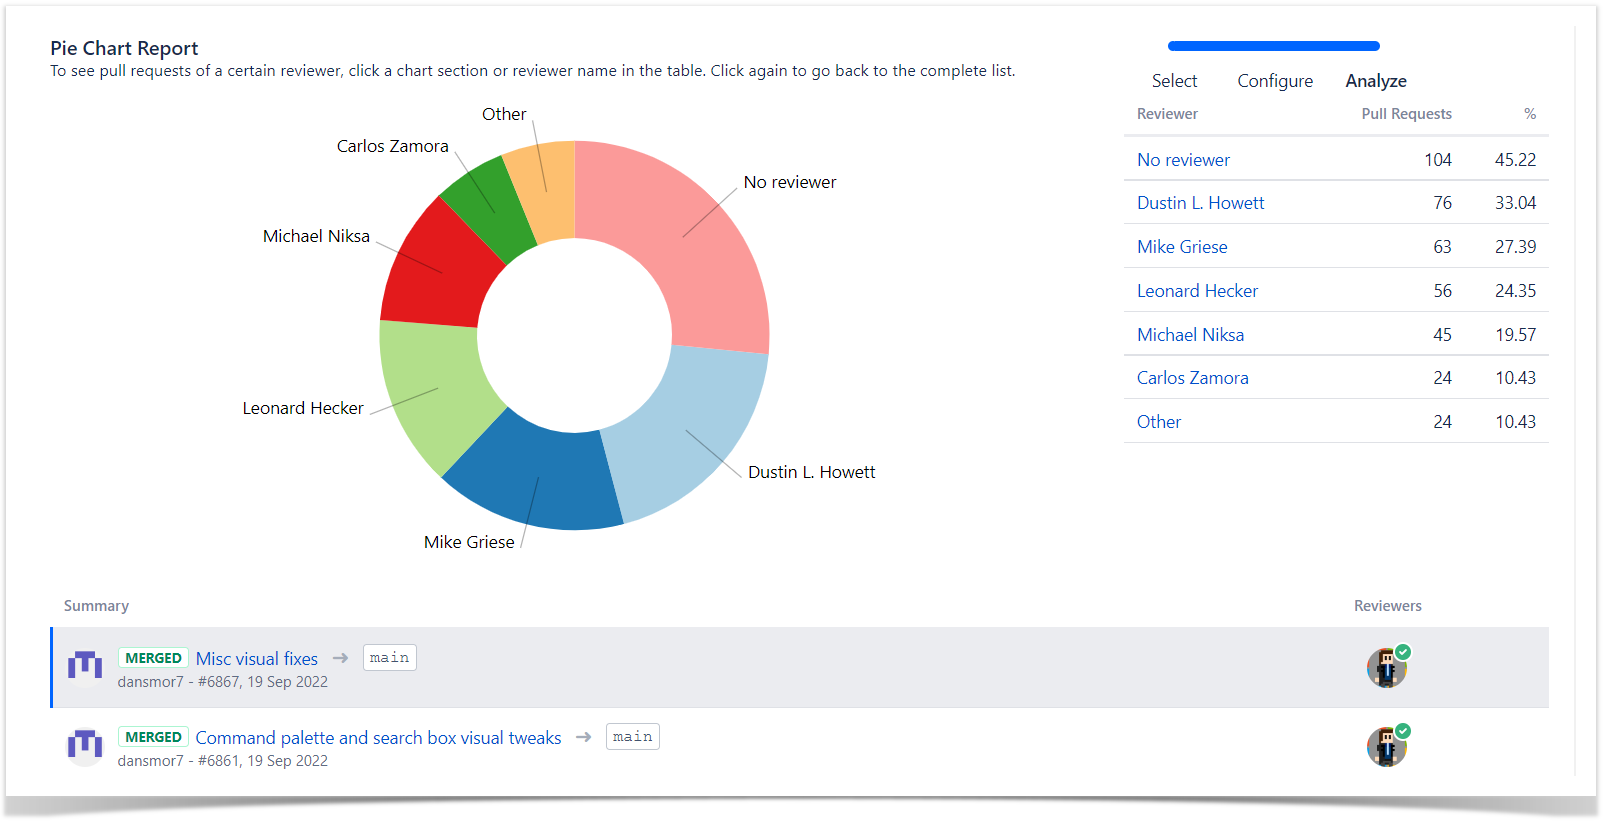
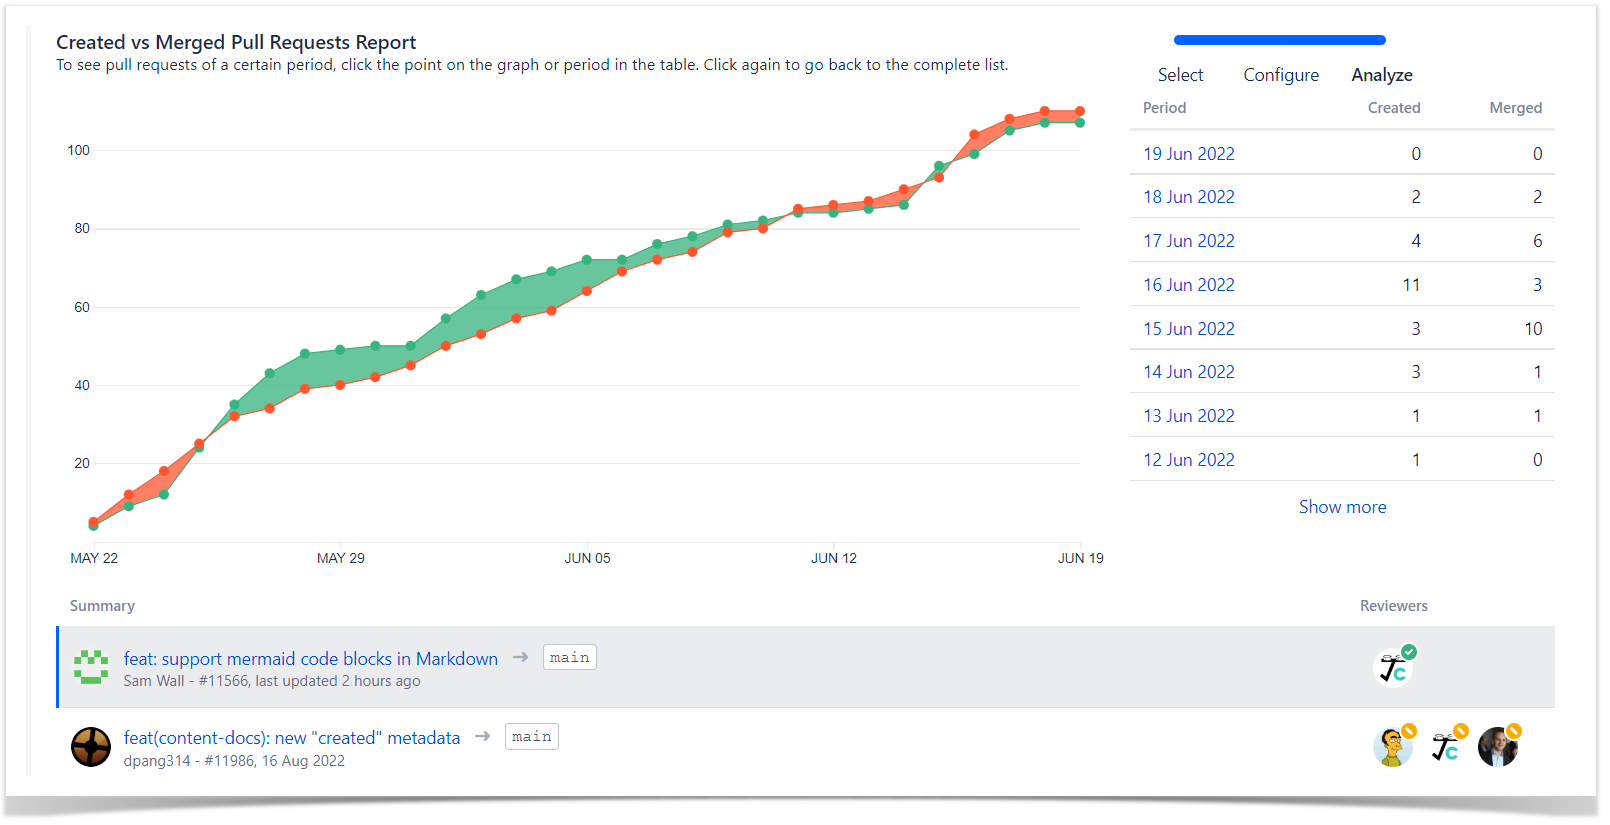
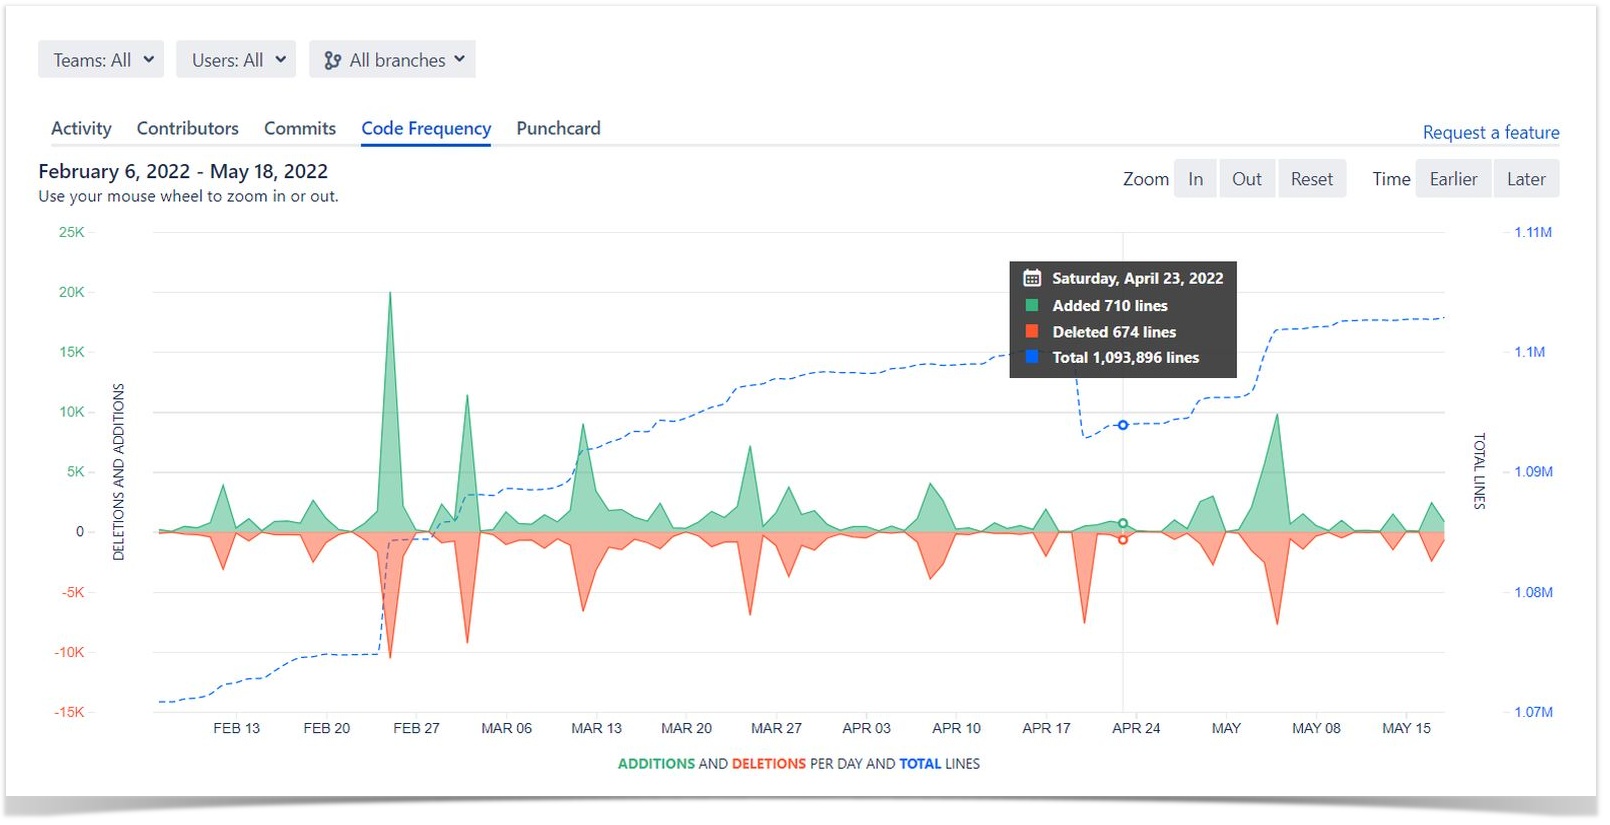
Here come data-driven apps like Awesome Graphs for Bitbucket that automatically pull data from Git repositories and empower data-driven software management.
Awesome Graphs for Bitbucket helps engineering managers to monitor and measure the activity of the projects and developers from the whole Bitbucket by transforming invisible development activities into easy-to-understand insights and reports. Apart from this, the app:
- seamlessly integrates into Bitbucket and displays data on the client’s side. No need to expose your source code outside Bitbucket or worry about security issues
- gives a lot of out-of-the-box reports without requiring complex configuration and additional analytics knowledge
- exports data to a CSV file or via REST API to create custom graphs or dashboards and merge them with the data from other apps
When using Awesome Graphs for Bitbucket, project planning becomes more accurate since it provides an overview of the project’s dynamics and helps to identify bottlenecks that hold teams back. Apart from this, it is possible to track how your team’s productivity increases compared to the previous period, view the engineering contribution for each repository and project, or recognize hidden talents.
Start a 30-day free trial to discover analytics’s benefits to your projects and teams.