Case Study: How to Evaluate Code Quality in Bitbucket

This plugin helps us in Code Frequency to evaluate code quality and project history. Contributors evaluate the code committed by each person in a sprint and we use the Activity stream to show all commits and pull requests of the selected time span as the activity stream with links to associated Jira issues, subtasks, and backlogs.
Apptium Technologies, our customer, is a technology and management consulting company that helps global broadband, wireline, and wireless communications service providers boost their productivity. This company has offices in the USA, Canada, and India.
The team of Apptium Technologies actively uses Atlassian Bitbucket for team collaboration. This way they can build and ship software to their clients that use Apptium application as Platform as a service (PAAS). They decided to extend the Bitbucket functionality by installing our Awesome Graphs app.
In fact, our customer has around 25 projects going parallel. Each project has its own dev, QA, production environments with around 15 repositories. All team members use the Awesome Graphs app to track and monitor their projects and repositories with visualized statistics.
Let’s see what features and capabilities of this app the Apptium team uses most.
Activity tracking and reporting
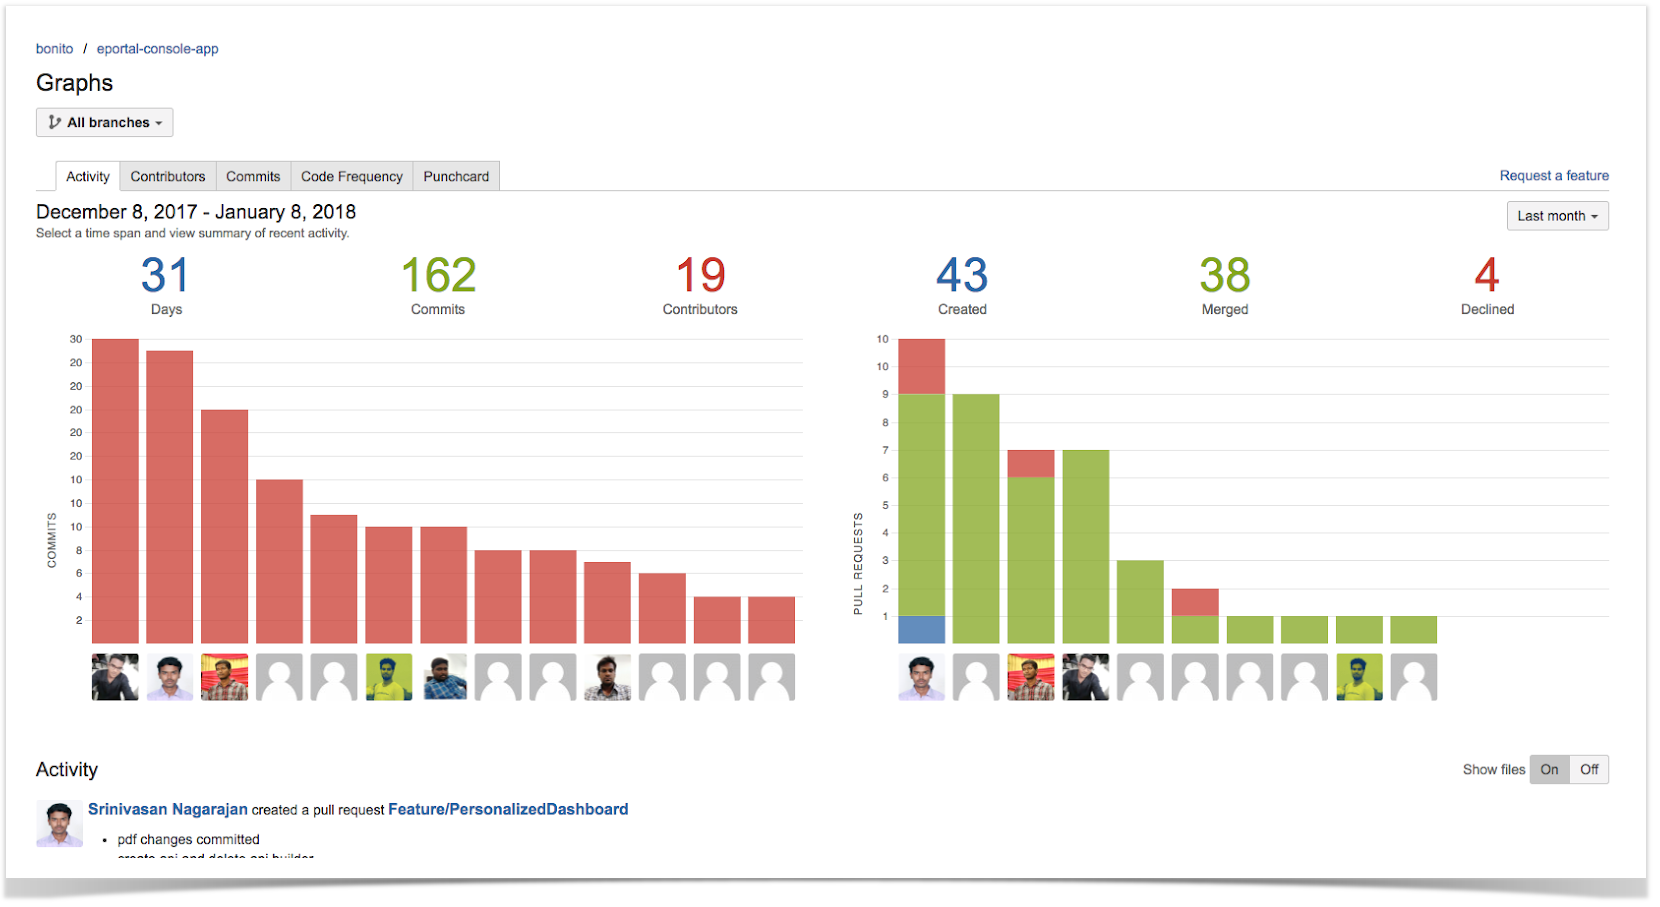
As an Agile software development team, Apptium wants to track down issues and daily updates of the tasks assigned in their sprints. For instance, to achieve this goal, they use the Activity graph. It shows the existing commits and pull requests through the selected time span at the project level, featuring activity in all project repositories.
Moreover, our client can also check the activity stream with the links to the associated Jira issues, sub-tasks, and backlogs. This way, they can easily track daily updates for their current Jira tasks.
Contribution tracking
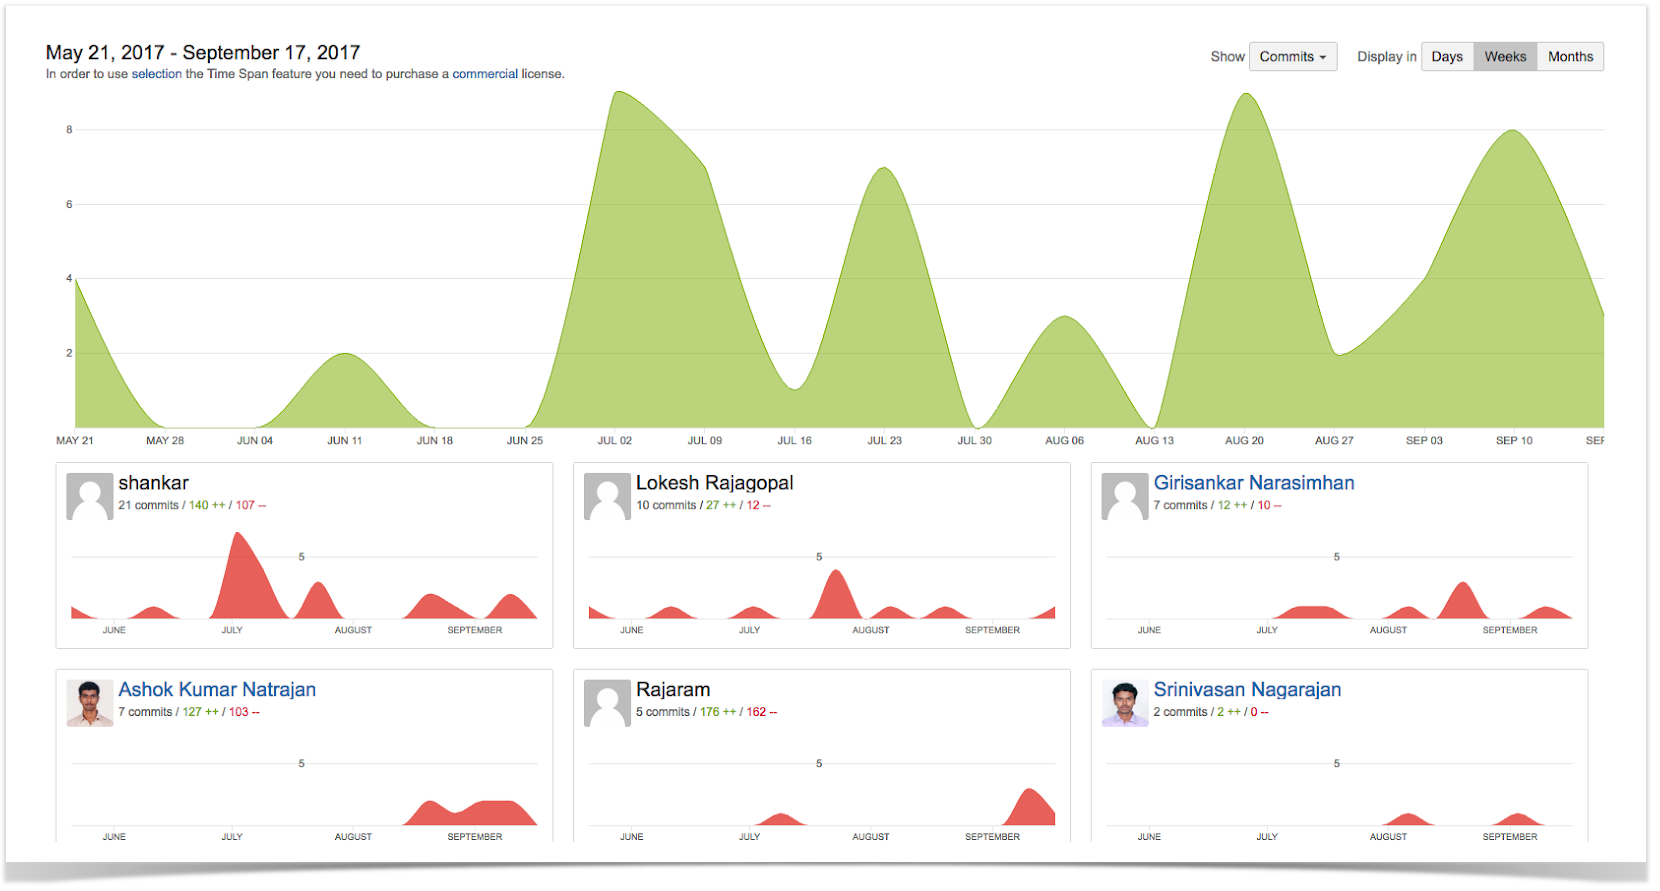
The Contributors graph helps the Apptium team to evaluate the code committed by each person in a sprint. They can compare the input from different team members with a help of a summary graph of the contributions made by all developers. In addition, they evaluate the number of commits and lines of code added and deleted by each developer.
Using this graph, the Apptium team can monitor the team’s performance and analyze the critical points throughout the year.
Code quality analysis
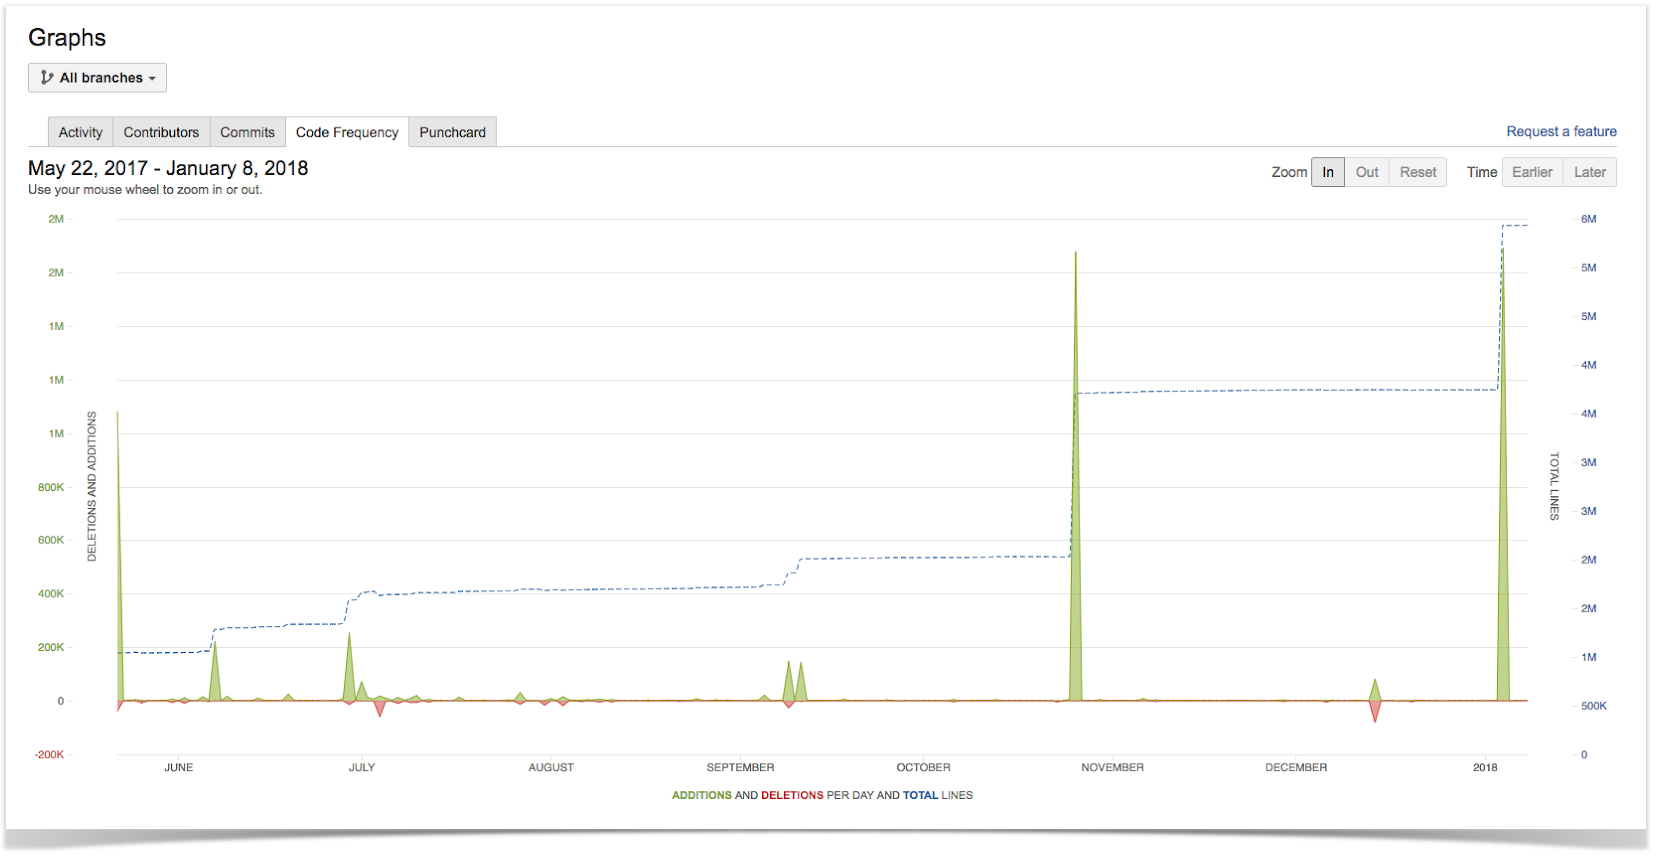
The Code Frequency graph allows Apptium to evaluate the project history and code quality. The team members can watch the dynamics of their projects in terms of lines of code.
As a result, the Apptium team can have a birds-eye view of the whole project from its start to the current week in one graph.
Challenges and benefits
Awesome Graphs for Bitbucket allowed the customer to get the detailed visualized statistics of their team performance and address the following challenges:
- analyze the critical points along the year
- track activity and progress of the team
- watch their projects evolve
- capture trends and identify bottlenecks
Apptium Technologies now can rapidly evaluate the performance of their development, QA, and production teams. The insights they receive using our handy tool definitely help them deliver the best service to their customers all over the world.
Read more case studies to see how our customers benefit from using Awesome Graphs for Bitbucket in their work:


