Cycle Time vs Lead Time: Optimizing Software Development

The terms Cycle Time and Lead Time are used frequently in project management and software development. While they may seem interchangeable, they represent distinct concepts and focus on different aspects. Understanding the differences between Cycle Time and Lead Time is vital for effectively managing projects and optimizing processes. This article highlights the differences between Cycle Time and Lead Time, their importance for engineering teams, and how they can be measured using tools like Awesome Graphs for Bitbucket.
What is Cycle Time?
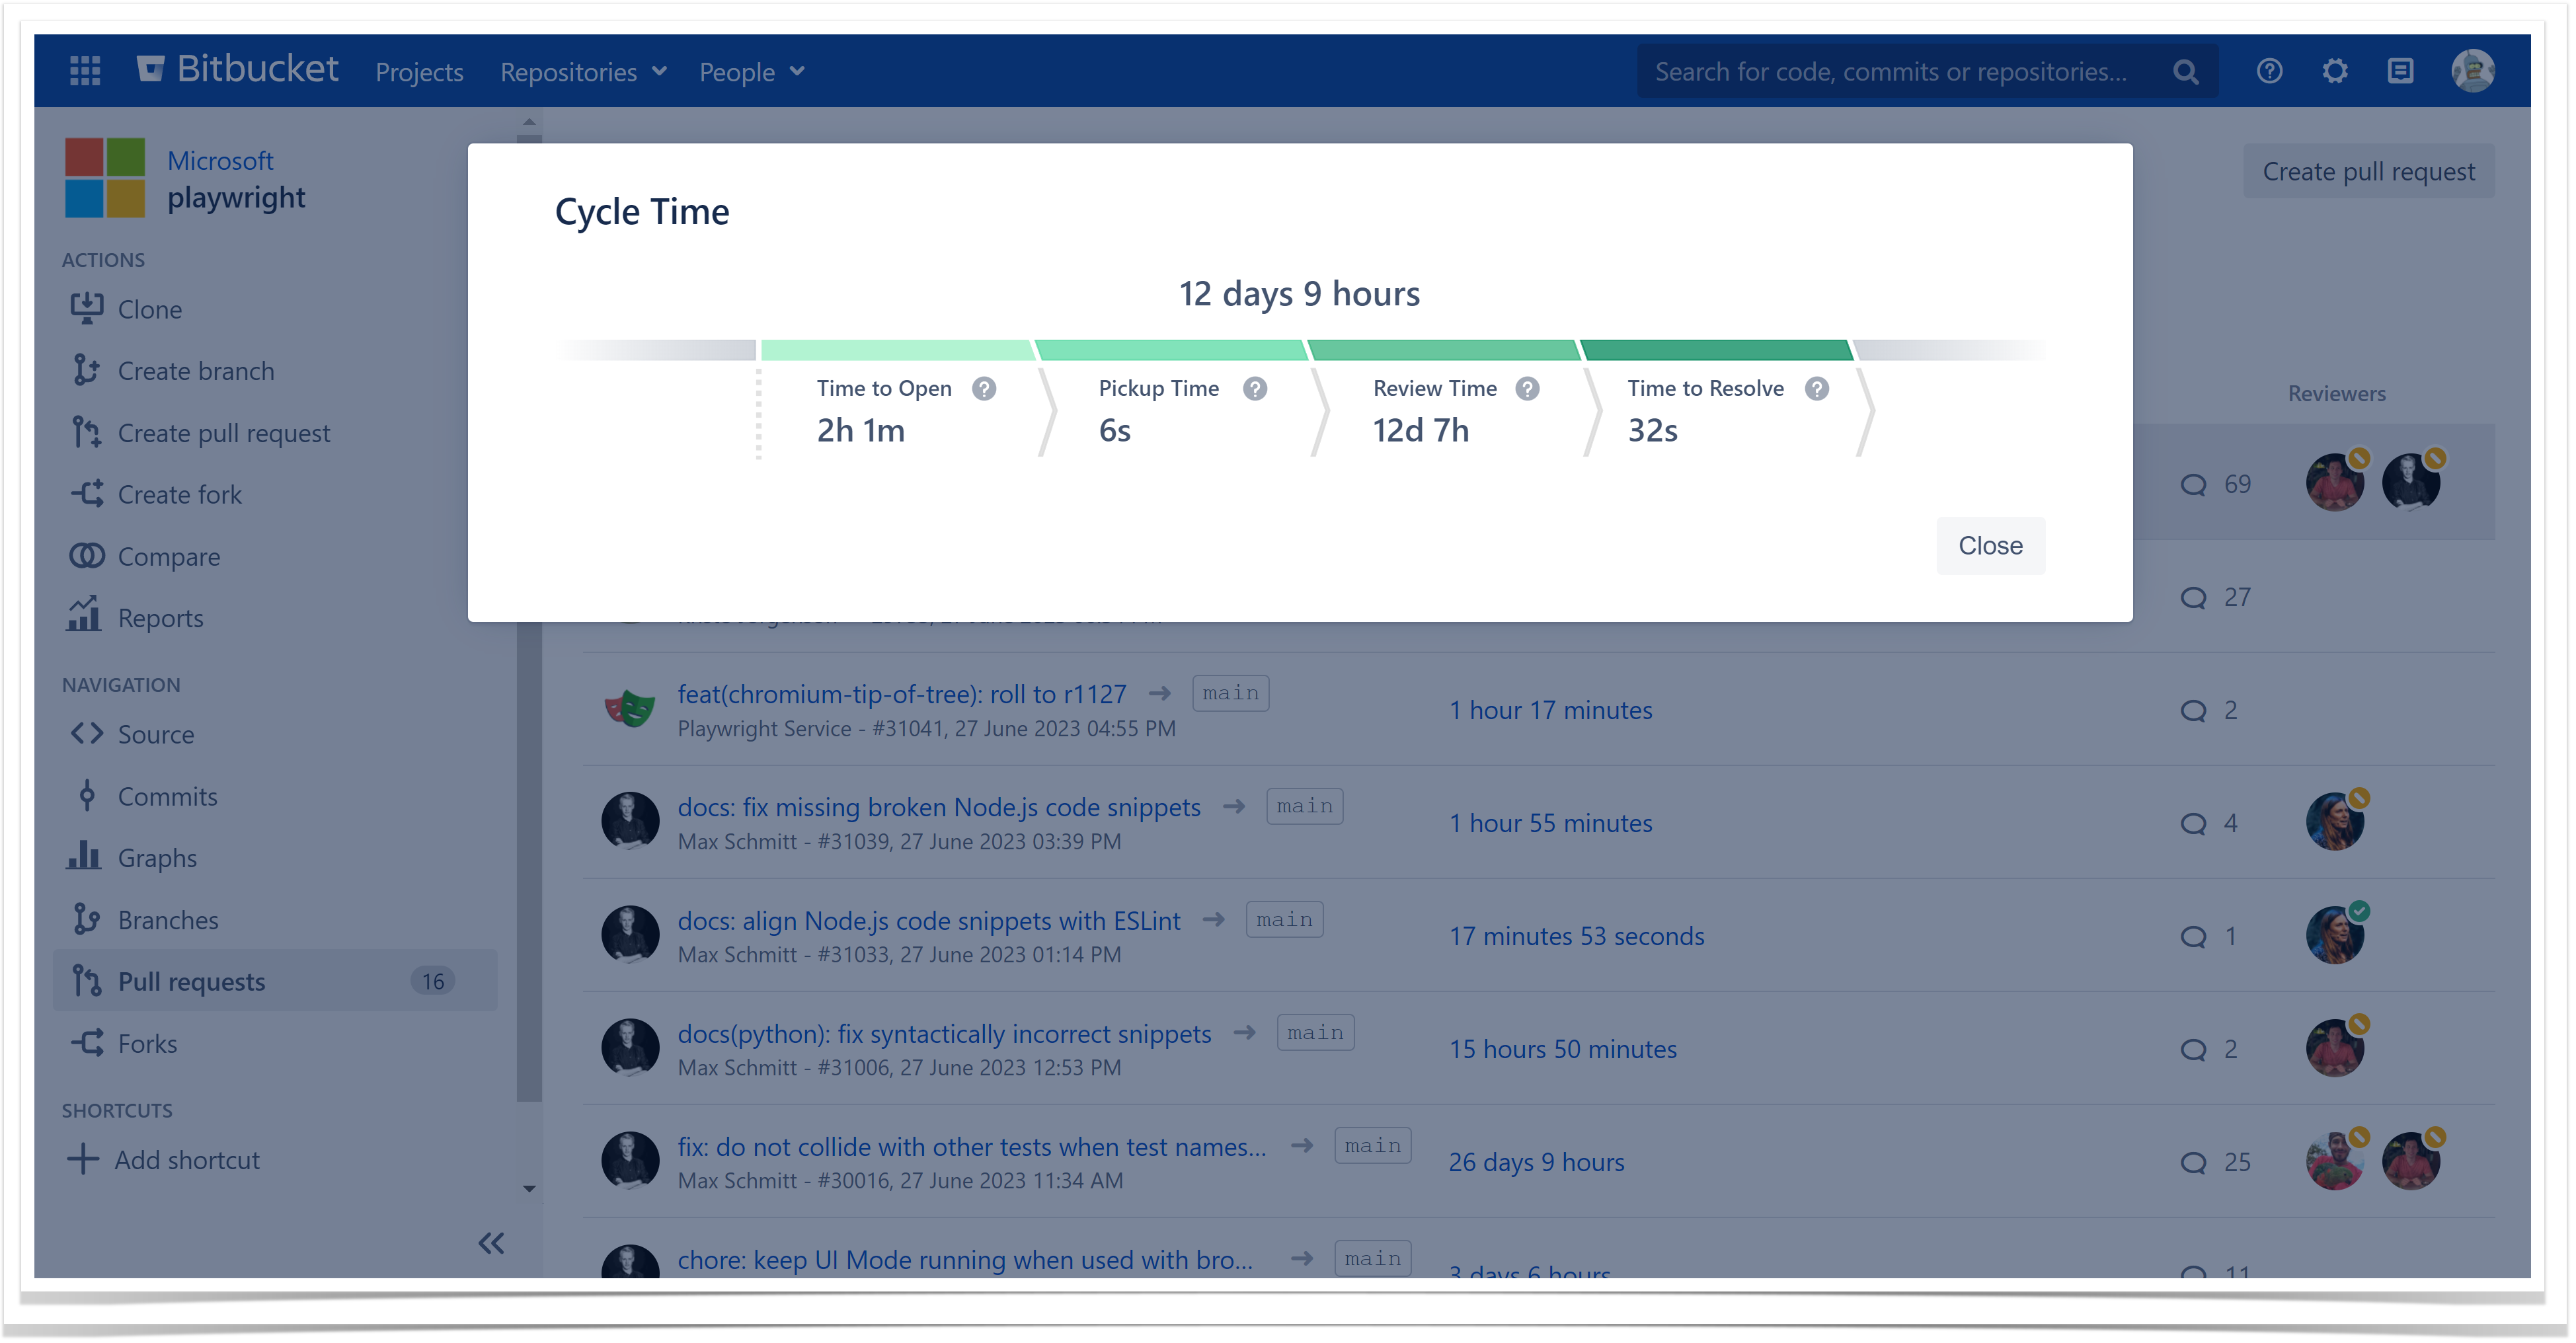
Cycle Time refers to how long a person or team completes a work item from beginning to end. In software development, Cycle Time usually refers to the time from the developer’s first commit in a pull request to its deployment and equates to one of the key DORA metrics – Lead Time for Changes. Apart from that, Cycle Time is commonly divided into four phases:
- Time to Open – from the first commit to the pull request opening
- Pickup Time – from the pull request opening to when the review begins
- Review Time – from when the review begins to when the pull request is merged
- Time to Deploy – from when the pull request is merged to when it is deployed
These phases may differ slightly depending on the calculation method.
What is Lead Time?
Lead Time comes from Lean manufacturing and refers to the time between placing an order and receiving the product. In software development, Lead Time represents the total duration from the moment a client makes a request until the requested work is completed and delivered. It includes not only the time spent working on the task but also any waiting time or delays that occur during the entire workflow. So Lead Time provides insights into customer satisfaction, project management, and the identification of inefficiencies in the overall delivery process.
Cycle Time vs Lead Time: Key Differences
What they measure:
- Cycle Time measures how long it takes for a task to move from the “in progress” to the “completed” stage. It focuses on the active working time, including coding, review, and deployment phases.
- Lead Time measures how long it takes to complete a task from the backlog. It includes the entire workflow, from when the client’s request is made until it is delivered.
Who can influence:
- Cycle Time is primarily influenced by the engineering team’s workflow and efficiency. It depends on the teams’ productivity and their ability to complete tasks promptly.
- Lead Time depends not only on software development teams but also on product managers and business stakeholders who prioritize and allocate tasks.
How to measure them:
- Cycle Time can be measured automatically using tools for tracking engineering activities like Awesome Graphs for Bitbucket. It helps examine four key phases of the Cycle Time and identify areas that need attention.
- Measuring Lead Time is much more complicated and less standardized. While some tickets in backlog may wait long before being addressed or never be worked on, others are rapidly processed. Thus including all these tickets in Lead Time calculations can lead to inaccuracies and inflated metrics.
Why use them:
- Cycle Time is a valuable metric for engineering teams to optimize their day-to-day operations and measure their productivity. By tracking Cycle Time, teams can identify inefficiencies in their development workflow, streamline processes, and reduce Lead Time.
- Lead Time is essential for understanding the software development process’s responsiveness and customer satisfaction. It helps organizations set realistic expectations for their customers and stakeholders.
How to find Cycle Time in Bitbucket
As can be seen, Cycle Time and Lead Time are closely related and play an important role in understanding the speed and efficiency of the development process. However, the Lead Time metric is beyond the complete control of engineering teams and does not fully reflect their performance. Conversely, Cycle Time can be measured more precisely and serve to enhance the engineering process and improve developers’ productivity. Moreover, influencing Cycle Time and its four phases can significantly change Lead Time. That’s why Git repository tracking tools like Awesome Graphs for Bitbucket consider Cycle Time as a more accurate measure of software development team performance.
Awesome Graphs is an easy-to-use tool that seamlessly integrates into Bitbucket and transforms invisible engineering activities into actionable insights. It helps IT managers and their teams better understand the development process and effectively monitor team productivity, including Cycle Time.
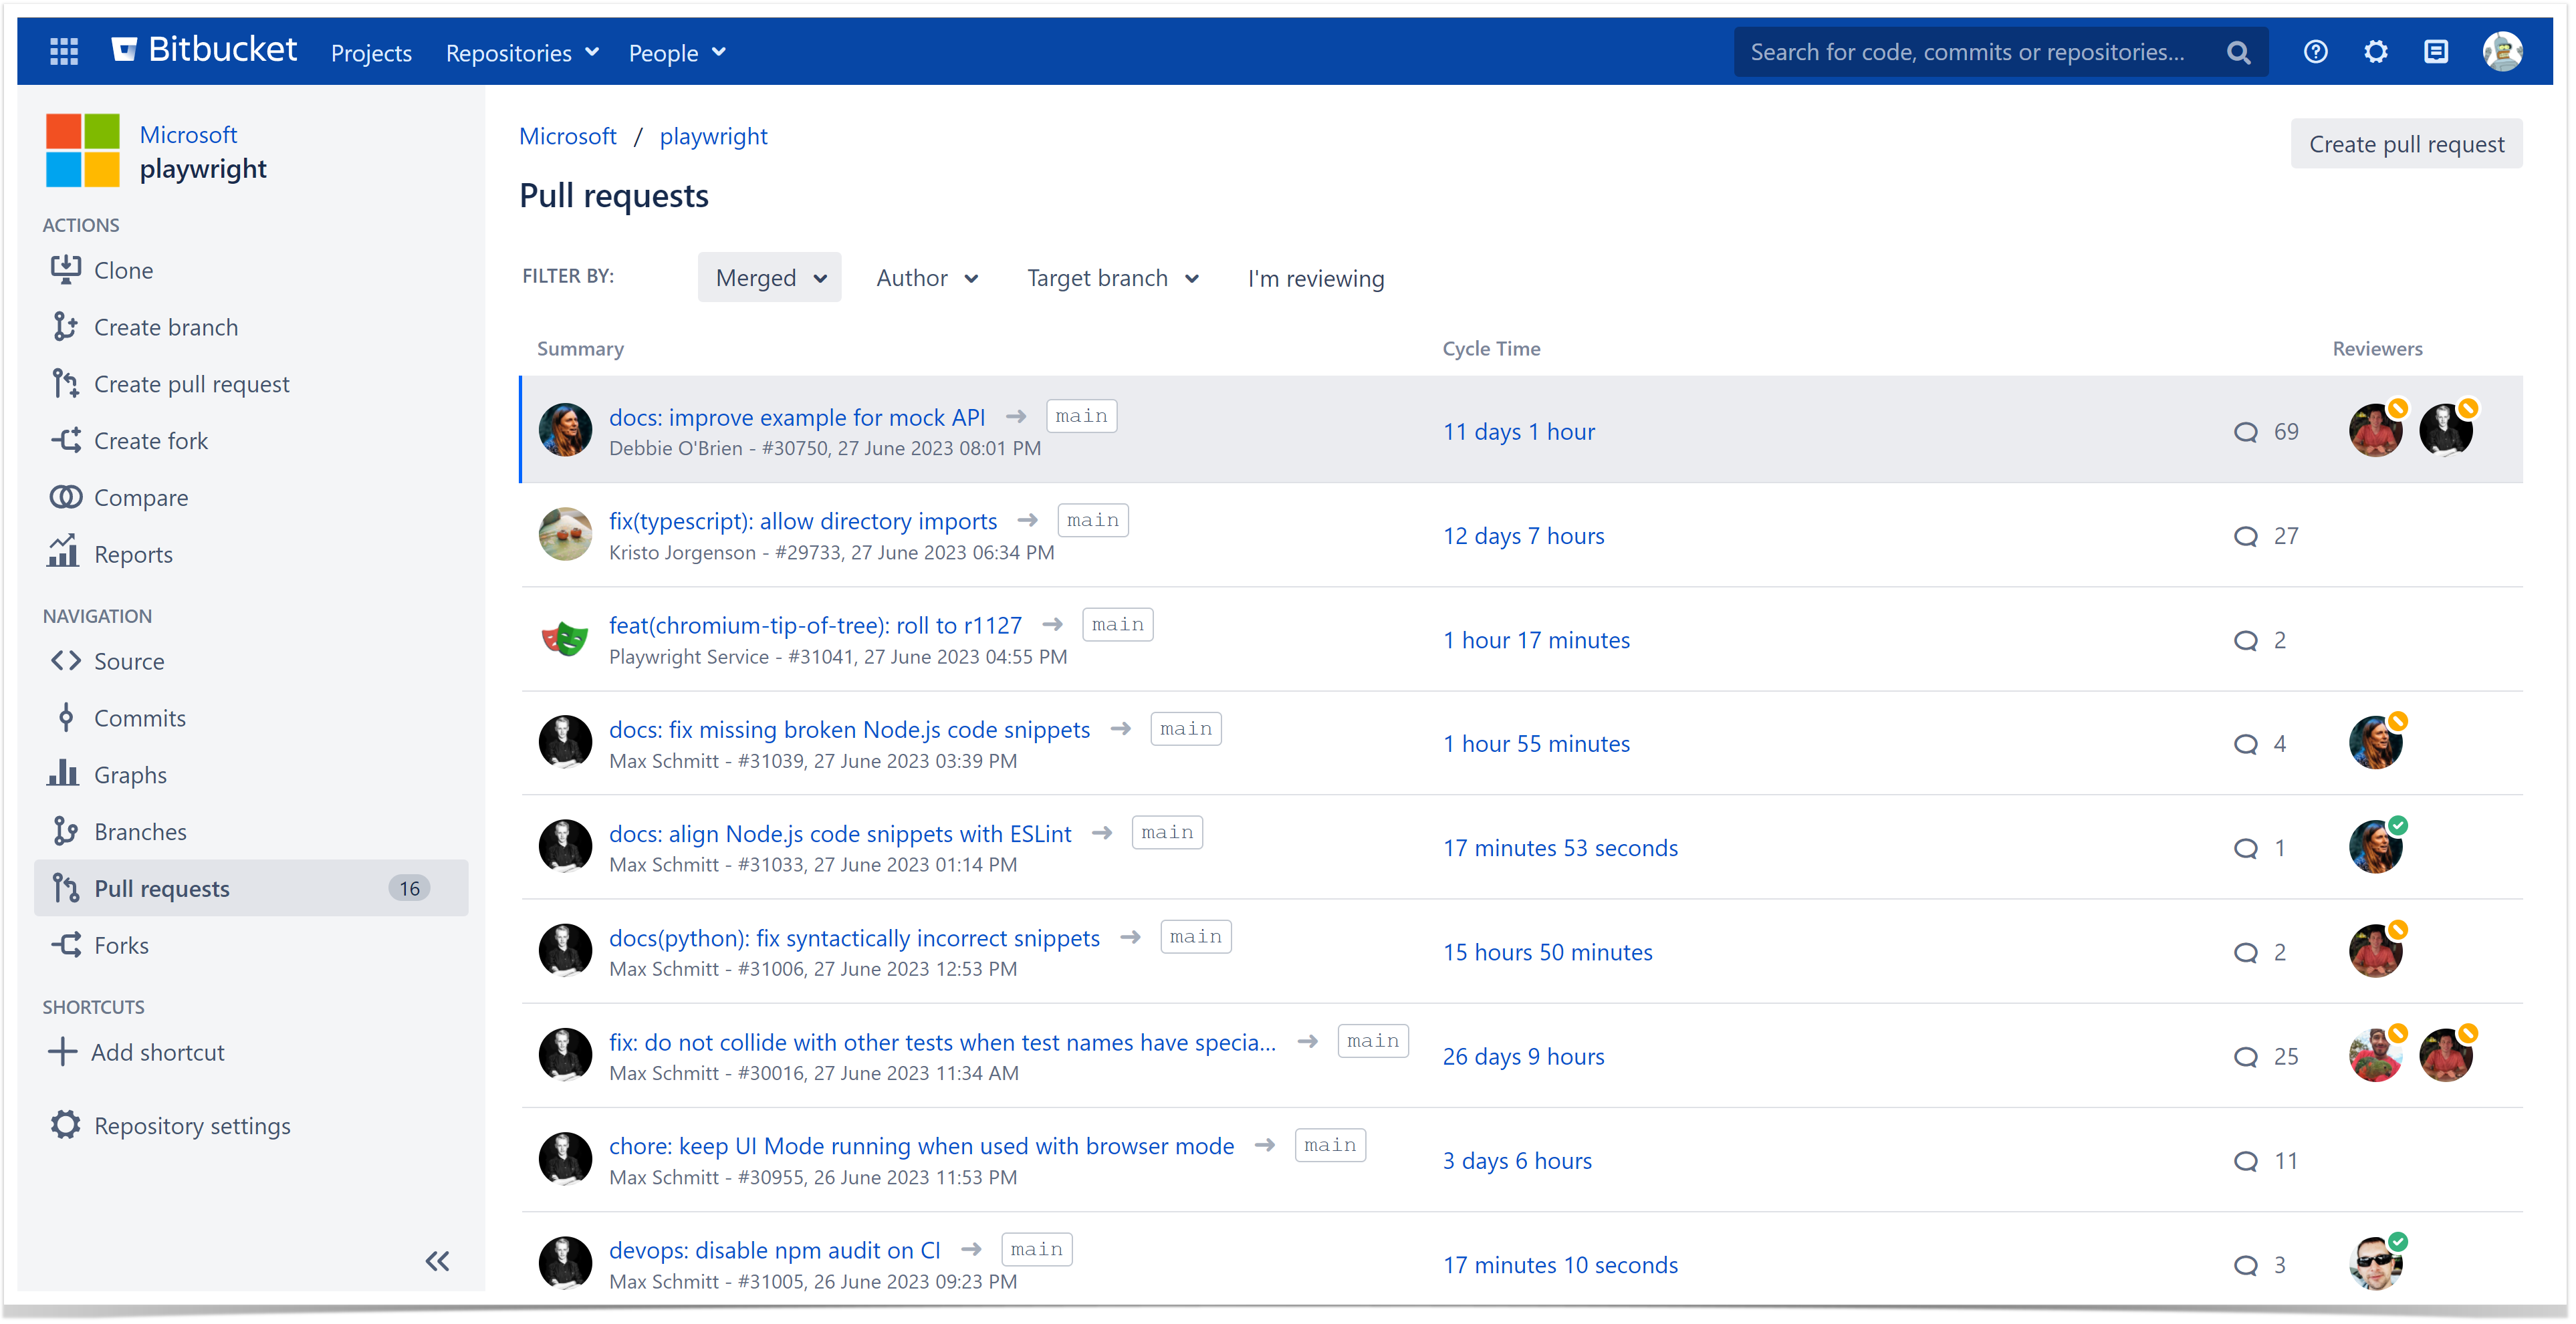
The Cycle Time column extends the Bitbucket pull requests page and allows you to monitor whether the development process is getting faster or slower.
Apart from this, you can click on a value in the Cycle Time column against a particular pull request to see the breakdown and analyze each cycle phase.
Cycle Time is a crucial metric in software development, directly impacting efficiency and productivity. With Cycle Time as a guiding measure, software development teams can continuously improve their processes and enhance overall performance. Awesome Graphs for Bitbucket enables teams to measure and track Cycle Time effectively. With this tool, engineering teams can identify bottlenecks, improve their processes, and deliver high-quality products faster.
Start your free trial and monitor your development process effortlessly.


