How to Find Pull Request Metrics in Bitbucket

Measuring pull request metrics in Bitbucket can be tricky and time-consuming, as it encompasses a wide range of data scattered around different repositories, teams, and projects. This article will explore what PR metrics are worth tracking, why, and how to find them using an on-prem app called Awesome Graphs for Bitbucket.
Awesome Graphs for Bitbucket is an app for engineering managers and their teams that transforms invisible developers’ activities into easy-to-understand graphs and reports. It helps over 1,6K customers, including Apple, Oracle, and MasterCard, manage engineering productivity, remove process blockers, and improve delivery.
Let’s dive into tips for measuring pull request data.
Number of Pull Requests
Tracking the number of pull requests gives an overview of the development activity within a project. However, simply counting pull requests provides superficial information and does not reflect actual team progress. That’s why it is important to look at the number of created, merged, and declined PRs, as well as their ratio.
Creating more pull requests may indicate more active development and a fast-paced project. But, it could also mean higher cycle time if no reviewers are available, increased code complexity, or irrational distribution of efforts if not managed effectively.
Therefore, it is better to look at this metric together with the number of merged pull requests as they generally indicate progress and contributions accepted into the project. They are also one of the indicators of an effective code review process.
Using Awesome Graphs for Bitbucket, visualized statistics of these metrics and their ratio can be found in the Created vs Merged Pull Requests Report. It displays how many pull requests were created and merged during a particular time.
 One more metric to look at is the number of declined pull requests. While a certain number of them are usual practices due to bugs or outdated changes, high rates might indicate misalignment with project goals, lack of code quality, or poor communication.
The Awesome Graphs’ Pie Chart Report allows you to see the number of opened, merged and declined pull requests and their ratio to assess the health of the development process.
 This report can also be reconfigured to see the number of PRs merged without reviewers, as code without checking could lead to poor quality, vulnerabilities, or misalignment with project standards, impacting the overall quality of the software.

Pull Request Cycle Time
One more metric that is worth tracking is cycle time. It provides insights into how quickly PRs are reviewed, approved, and merged and helps evaluate a code review process and speed of delivery. Usually, a shorter cycle time means a more efficient development process.
It is also beneficial to examine the four phases of cycle time to see more accurately where bottlenecks and inefficiencies are in the process. Here they are:
- Time to Open reflects how quickly the code review process is initiated.
- Pickup Time indicates the reviewers’ workload, priorities, and communication efficiency.
- Review Time provides insights into the speed of giving feedback, implementation of changes, and reaching agreements.
- Time to Deploy shows the speed of delivery to end users.
By using Awesome Graphs, these metrics can be found on the Bitbucket Pull Requests page.
 The app also allows seeing the most frequent resolution times to make more accurate project estimations and spot pull requests that take very long or short to resolve.

Activities in Pull Requests
The number of comments and the level of engagement from reviewers contain valuable insights into team collaboration, code quality, and the effectiveness of the code review process. At the Awesome Graphs team, during the code review, we always consider the number of activities in each pull request, as many comments might indicate some issues in the workflow. At the same time, a reasonable amount of discussion leads to higher-quality code and creates a collaborative environment within the team.
The activities in pull requests can be found in the Contributions Report. It shows how many comments each reviewer made in pull requests as well as how many comments each author got from reviewers.
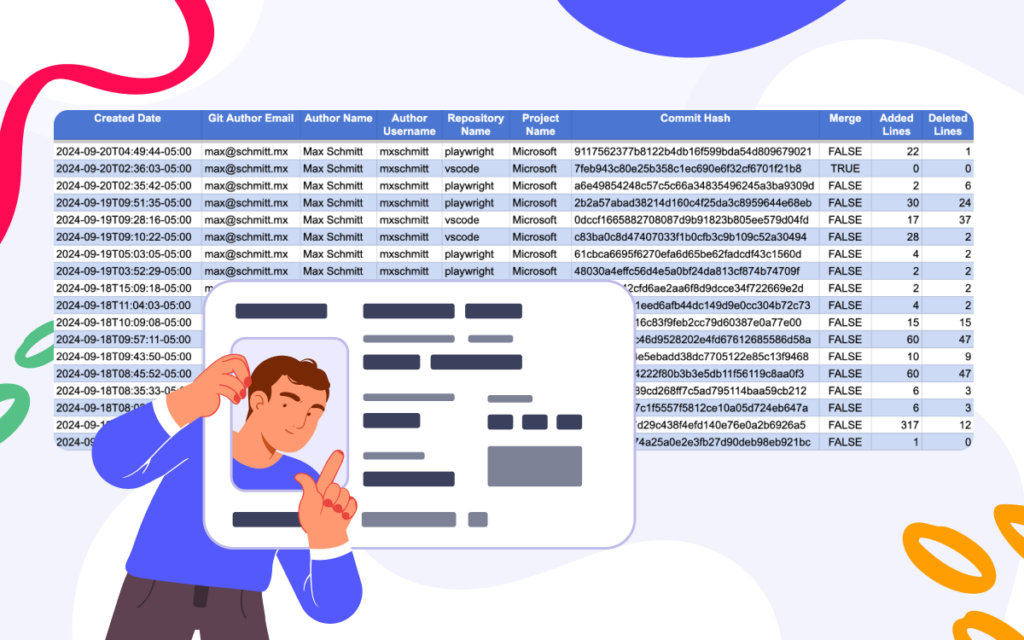
 Apart from out-of-the-box reports, Awesome Graphs for Bitbucket provides the capability to export pull request data to a CSV file or via REST API to build custom reports and gain insights tailored to specific needs.
To sum up, pull request metrics provide an overall view of what is happening in projects and within teams. Choosing the most important ones for you and looking at them holistically will help you make informed decisions based on well-rounded insights, evaluate the code review process, and improve product delivery. Incorporating Awesome Graphs for Bitbucket into your software development workflow will make tracking these metrics much easier and more efficient.