How to Get Custom Reports from Bitbucket Data

Are you looking for a way to pull data from Bitbucket Data Center to build custom reports? This article will show how to get tailored solutions using Awesome Graphs for Bitbucket REST APIs and Python.
Awesome Graphs is an app for Bitbucket that enables exporting commits and pull requests data to a CSV file or via REST API as well as provides a set of out-of-the-box graphs and reports on engineering activities.
To help you get an overview of what can be done with our REST API resources, we’ve prepared some examples of scripts we wrote for our clients with specific reporting needs.
How to get a CSV with the number of pull requests in each repository of each project
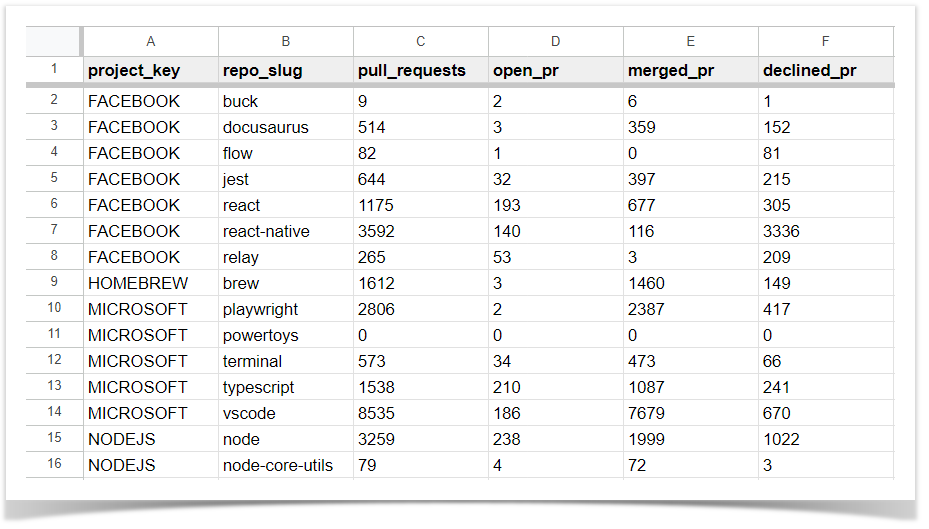
One of our clients wanted to get a report on how many pull requests were made in each repository of each project during a certain period. They wanted to see the overall number of pull requests as well as the number of open, merged, and declined PRs. We wrote the following script that requests the Awesome Graphs REST API and calculates all the necessary data:
import requests
import csv
import sys

bitbucket_url = sys.argv[1]
login = sys.argv[2]
password = sys.argv[3]
since = sys.argv[4]
until = sys.argv[5]

bb_api_url = bitbucket_url + '/rest/api/latest'
ag_api_url = bitbucket_url + '/rest/awesome-graphs-api/latest'

s = requests.Session()
s.auth = (login, password)


def get_project_keys():

    projects = []

    is_last_page = False

    while not is_last_page:

        request_url = bb_api_url + '/projects'
        response = s.get(request_url, params={'start': len(projects), 'limit': 25}).json()

        for project in response['values']:
            projects.append(project['key'])

        is_last_page = response['isLastPage']

    return projects


def get_repos(project_key):

    repos = list()

    is_last_page = False

    while not is_last_page:

        request_url = bb_api_url + '/projects/' + project_key + '/repos'
        response = s.get(request_url, params={'start': len(repos), 'limit': 25}).json()

        for repo in response['values']:
            repos.append(repo['slug'])

        is_last_page = response['isLastPage']

    return repos


def get_pull_requests(project_key, repo_slug):

    url = ag_api_url + '/projects/' + project_key + '/repos/' + repo_slug + \
          '/pull-requests/statistics'
    response = s.get(url, params={'sinceDate': since, 'untilDate': until}).json()

    pull_requests = response['pullRequests']
    open_pr = response['state']['open']
    merged_pr = response['state']['merged']
    declined_pr = response['state']['declined']

    return project_key, repo_slug, pull_requests, open_pr, merged_pr, declined_pr


with open('pull_requests_per_repo_{}_{}.csv'.format(since, until), mode='a', newline='') as report_file:
    report_writer = csv.writer(report_file, delimiter=',', quotechar='"', quoting=csv.QUOTE_MINIMAL)
    report_writer.writerow(['project_key', 'repo_slug', 'pull_requests', 'open_pr', 'merged_pr', 'declined_pr'])

    for project_key in get_project_keys():
        print('Processing project', project_key)

        for repo_slug in get_repos(project_key):
            report_writer.writerow(get_pull_requests(project_key, repo_slug))

print('The resulting CSV file is saved to the current folder.')
To make this script work, you’ll need to install the requests module in advance. The csv and sys modules are available in Python out of the box. Apart from this, you need to add five arguments to the script when executed: the URL of your Bitbucket, login, password, since date, and until date. Here’s an example:
python pull_requests_per_repo.py https://bitbucket.your-company-name.com login password 2023-01-01 2023-12-31
After running this script, you will get a CSV file with the needed data. 
How to get the number of users’ commits in each project and repo
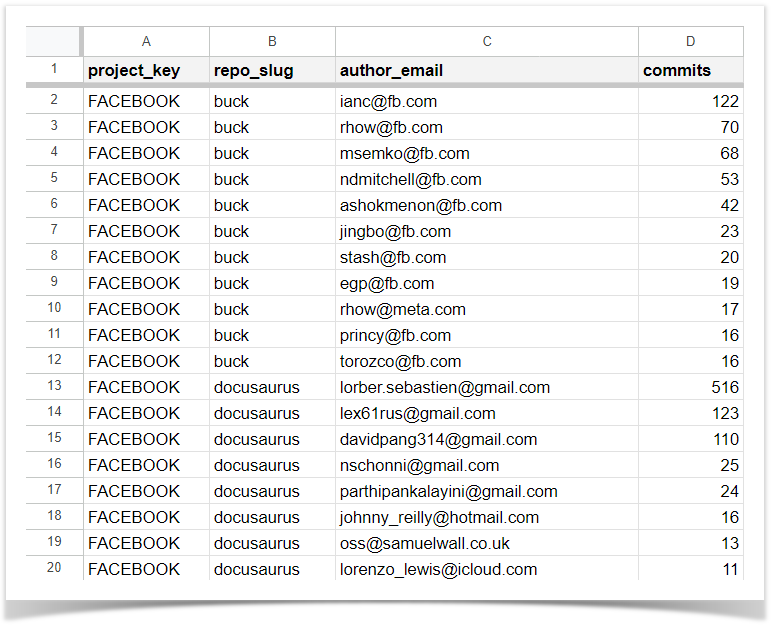
Another solution we helped our client with is a report on how many commits each user made in each project and repo during a specific period. The resulting CSV file has four columns:
- project key
- repository slug
- author’s email
- number of author’s commits (sorted from largest to smallest per repo)

import requests
import csv
import itertools
import sys

bitbucket_url = sys.argv[1]
login = sys.argv[2]
password = sys.argv[3]
since = sys.argv[4]
until = sys.argv[5]

s = requests.Session()
s.auth = (login, password)


class Commit:

    def __init__(self, project, repo, email):
        self.project = project
        self.repo = repo
        self.email = email


class ProcessedCommitData:

    def __init__(self, project_key, repo_slug, author_email, commits):
        self.project_key = project_key
        self.repo_slug = repo_slug
        self.author_email = author_email
        self.commits = commits


def get_commits():

    commit_list = []

    is_last_page = False

    while not is_last_page:

        url = bitbucket_url + '/rest/awesome-graphs-api/latest/commits'

        response = s.get(url, params={'sinceDate': since, 'untilDate': until, 'start': len(commit_list), 'limit': 1000}).json()

        for commit_data in response['values']:

            project = commit_data['repository']['project']['key']
            repo = commit_data['repository']['slug']
            email = commit_data['author']['emailAddress']

            commit_list.append(Commit(project, repo, email))

        is_last_page = response['isLastPage']

    return commit_list


def get_details(data):
    return data.project, data.repo, data.email


with open('global_commits_statistics_{}_{}.csv'.format(since, until), mode='a', newline='') as report_file:

    report_writer = csv.writer(report_file, delimiter=',', quotechar='"', quoting=csv.QUOTE_MINIMAL)
    report_writer.writerow(['project_key', 'repo_slug', 'author_email', 'commits'])

    global_commit_list = []

    for commit in get_commits():
        global_commit_list.append(commit)

    global_commit_list.sort(key=get_details)

    grouped_without_commits_number = itertools.groupby(global_commit_list, get_details)

    grouped_result = []

    for key, group in grouped_without_commits_number:
        project_key = key[0]
        repo_slug = key[1]
        author_email = key[2]
        commits = len(list(group))
        grouped_result.append(ProcessedCommitData(project_key, repo_slug, author_email, commits))

    grouped_result.sort(key=lambda processed_data: (processed_data.project_key, processed_data.repo_slug, -processed_data.commits))

    for result in grouped_result:
        report_writer.writerow([result.project_key, result.repo_slug, result.author_email, result.commits])

print('The resulting CSV file is saved to the current folder.')
Like with the previous script, you must install the requests module in advance. The csv, sys, and itertools modules are available in Python out of the box. Then, you need to pass five arguments to it when executed: the URL of your Bitbucket, login, password, since date, and until date. Here’s an example of running the script:
python global_commits_statistics.py https://bitbucket.your-company-name.com login password 2023-12-01 2023-12-31
This script can help analyze who’s recently committed to a specific repository, see how resources are allocated, measure each team member’s performance and their impact across different projects.
How to get the number of changes made to files in a repo
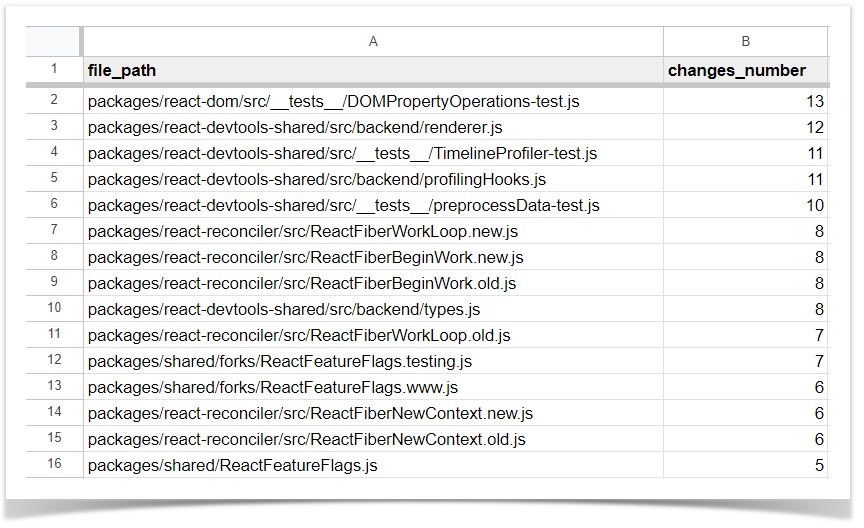
Another example we’d like to share is getting a report on how many and in which repository files the changes were made during a specific time span. Our script delivers a CSV with two columns: a file path and the number of changes. 
import sys
import requests
import csv
from collections import Counter

bitbucket_url = sys.argv[1]
login = sys.argv[2]
password = sys.argv[3]
project = sys.argv[4]
repository = sys.argv[5]
since = sys.argv[6]
until = sys.argv[7]

s = requests.Session()
s.auth = (login, password)


def get_commit_ids():

    commit_ids = []

    is_last_page = False

    url = f'{bitbucket_url}/rest/awesome-graphs-api/latest/projects/{project}/repos/{repository}/commits'

    while not is_last_page:

        response = s.get(url, params={'sinceDate': since, 'untilDate': until, 'start': len(commit_ids), 'limit': 1000}).json()

        for commit_data in response['values']:

            commit_id = commit_data['id']

            commit_ids.append(commit_id)

        is_last_page = response['isLastPage']

    return commit_ids


def get_files(commit_id):

    print('Processing commit', commit_id)

    files_in_commit = []

    url = f'{bitbucket_url}/rest/awesome-graphs-api/latest/projects/{project}/repos/{repository}/commits/{commit_id}'

    response = s.get(url, params={'withFiles': 'true'}).json()

    for changed_file in response['changedFiles']:

        changed_file_path = changed_file['path']

        files_in_commit.append(changed_file_path)

    return files_in_commit


commit_ids_list = get_commit_ids()

commit_files_list = []

for commit in commit_ids_list:

    commit_files_list.extend(get_files(commit))

changes_counter = Counter(commit_files_list)


with open(f'{project}_{repository}_changes_{since}_{until}.csv', mode='a', newline='') as report_file:

    report_writer = csv.writer(report_file, delimiter=',', quotechar='"', quoting=csv.QUOTE_MINIMAL)

    report_writer.writerow(['file_path', 'changes_number'])

    for change in changes_counter.most_common():

        file_path = change[0]
        changes = change[1]

        report_writer.writerow([file_path, changes])

print('The resulting CSV file is saved to the current folder.')
The script has requirements similar to those in previous examples. The only difference is that you must pass seven arguments: the URL of your Bitbucket, login, password, project, repository name, since date, and until date. Here’s an example:
python file-changes-counter.py https://bitbucket.your-company-name.com login password project repository 2023-01-01 2023-01-31
By analyzing the number of changes made in a repository, you can assess the code quality or complexity of a repository and identify frequently modified or problematic files. Also, it can help identify potential technical debt and guide refactoring efforts.
Using Awesome Graphs REST APIs and custom scripts helps create versatile reports from Bitbucket data tailored to specific needs. Our flexibility and customization allow our clients to adapt the standard functionality to various reporting and data analysis approaches.
If you’re interested in other requests solved with Awesome Graphs for Bitbucket, we invite you to explore other articles on this topic:
- How to Get the Number of Commits and Lines of Code in Pull Requests
- How to Count Lines of Code in Bitbucket to Decide What SonarQube License You Need
Feel free to share your challenges with getting the needed data from Bitbucket so we can assist you.


