How to Do a Code Review in Bitbucket: Best Practices from Our Team
In this article, we will spill the beans and share how our team conducts code review in Bitbucket to ensure smooth feature delivery and mitigate risks.
At Stiltsoft, we have several development teams dedicated to creating apps that enhance the functionality of Atlassian products. Our development team consists of 4 full-stack engineers with accumulated software development experience of over 30 years and focuses on several apps for Jira and Bitbucket. One of them is Awesome Graphs for Bitbucket.
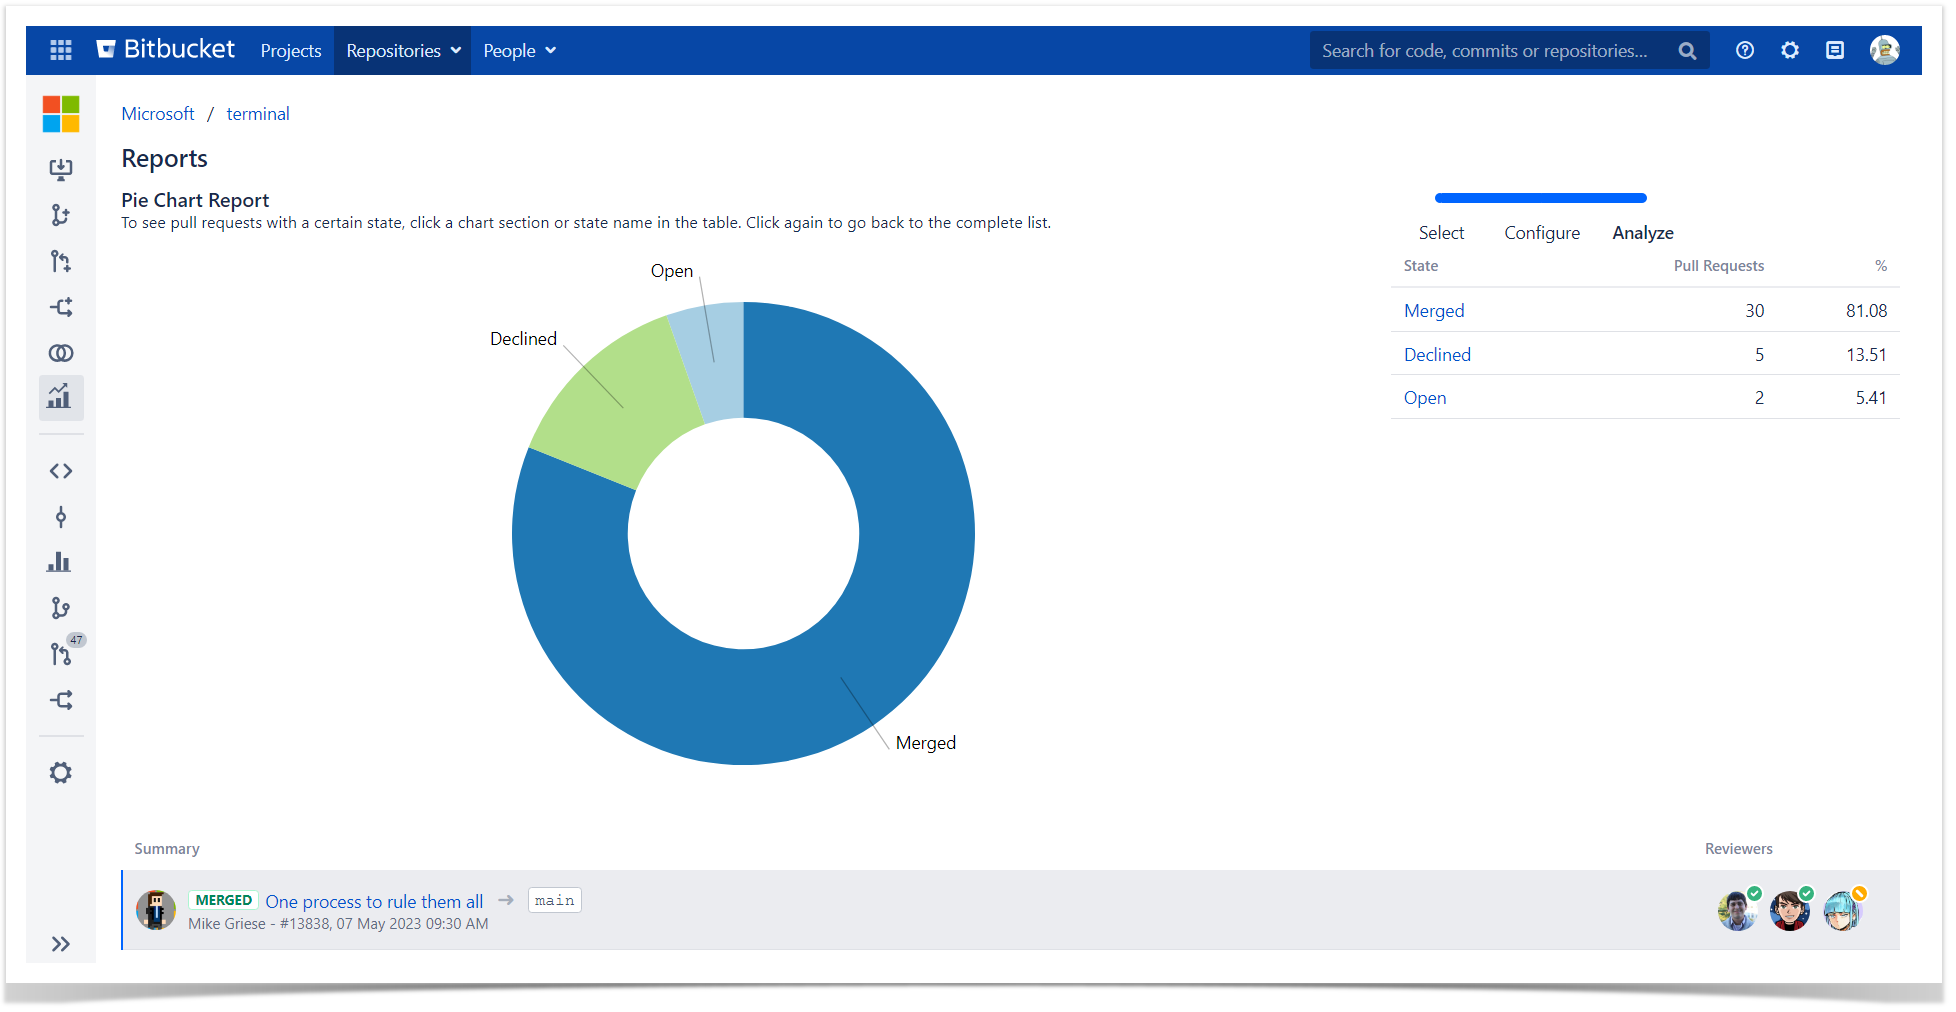
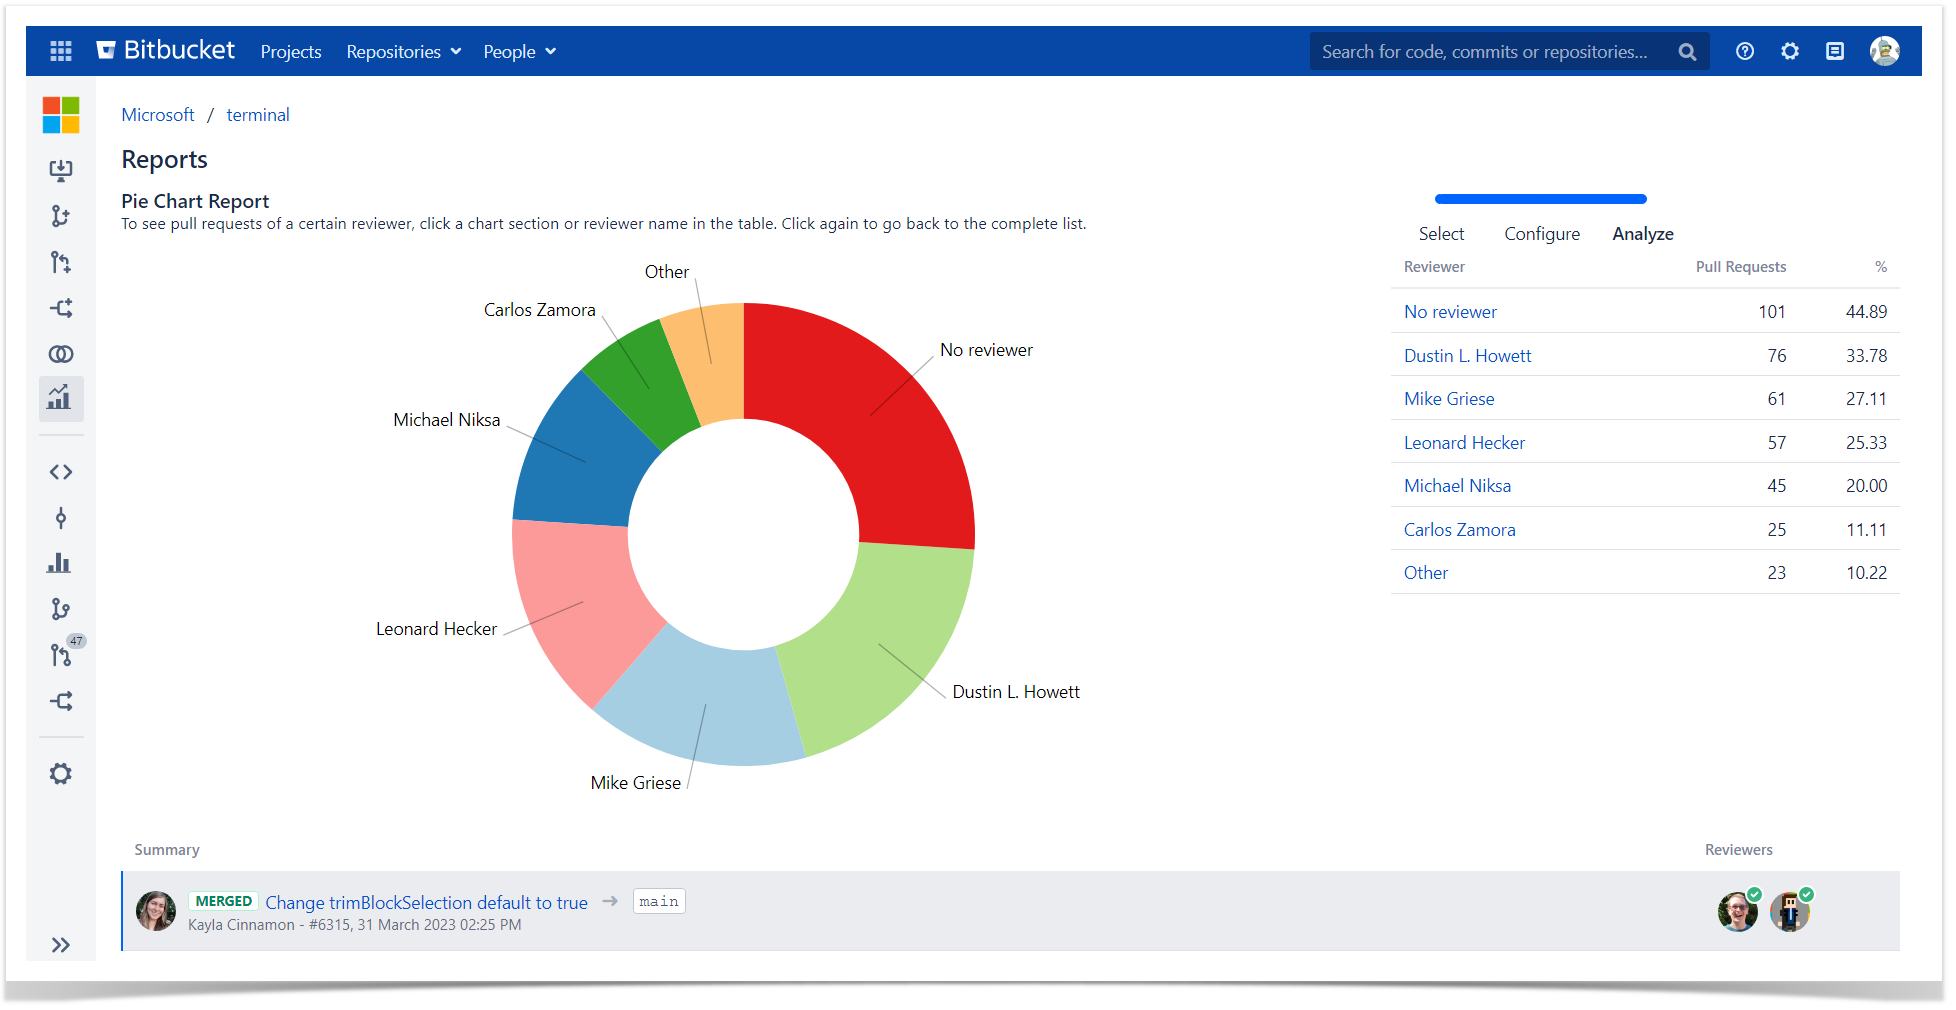
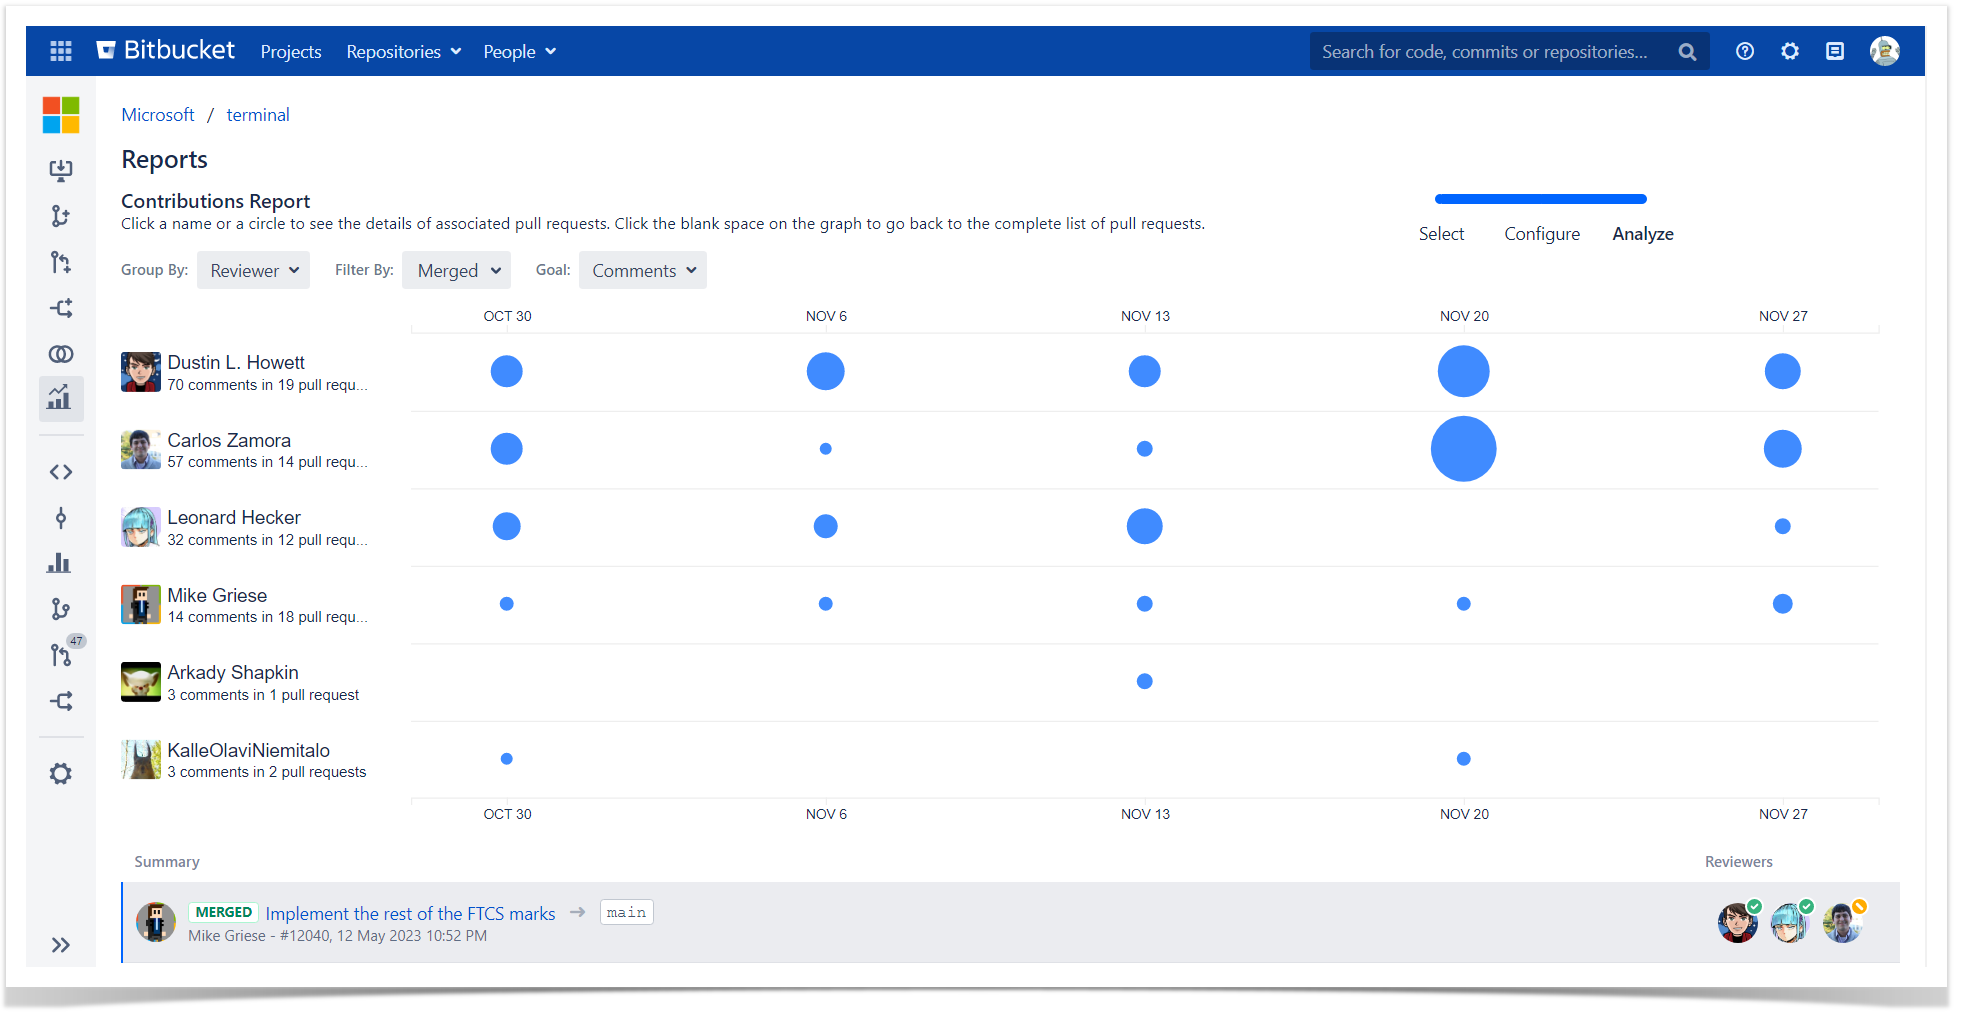
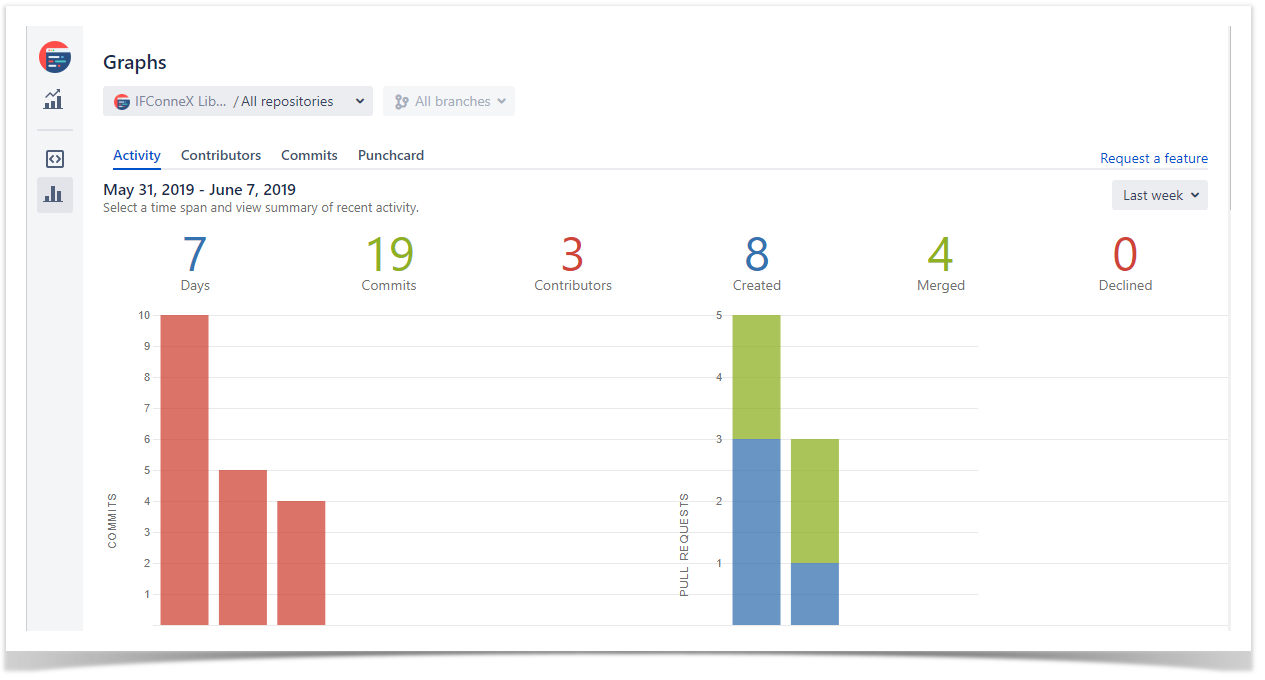
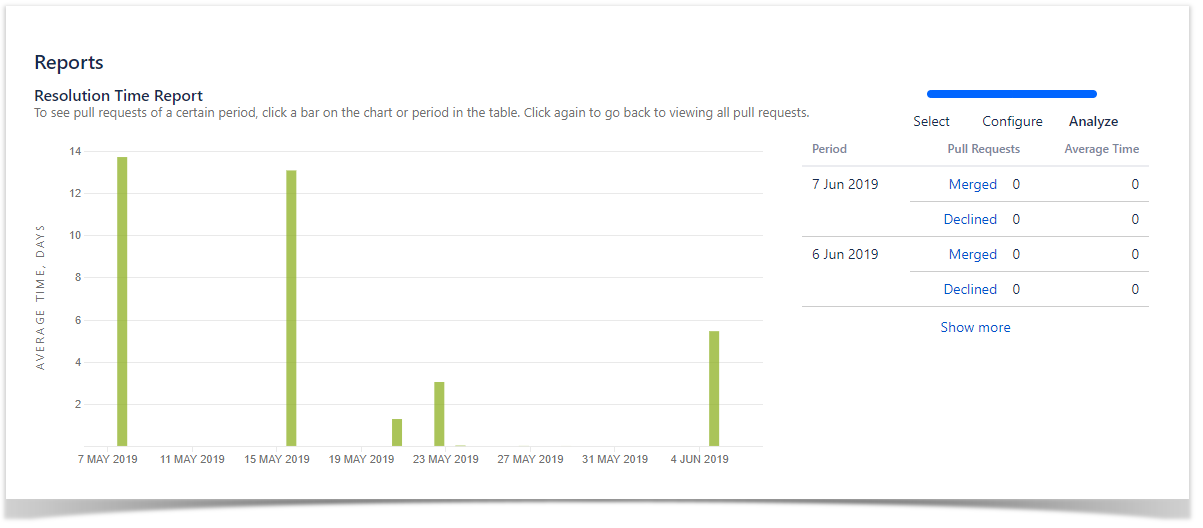
Awesome Graphs for Bitbucket is a tool that helps over 1,600 development teams leverage engineering analytics. It provides built-in Bitbucket reporting as well as REST API and CSV data export for custom automated solutions.
Table of Contents
Software Development Workflow
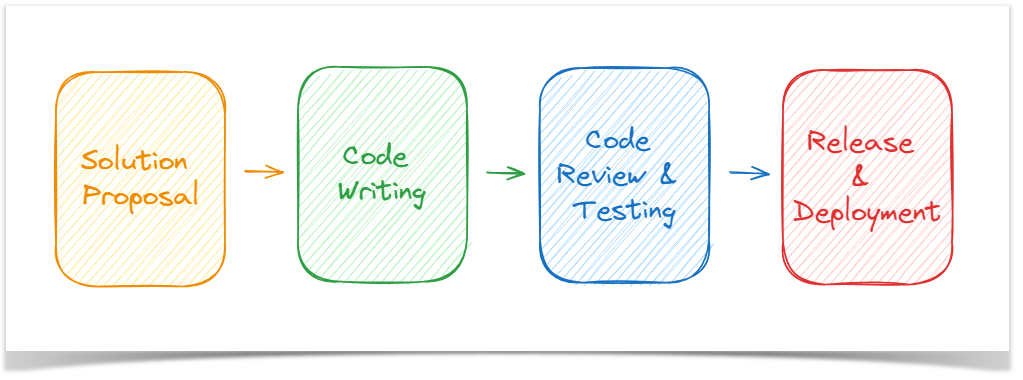
The illustration of the code review process and its main principles would only be complete by delving into the software development workflow. In our team, this process is structured around the following key milestones:
- Solution Proposal
- Code writing
- Code review and Testing
- Release and Deployment
Let’s look closer at the first three stages and their peculiarities.
Solution Proposal
Before making significant changes to the code, we prepare a Solution Proposal to outline the planned changes and their implementation to our teammates. Significant changes include:
- adding a completely new feature
- making substantial changes to UI or changes that impact many files
- changing backend components
- integrating new tools.
Our solution proposal consists of 4 main parts:
- Motivation – Why did we decide to work on this issue?
- Context of the problem – What is happening now?
- Suggested Solution – How exactly are we going to implement this?
- Consequences – What changes will this solution entail?
This is extremely useful, particularly for newcomers who could spend a lot of time implementing a solution that either does not meet our internal standards or could be achieved much easier and faster as we have already resolved such issues. Apart from this, it helps the whole team to:
- validate the solution with colleagues and avoid “tunnel vision” or reinventing the wheel
- discuss the implementation of complex issues that are not entirely clear how to solve
- facilitate the later code review process as teammates are already familiar with the proposed solution
- check if the suggested solution adheres to the business requirements.
When the Solution Proposal is ready, the author shares it with the product and development teams and organizes a call in Slack to discuss questions if necessary. These documents are stored in the Confluence product space, ensuring that our team or colleagues can access them whenever needed.
Code Writing
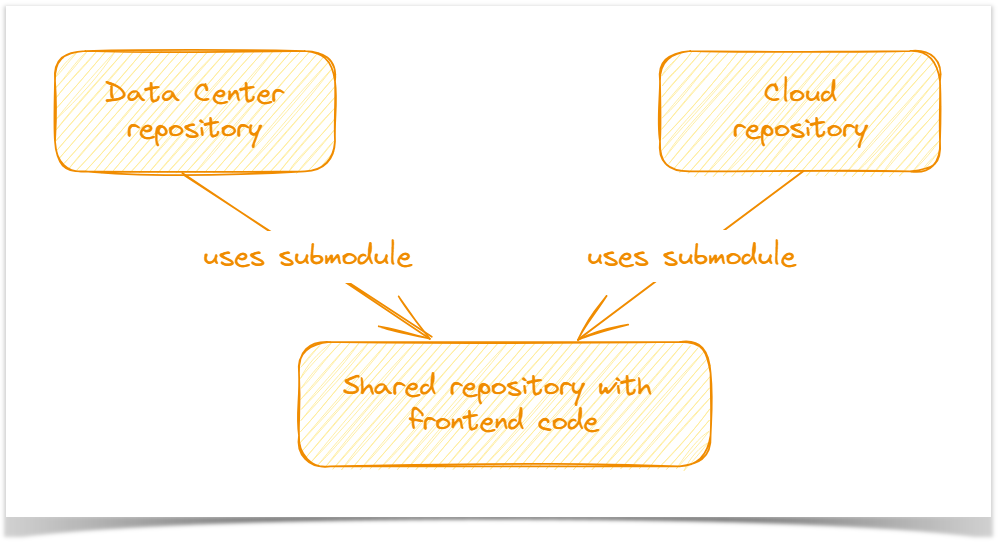
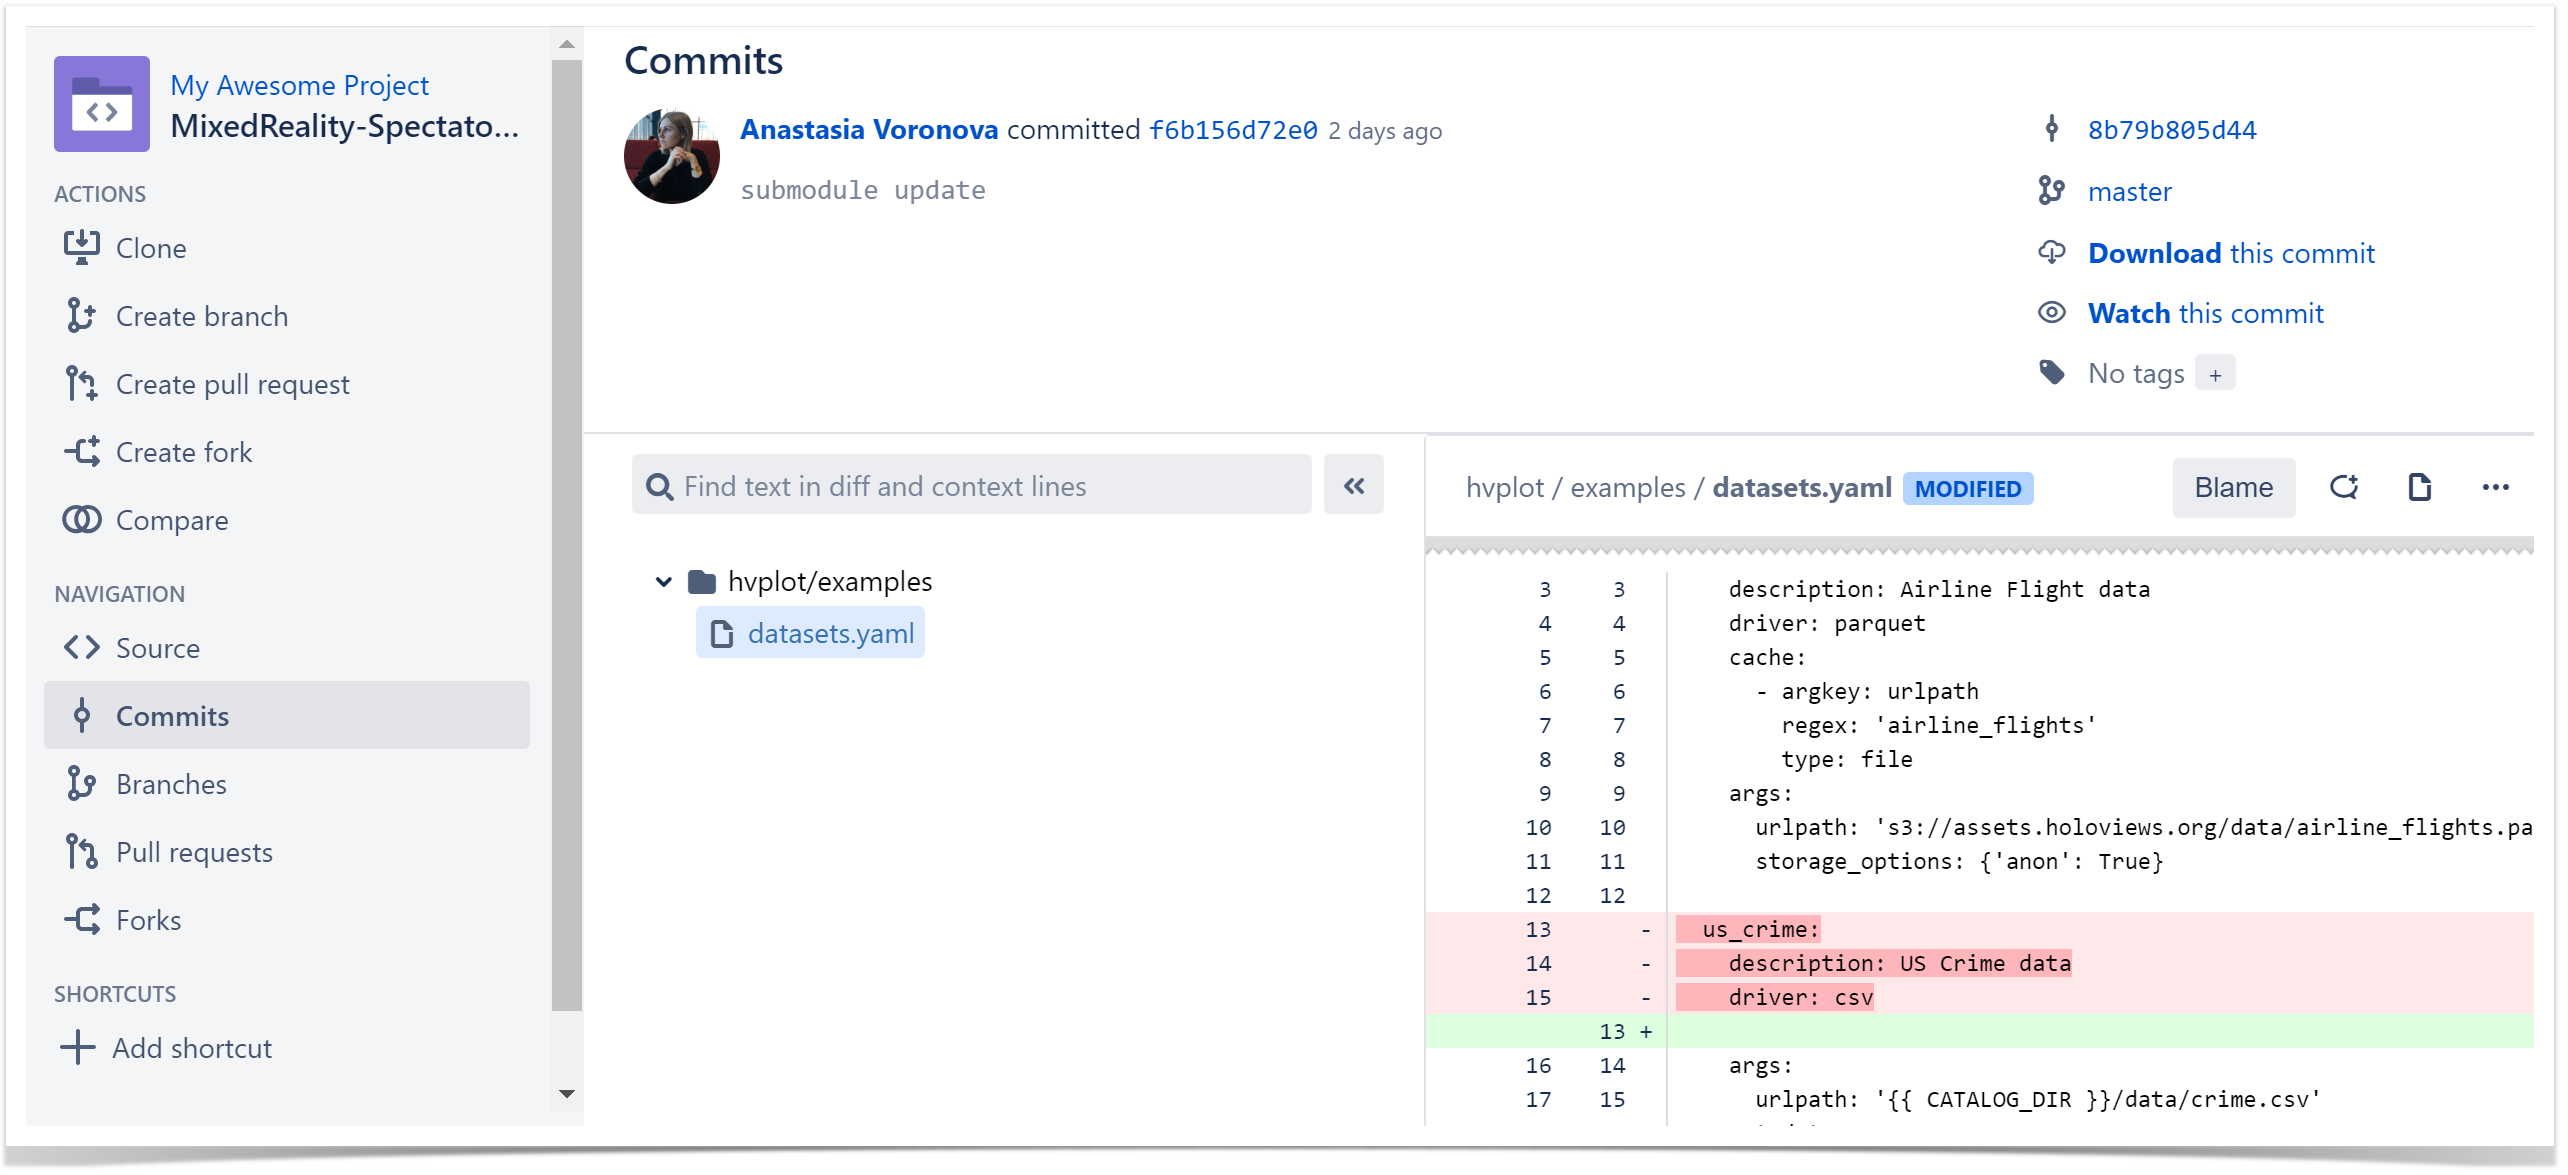
Here, we won’t dwell on how to write the code but will describe how the repositories are structured, using the example of one of our apps, Awesome Graphs for Bitbucket. Since the apps for Bitbucket Cloud and Data Center differ in functionality, we have two separate repositories for them. However, unlike the backend, the frontend for both app editions is almost identical. To avoid duplicating features, we allocated the shared part of the code into a separate third repository and connected it as a Git submodule.
It allows us to:
- maintain consistency across both versions of the app
- avoid code duplicating and implementing shared features twice
- reduce redundancy and development efforts.
However, this solution has its drawbacks, such as:
- Complexity in reviewing changes as reviewers might need to navigate between the parent repository and the submodule’s repository to understand the full context of the changes.
- Merge conflicts as adding a new feature to the shared code for one parent repository blocks changes for the second repo until we update the submodule.
- Submodule updates challenges as we don’t create a separate pull request in the subdirectory. Thus, after merging the pull request into the main repository, the author needs to remember to merge the feature branch of the shared repo to the dev branch.
How the team tackles these challenges:
- We use Submodule Changes for Bitbucket to avoid complexity in reviewing changes. This tool allows us to review code changes in the subdirectory as a part of the main repository. We can leave comments and tasks on the submodule’s code in the pull request of the parent repo.
- Possible merge conflicts and the impact of a feature on another parent repo are considered within the Solution Proposal.
- We use the internal app to automate the process of merging the feature branch to the dev branch of the shared repository.
Code Review and Testing
Since the details of the code review will be given in the next section, the only thing to mention here is that we create pull requests to facilitate this process in Bitbucket Data Center.
As for testing, an important point to note is that we don’t have QA engineers. The development team carries out testing to check the code for bugs and errors, and the product team to verify compliance with business requirements. We can use tools like Playwright to automate the process if necessary. The main idea behind this approach is that if a developer writes code conscientiously and pays attention to the quality, there is no need to involve testers. The code owner will understand its behavior and find deviations much better than anyone else. The developer creates tests during code writing to cover at least 80% of the code in the pull request. This is tracked for each commit using SonarQube.
Now that you know the main milestones of our development process, let’s move on to the main principles of the team’s code review process.
Code Review Guidelines of Our Team
When to Create a Pull Request
We agreed to create a pull request only if it contains code ready for deployment so the app will remain working after its merge. When an author needs feedback on functionality that is not ready for production, alternative ways, such as comparing two branches or requesting assistance in Slack, are used.
When there are dependent pull requests, the subsequent pull request is created only when the previous one was merged. For example, we recently enhanced one of the reports for the Awesome Graphs app. To avoid making one large pull request, we split the code changes into two parts: frontend and backend. Initially, the author created a pull request to review changes in the backend. Only after its merge did they submit the second one with frontend modifications. This is done to ensure that reviewers don’t get puzzled over determining which pull request to review first and have a clear understanding of priorities.
In this case, two versions of one functionality may appear in the master branch. As in the example above, we had two backend versions for the same report. That’s why, to indicate our intention to remove the old functionality soon and ensure that another developer won’t start using it, we annotate methods and classes slated for removal in future pull requests with “Deprecated”. This annotation should contain a link to the feature, after which completion, the annotated element should be deleted.
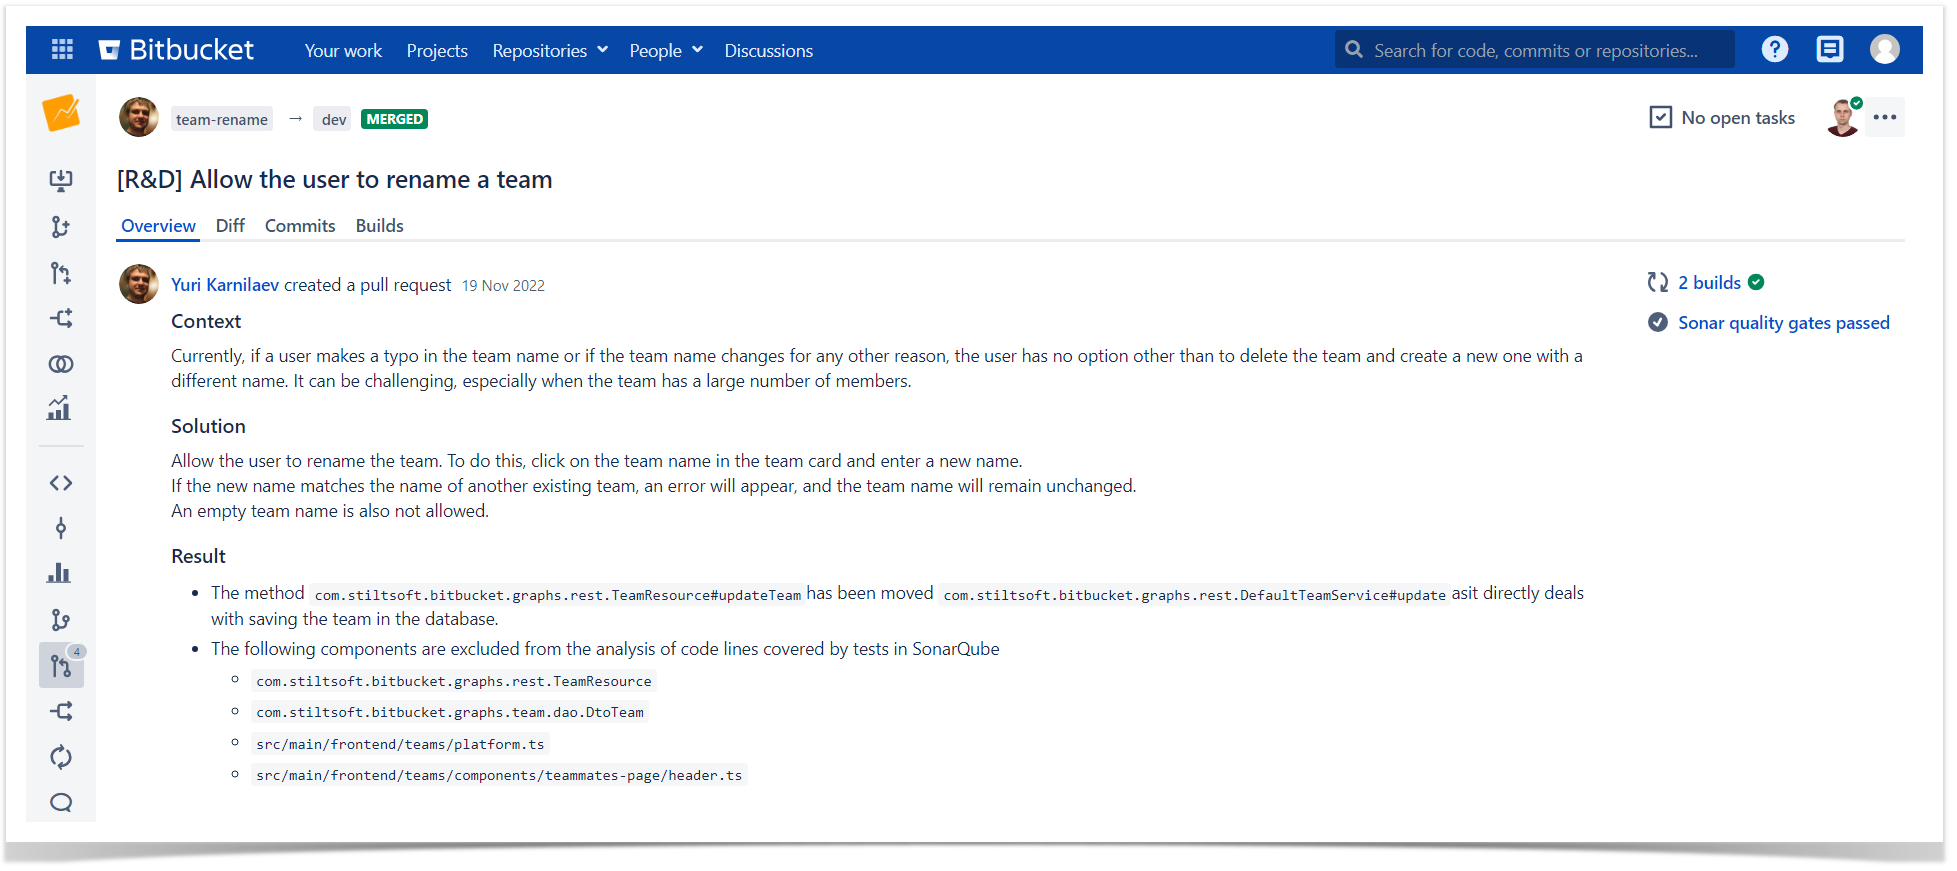
Pull Request Title and Description
Creating a pull request is always accompanied by giving it a title and adding a description. The title should be clear and reflect the essence of code changes, e.g., Pie Report Optimization: Backend.
The description is added so that each reviewer understands what changes will be made and why. It is similar to a short summary of the Solution Proposal and consists of 3 parts:
- Context. An overview of the initial problem and associated constraints.
- Solution. Key points of how we resolve the issue.
- Results. A brief description of what we will get after implementing this solution.
Pull Request Reviewers
As our development team is relatively small, we add all members to review a pull request by default. This is done to share knowledge and ensure everyone is aware of code changes. However, if a reviewer cannot participate in code review for any reason, e.g., vacation, illness, or heavy workload, they remove themselves from the list of reviewers. Later, they can rejoin code review if circumstances have changed.
The main principle is that at least one reviewer should always be available to assess the pull request. Typically, code reviews involve 2-3 developers.
Once all developers have approved the pull request, the author adds a product team member. This step is essential as the product team tests changes and checks their compliance with the requirements and expected results.
PR Pickup Time & Review Rounds
During code review, one of the crucial aspects our team considers is pull request pickup time. We define it as the time from when a reviewer is added to the pull request until their first action.
The Service Level Agreement (SLA) for pickup time is one working day. The pull request author monitors this, and if no response is received within this time frame, they notify the team in the Slack channel. The second and subsequent reminders the author sends once every 4 hours.
We clearly define these time frames to avoid making the author guess when they will receive feedback and to enable them to make plans and work on other tasks.
The same rules are applied to reviewers’ pickup time after changes are made to the pull request. In this case, the author notifies reviewers by adding a comment such as “All comments addressed, please review again.”
Reviewers, in turn, notify the author of the pull request that they finished the code review by adding “Approved” or “Needs work” status.
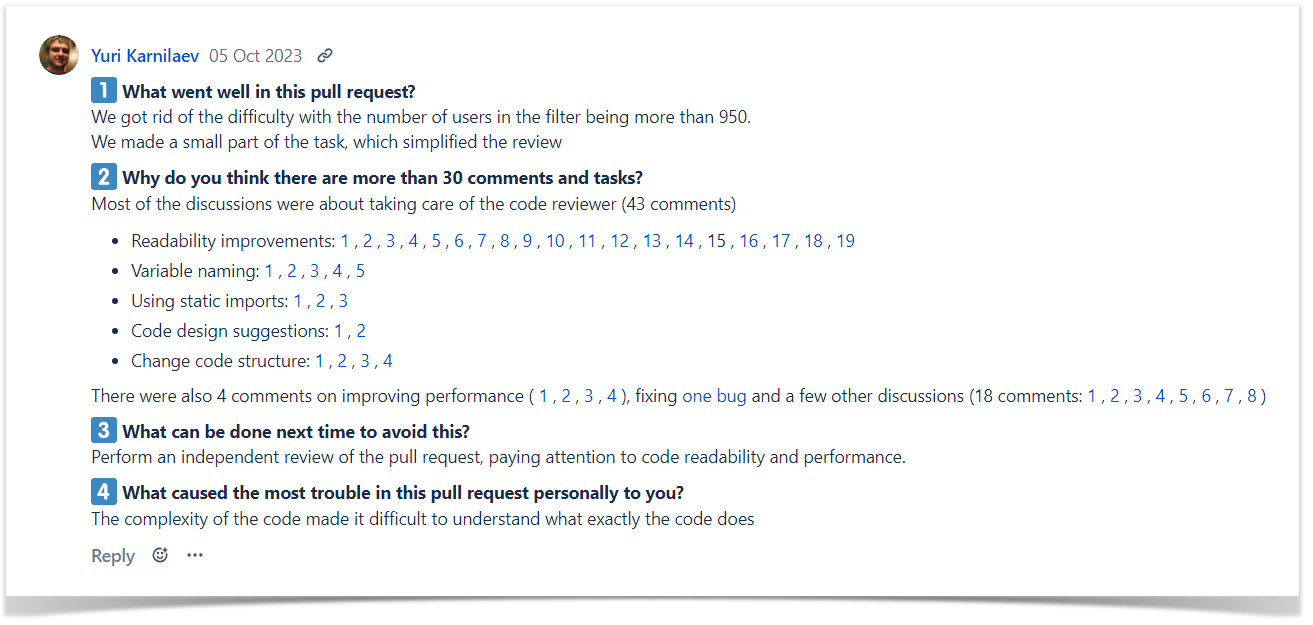
We do not limit the number of review rounds but track the number of activities in each pull request, as many comments might indicate some issues in the workflow. To perform this, we have an internal app for Bitbucket, which counts comments and tasks left in PRs. If this number exceeds 30, this tool asks the author and the reviewers to answer four questions:
- What went well in this pull request?
- Why do you think there are more than 30 comments and tasks?
- What can be done next time to avoid this?
- What caused the most trouble in this pull request personally to you?
We review these answers every two months to reflect on the processes, find bottlenecks, and optimize the workflow.
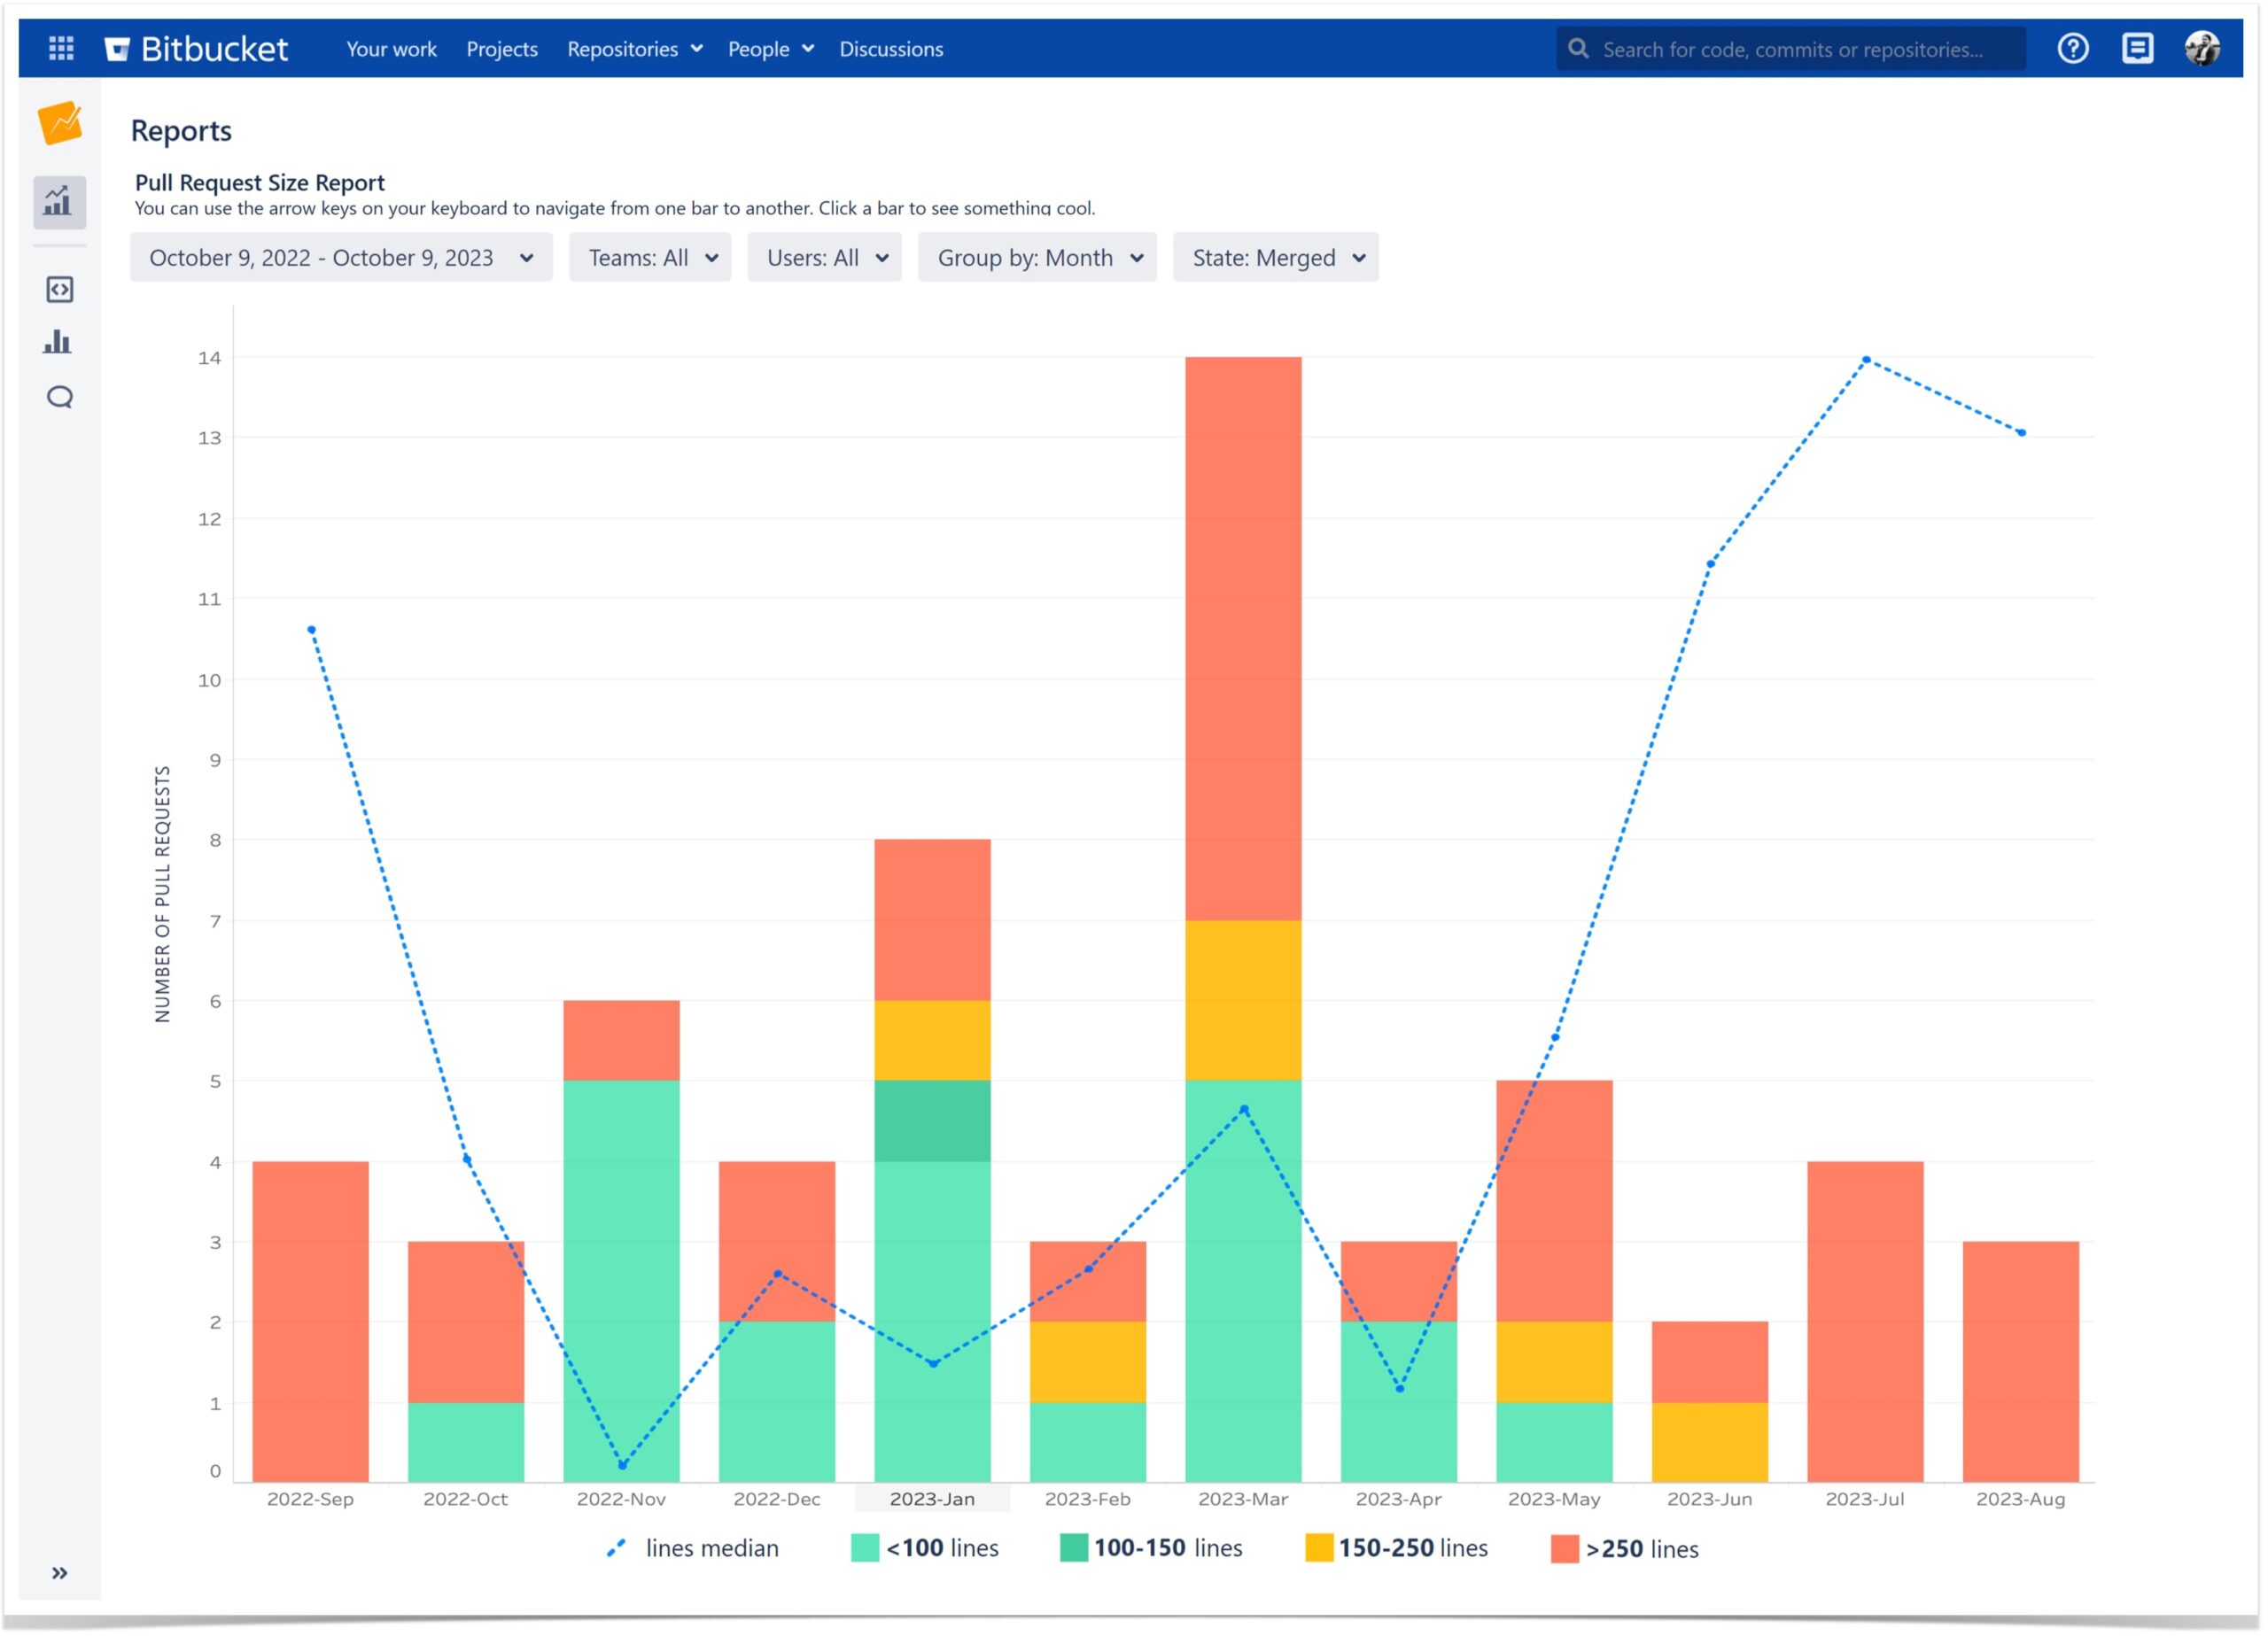
Pull Request Size
In pull requests, we look not only at the number of comments but also at their size. Our team believes that a great pull request should strike a balance between being small enough to be reviewed quickly by teammates and comprehensive enough to cover the planned changes or feature additions. That’s why an author of a pull request always strives to make it as simple and clean as possible.
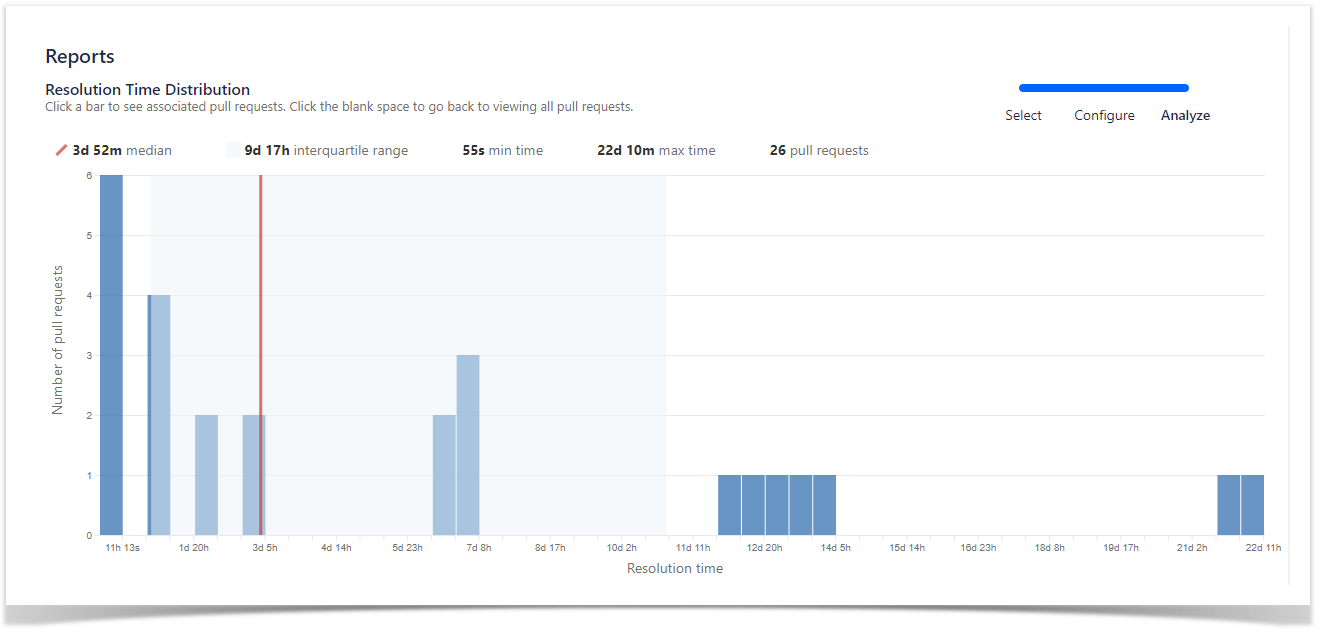
Moreover, we are considering working on a new report for the Awesome Graphs app. It will enable users to see pull request size distribution and track changes in PR size over time. This functionality is not currently available to our clients, but we’ve made its prototype using the team’s data. Pretty good, right?
If this report sparked your interest, feel free to contact us. We will be glad to share the details and hear your thoughts.
Code Refactoring
When developing a new feature, the author sometimes comes across some parts in the code that they’d like to rewrite and update. This is inevitable as technologies evolve, new tools emerge, and our expertise expands. However, we agreed that refactoring is permitted within the scope of a pull request only if it influences the feature we are working on. Besides, reviewers can request to create a separate pull request for changes related to refactoring or to roll back these changes in case they distract from the review of the main functionality. This is extremely useful for large-scale refactoring as the developer will work on a particular task without investing time in non-priority ones.
Refactoring unrelated to the current feature is postponed or scheduled for R&D Day.
Every Friday, instead of working on regular tasks, we focus on enhancing the Developer Experience (DX) and exploring new tools to streamline and improve our processes. Here also come tasks related to refactoring and technical debt.
Tools for Code Review in Bitbucket
We’ve already mentioned some of these tools, but let’s put them together.
Submodule Changes for Bitbucket – a tool that helps review the changes made to Git submodules in the Diff tab in Bitbucket. We use it for two primary purposes:
- To review changes in the submodule as if they are a part of the parental repository. We can leave comments and tasks on the submodule’s code within the code review process of the parental repository.
- To check a new merge to ensure that the submodule commit can be merged to the dev branch in fast-forward mode.
SonarQube – a tool for static code analysis and calculating the percentage of code covered by tests. It helps us analyze the code of a single pull request. We have installed the Include Code Quality for Bitbucket plugin, which displays the SonarQube code quality check results within the pull request. It prevents us from merging a pull request if the code quality does not meet our team’s standards:
- There are no errors or vulnerabilities in the new code identified by SonarQube.
- Test coverage for new code is at least 80%. This requirement encourages us to gradually increase the test coverage of the codebase, as modifying previously written code, we also write tests for it if none exist.
TeamCity Integration for Bitbucket – a tool to run TeamCity builds from Bitbucket. We use it for:
- Running tests and initiating SonarQube checks after each commit pushed to Bitbucket.
- Managing the deployment of our projects to the Atlassian Marketplace and production environments. Although this is not directly related to code review in Bitbucket, it is essential to the overall development process.
Following these code review guidelines allows us to maintain high-quality code and foster efficient collaboration, leading to better, more reliable software and a more productive development environment. Apart from this, we always leave room for improvement and discuss the processes every two months to make the development of our products even more robust and effective.