Why to Use DORA Metrics in Jira and Bitbucket

It’s good when business decisions are based on facts, but it’s even better when these facts are expressed in numbers and can be compared with each other. The same applies to software delivery performance. This area is undergoing a great deal of interest in order to identify universal metrics to measure engineering processes. DORA metrics are considered to be among them. In this article, we’ll explain what DORA metrics are, how they contribute to a company’s success and how to measure them in Bitbucket.
What are DORA Metrics?
DORA metrics are a set of indicators that help companies measure the quality of software development and speed of delivery processes. They were identified by the DevOps Research and Assessment (DORA) group based on several years of studies into the DevOps practices of 30k+ engineering professionals.
DevOps Research and Assessment is an American research firm focused on digital transformation founded in 2015 and acquired by Google in 2019, known for its annual State of DevOps reports on business technology transformation.
DORA metrics are primarily used to gauge:
- Throughput
- Deployment frequency – How often code is deployed
- Lead time for changes – How long it takes for a commit to get into production
- Stability
- Change failure rate – Percentage of changes that led to problems in production
- Time to restore service – How long it takes to recover service after an incident
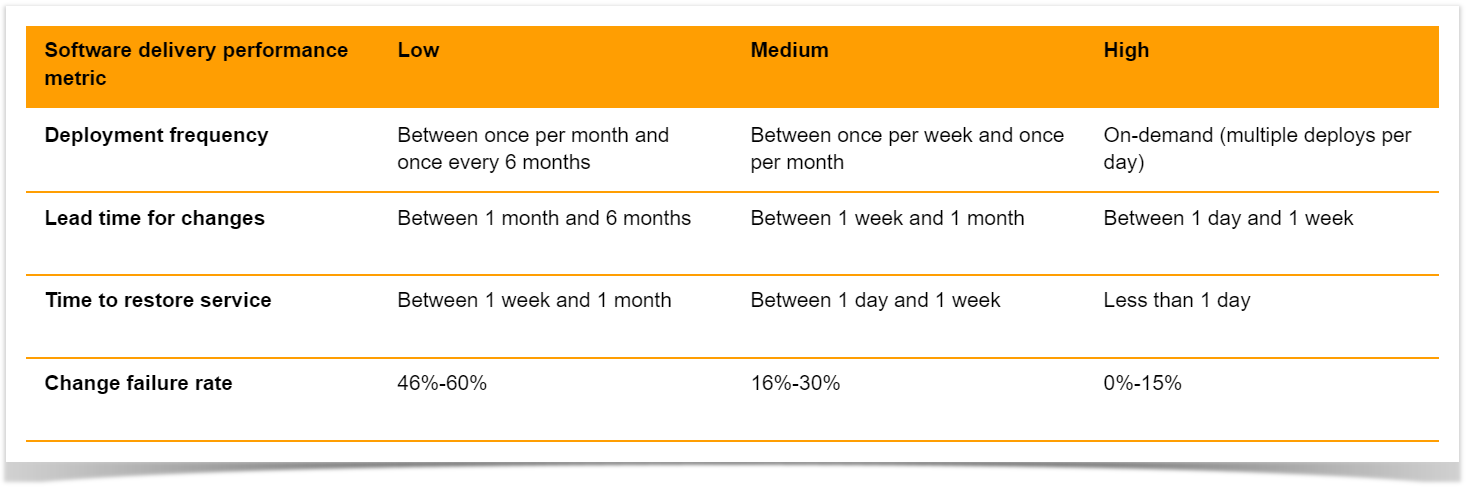
Based on how teams rank in each category, they are added to elite*, high, medium, or low clusters.

*This year an elite cluster was omitted as the highest-performing cluster doesn’t demonstrate enough of the characteristics of last year’s elite cluster.
In addition to software delivery performance indicators, the group recently added the fifth key metric – reliability. It is used to measure operational performance and illustrates how well services meet users’ needs, such as availability and performance.
Let’s have a closer look at the four software delivery performance metrics.
Deployment frequency
This metric indicates how often code is delivered to production or released to end users. According to DORA, the higher the deployment frequency, the better, as it involves more minor changes and minimizes release risks. In addition, it allows you to deliver value to customers faster and get feedback quicker.
But the deployment frequency depends on the type of system. While web apps are typically delivered multiple times a day, this frequency isn’t appropriate for game developers with multi-gigabyte releases. In this case, the frequency of deployment to pre-production environments can be measured.
Lead Time for Changes
Lead time for changes also refers to the speed of development and indicates the time taken to deliver a commit into production. Using it, engineering managers can understand how efficient their teams’ cycle time is, how quickly changes are implemented and how well peaks in demand can be handled. Moreover, a long lead time for changes means that product updates are not delivered to users regularly enough. Therefore the advantage of quick feedback for further improvements cannot be taken.
Change Failure Rate
The change failure rate refers to code quality and measures the percentage of deployments that led to failures in production requiring remediation (e.g., a hotfix, rollback, fix forward, patch). Here is compared the number of post-deployment failures to the number of changes made.
A low change failure rate confirms the quality of the pipeline and indicates that the previous stages have successfully identified the majority of defects before deployments.
Time to Restore Service
This metric also shows the quality of software development and refers to the time taken to restore service after such incidents as an unplanned outage or service impairment. No matter how hard your team tries, the chance of an outage is high. So it’s crucial to organize processes to respond to emerging issues as quickly as possible.
A low time to recovery means that you efficiently identify emerging issues and can either quickly roll back to a previous version or promptly deploy a bug fix.
How to measure DORA metrics in Bitbucket?
As can be seen, DORA metrics are an effective way to understand your teams’ throughput and quality of code and make informed decisions about improving processes.
Using information from your project management systems like Jira and Bitbucket, you can calculate them manually:
- Deployment frequency – the average number of days per week or month with at least one deployment
- Lead time for changes – the average time between the first commit of a release and the deployment to production
- Change failure rate – the ratio of deployment failures to the overall number of deployments
- Time to restore service – the average time between a bug report and fix deployment
However, it’s much easier to measure metrics using Awesome Graphs for Bitbucket, which helps track and visualize your Git repositories as well as export commit and pull request data from Bitbucket to build custom reports.
Feel free to leave your email below if you would like to stay updated and be among the first to know about our new features and updates.


