Manage Tables in Confluence With Ease

If you are an accountant, statistician, or analyst, you know MS Excel from A to Z. But how will you deal with tables if your company migrates to Confluence? No worries! Keep reading this blog post to find all the answers you are looking for.
Using native Confluence tools
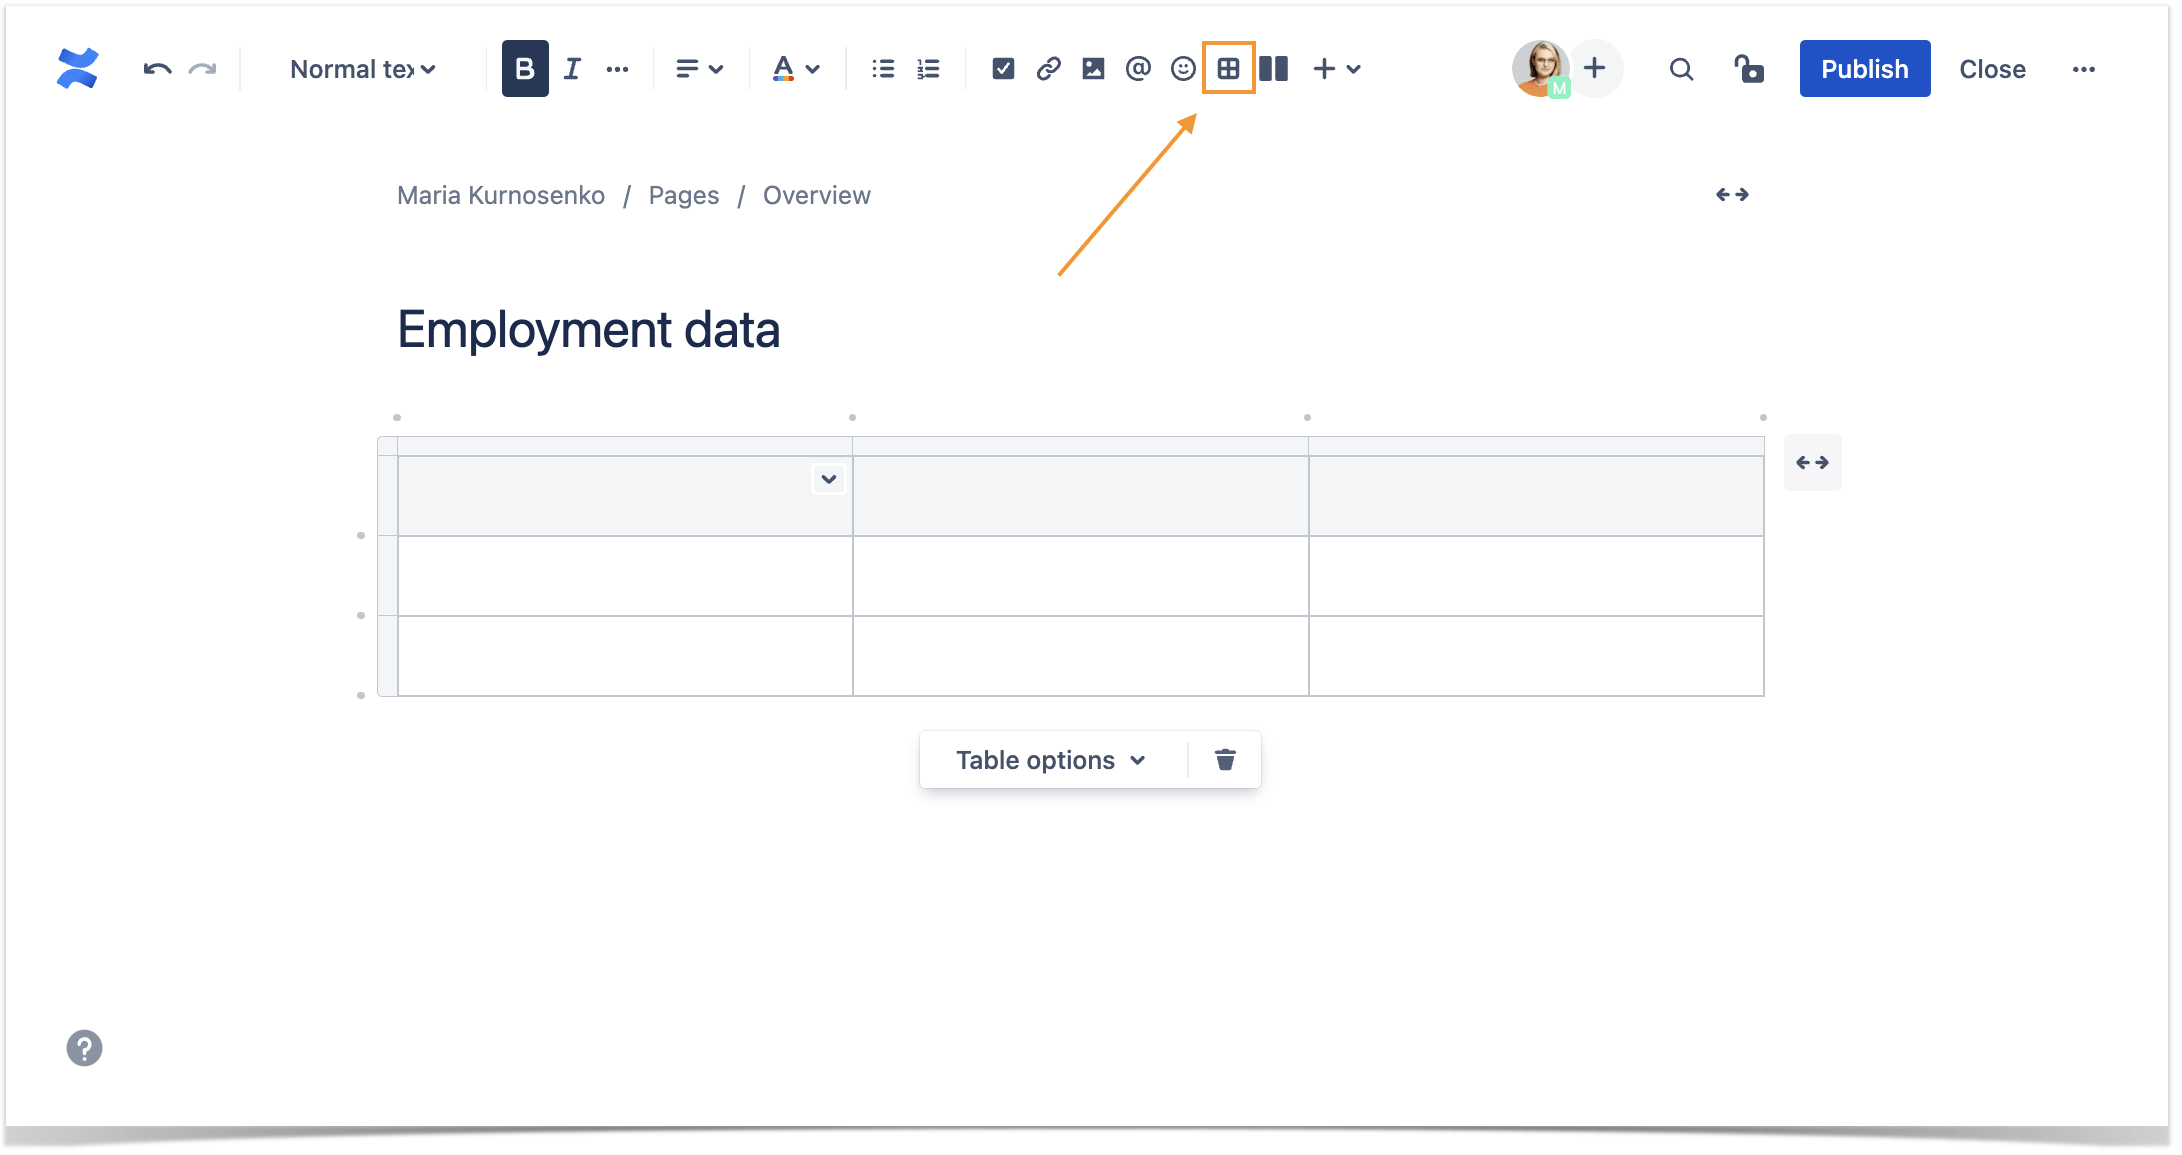
Confluence is bundled with a visual editor that allows you to insert tables similarly to MS Word.
Just click the button on the control panel to add the table. After that, you can add as many rows and columns as you need and define the table header.
These are a few options Confluence offers you for customizing your table:
- Inserting or removing a row or a column in a chosen place
- Cutting, copying, or pasting a table row
- Defining the width of the whole table and each column separately
- Merging or splitting table cells
- Setting header rows or columns
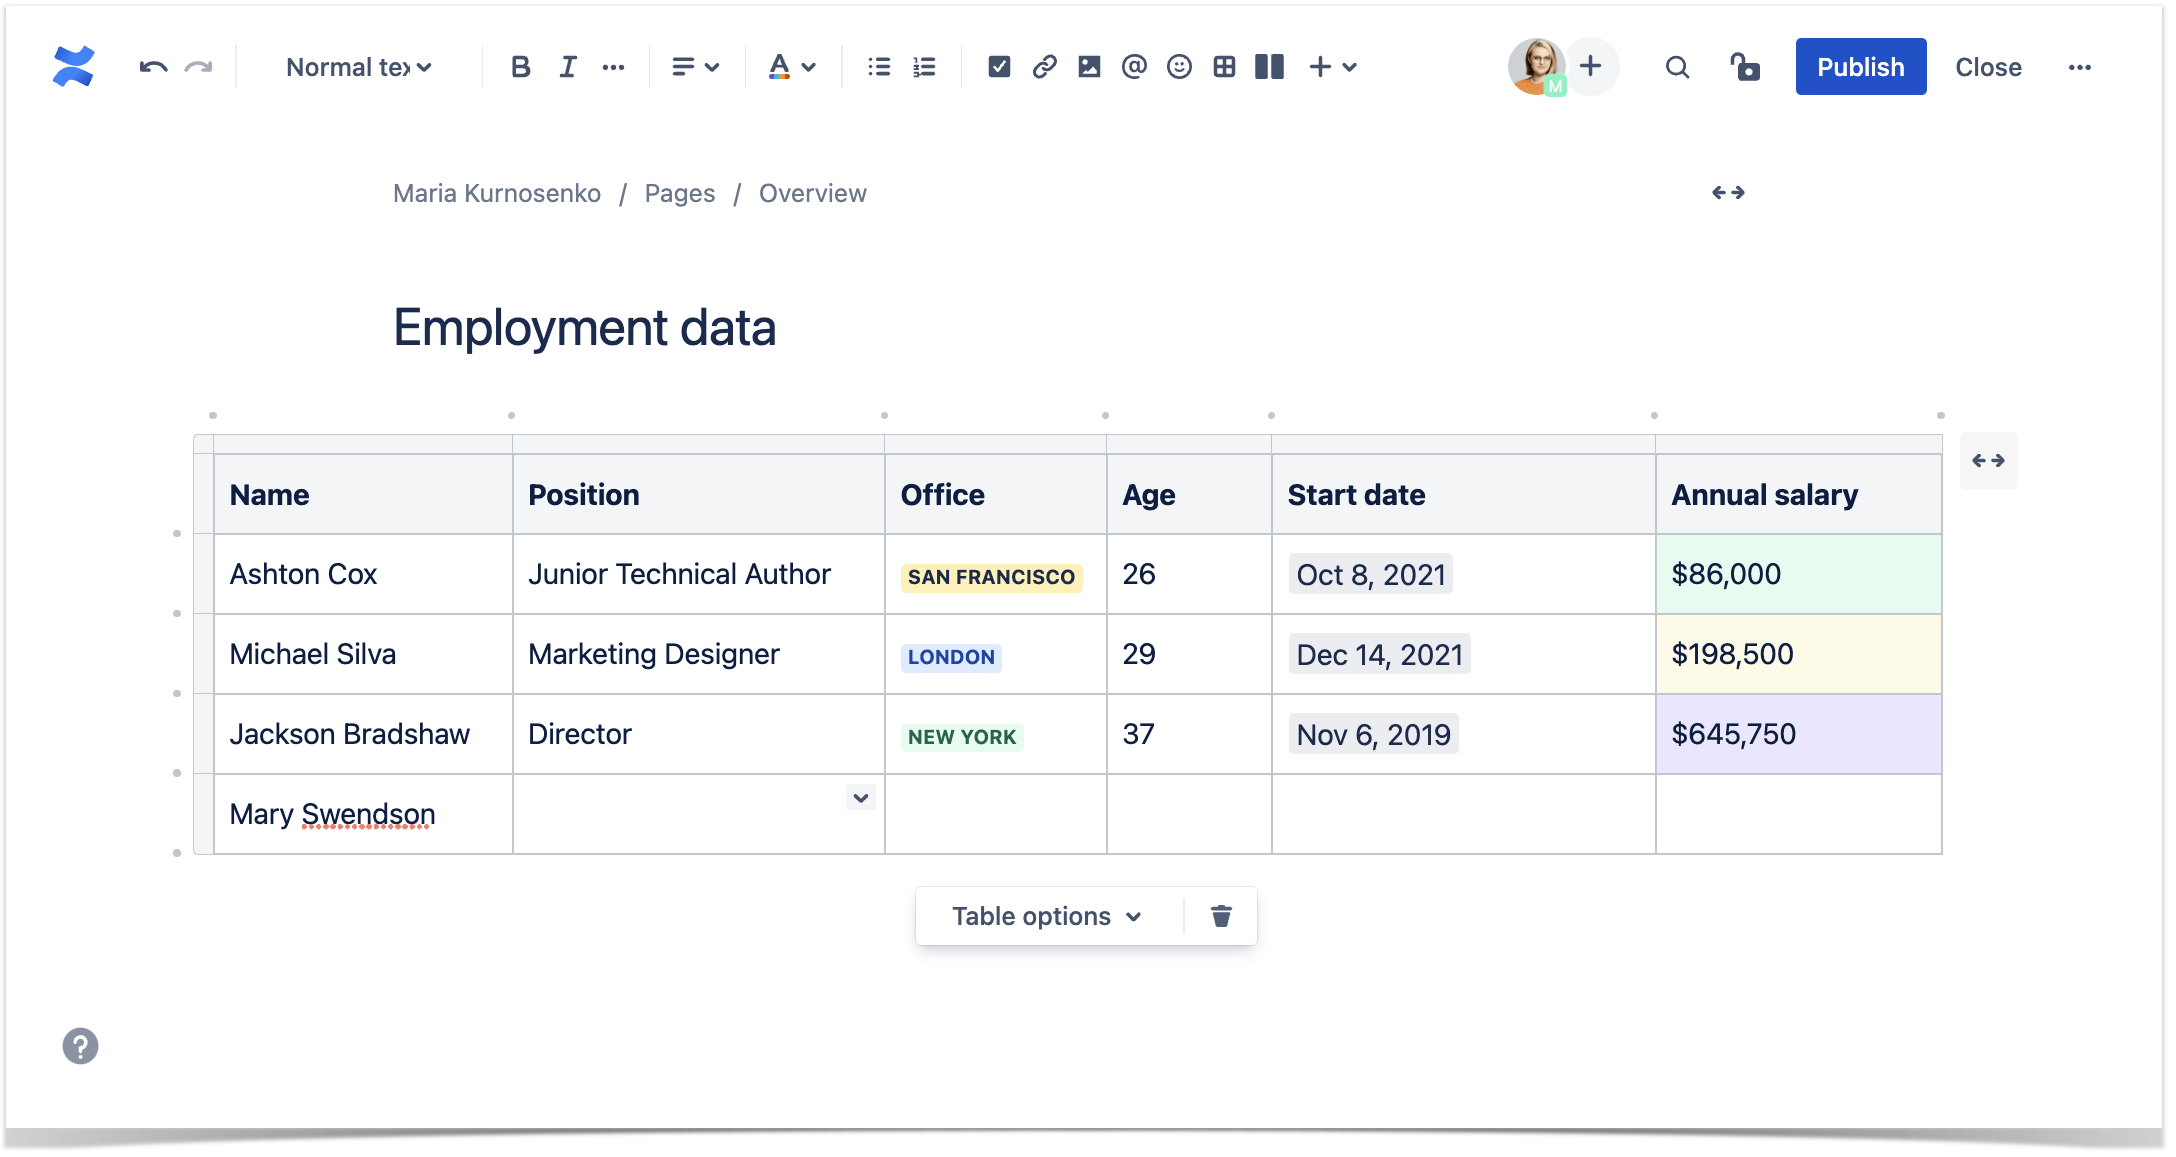
- Coloring table cells
You can also enhance the look of your table with other macros, such as dates, statuses, symbols, or emojis.
Even though Confluence offers an abundance of native features for table creation and customization, manual entry of the table is quite time-consuming, especially if it performs as an extensive database.
Let’s see what you can do to minimize your time and effort while uploading tables to Confluence.
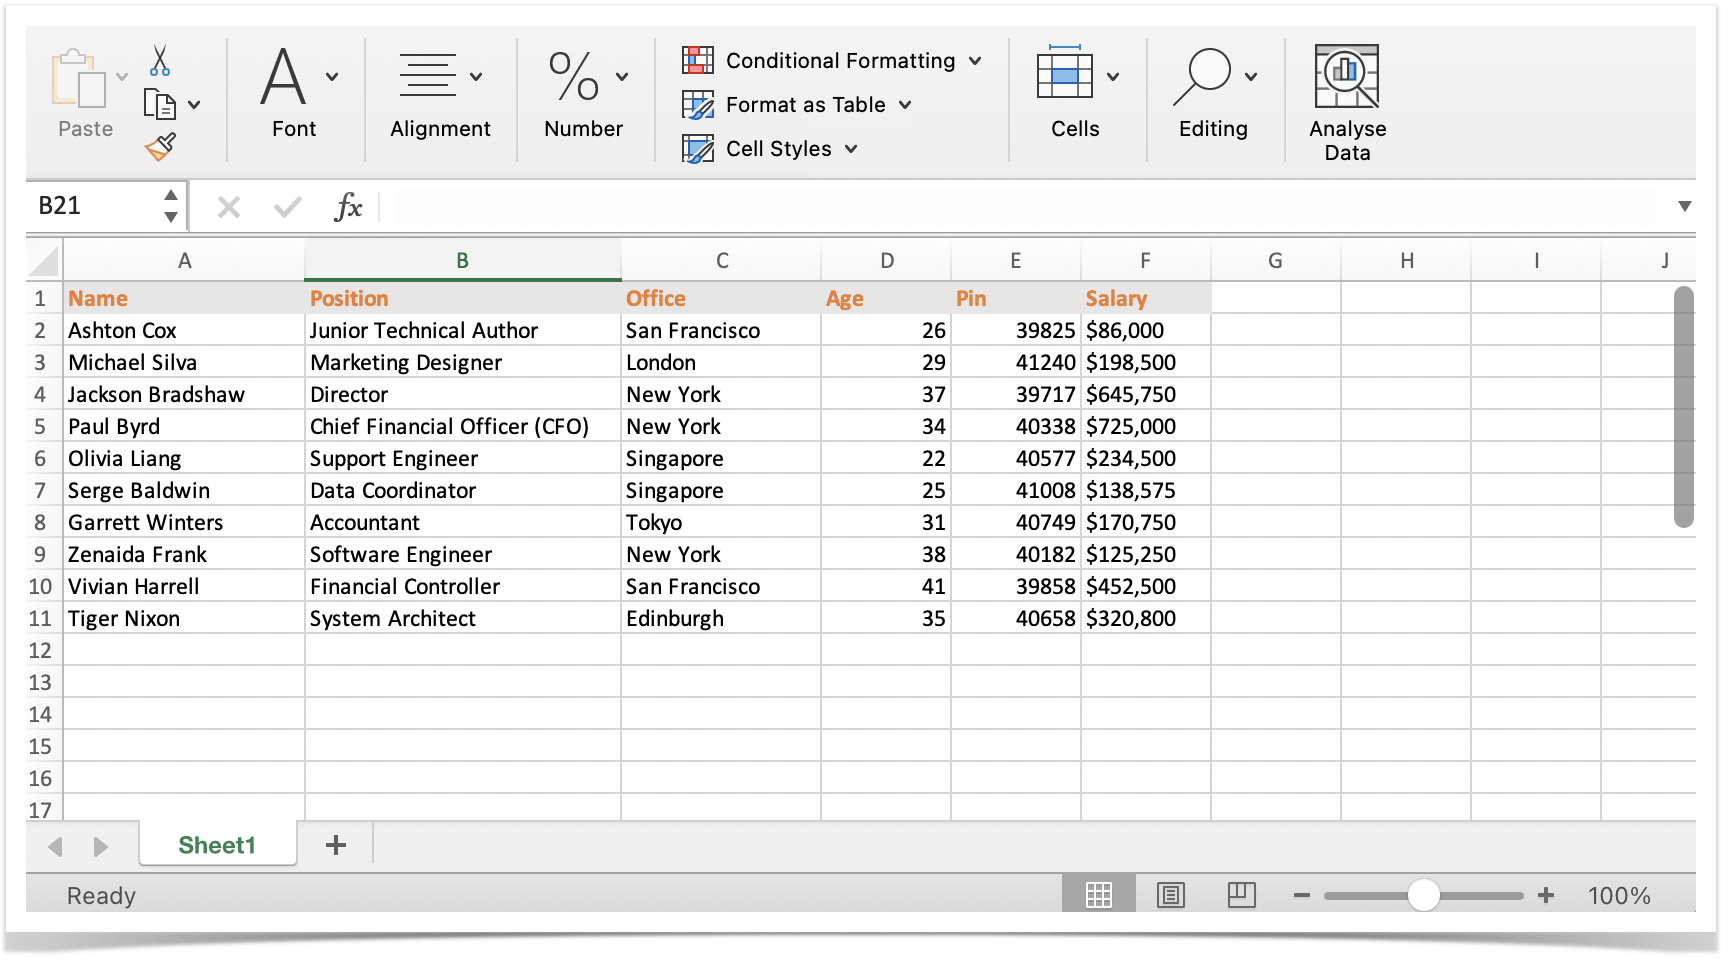
Importing from Excel
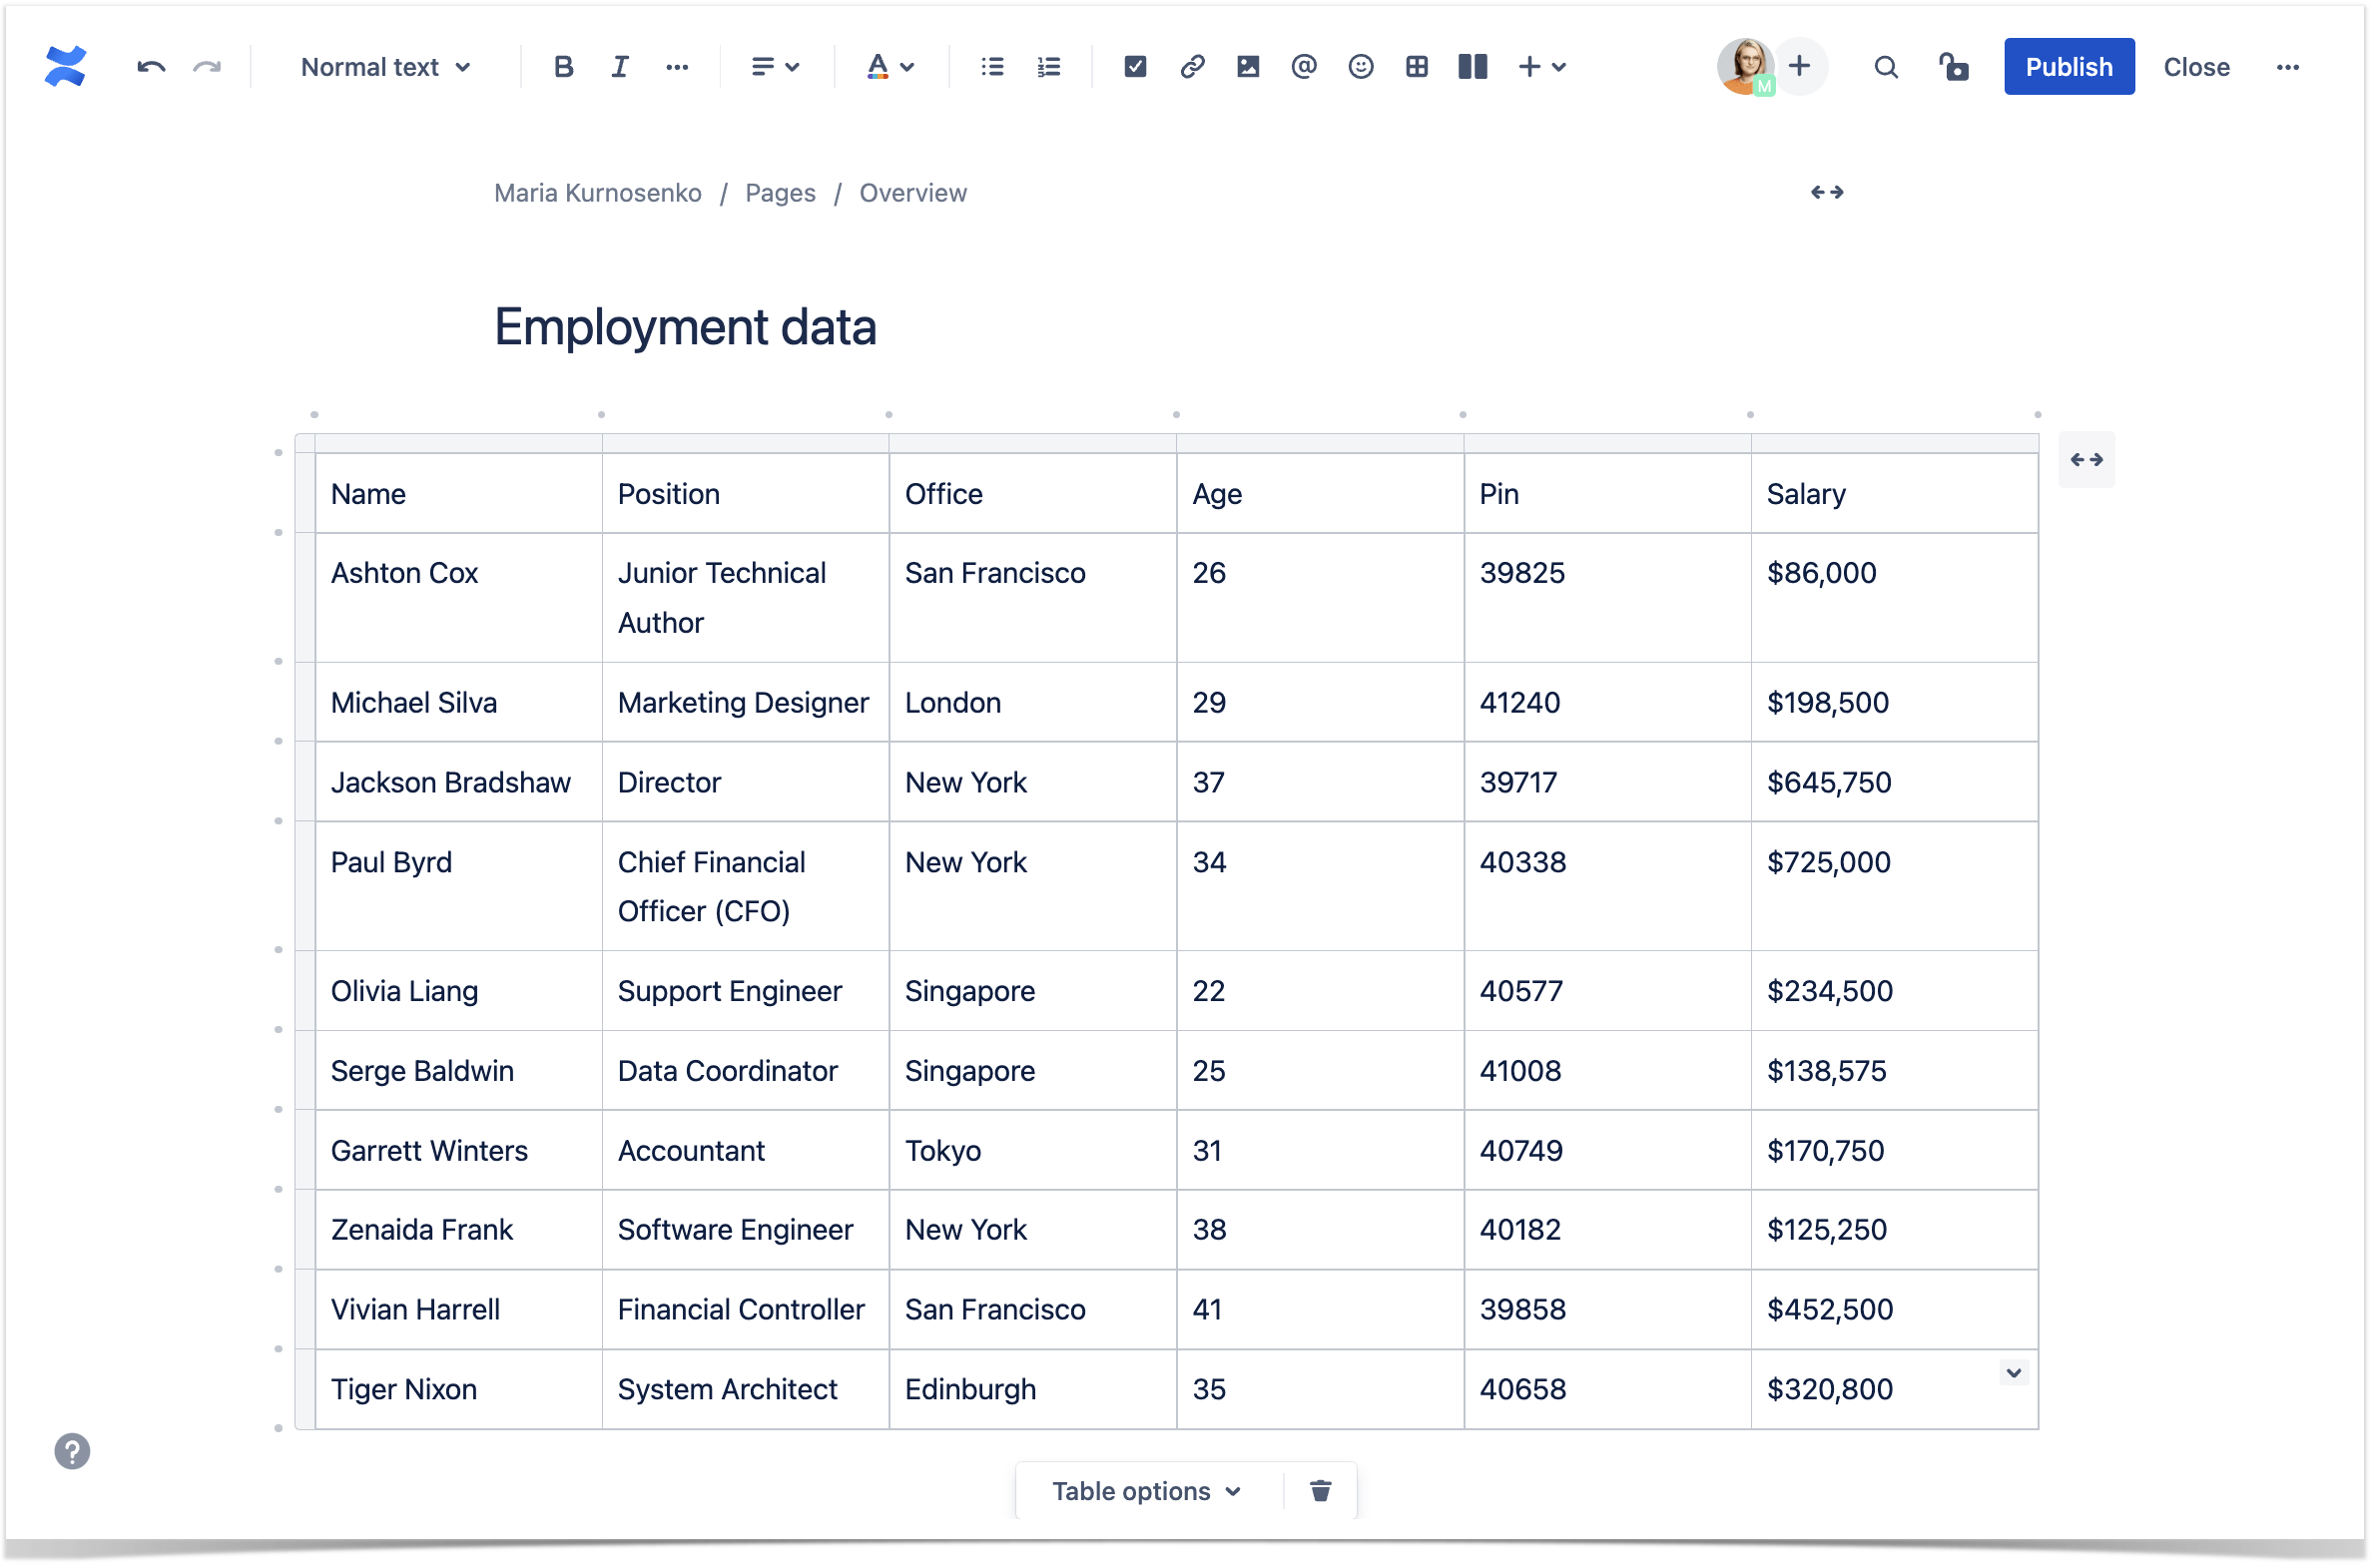
If you already have a table in MS Excel, you can copy-paste it into Confluence.
But this will reset the formatting and leave you with a plain table with data.
Importing CSV tables
Table Filter and Charts for Confluence suggests another solution for working with already existing tables.
It provides a set of macros to generate them from external sources:
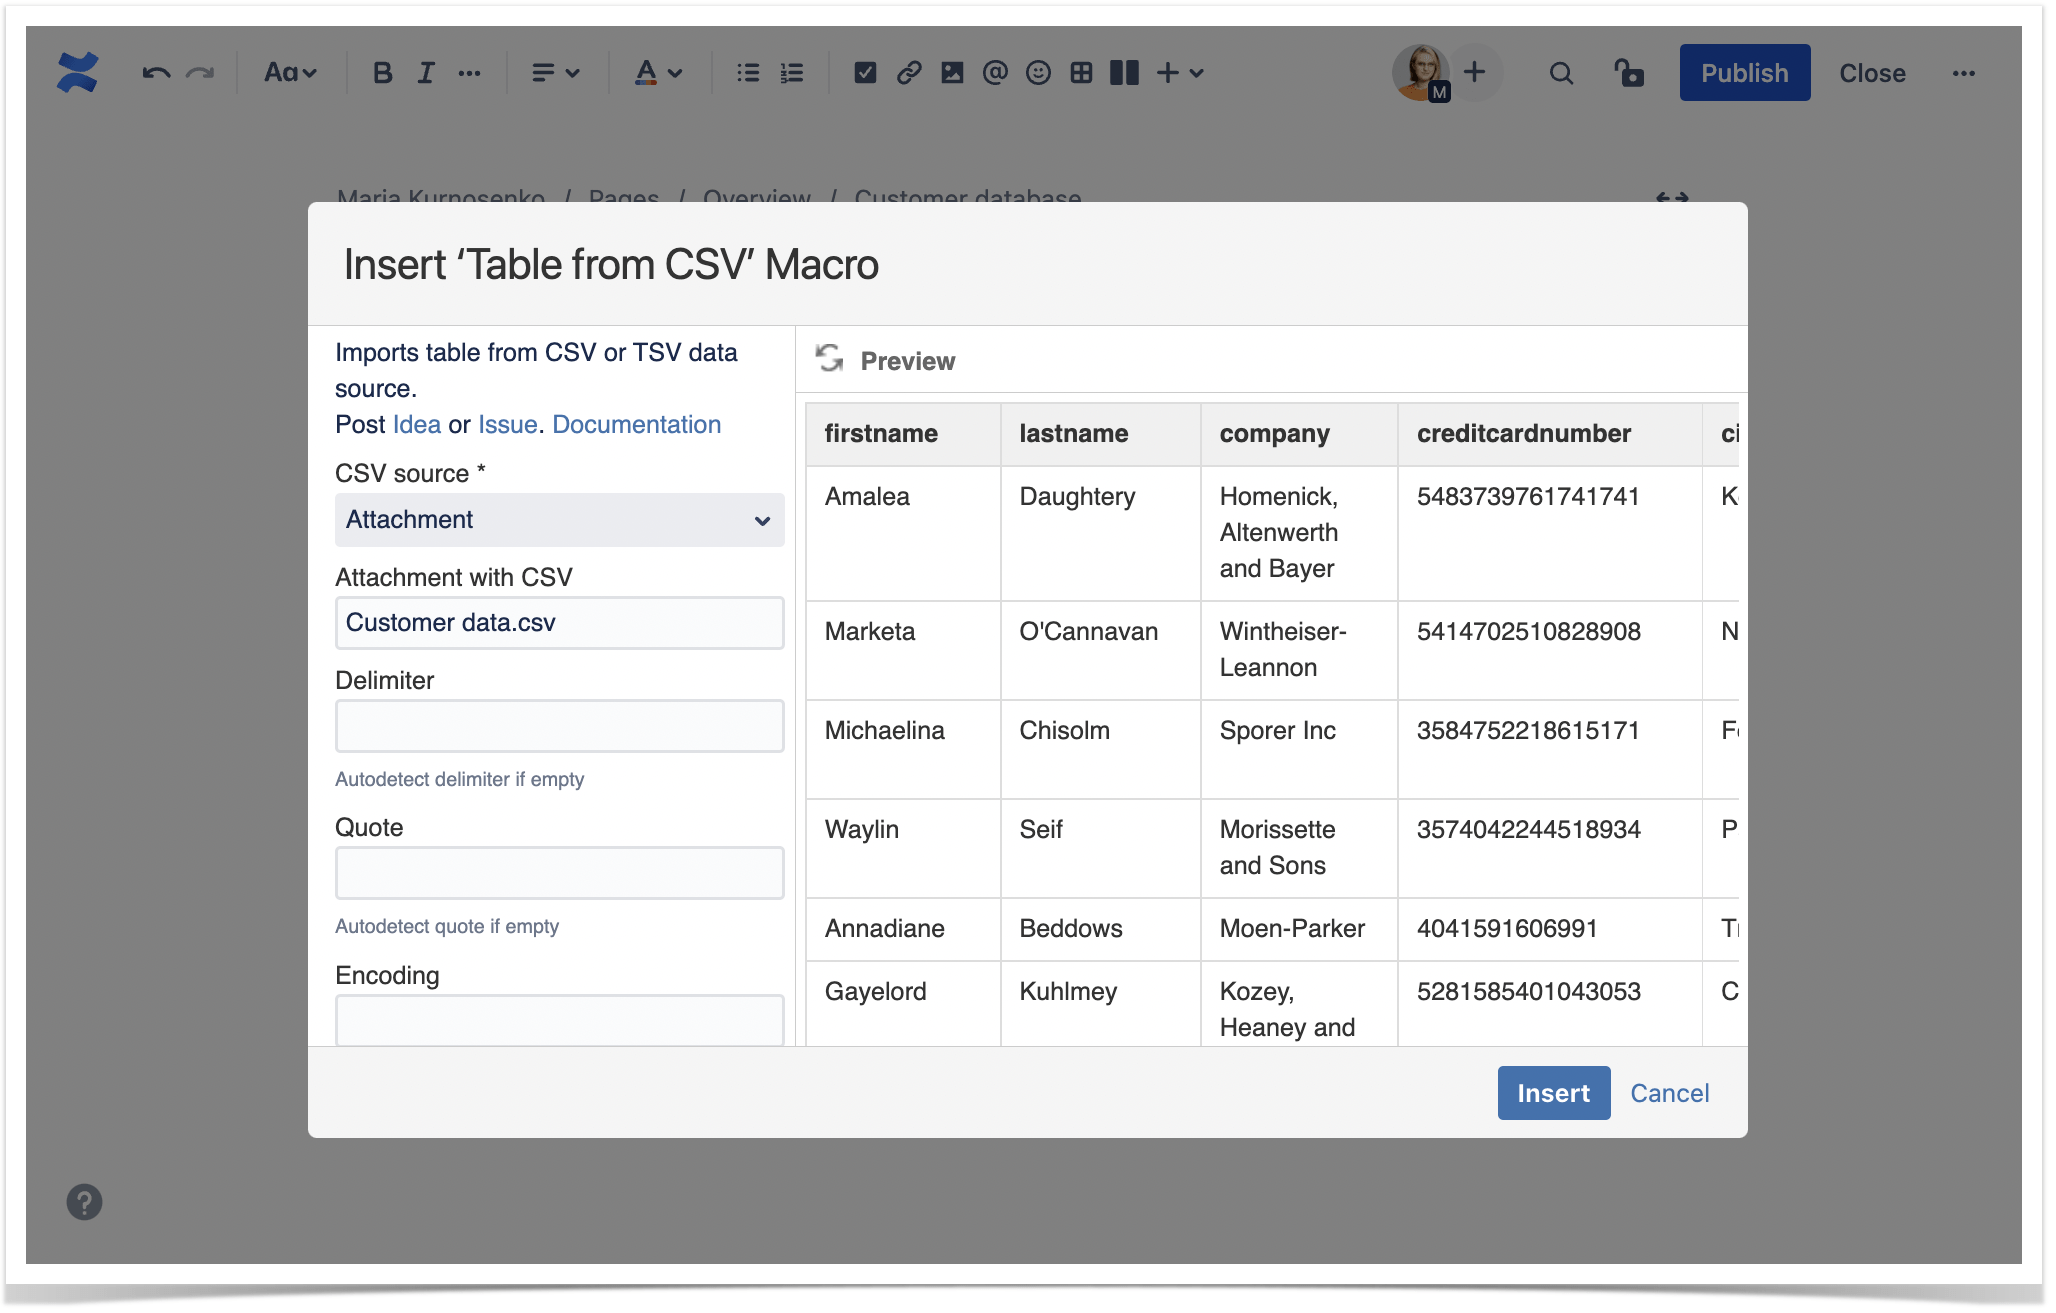
- The Table from CSV macro allows you to import, format, and display comma-separated values (CSV) data from external sources.
- The Table from JSON macro allows you to import, format, and display tables fetched from JSON strings from external sources.
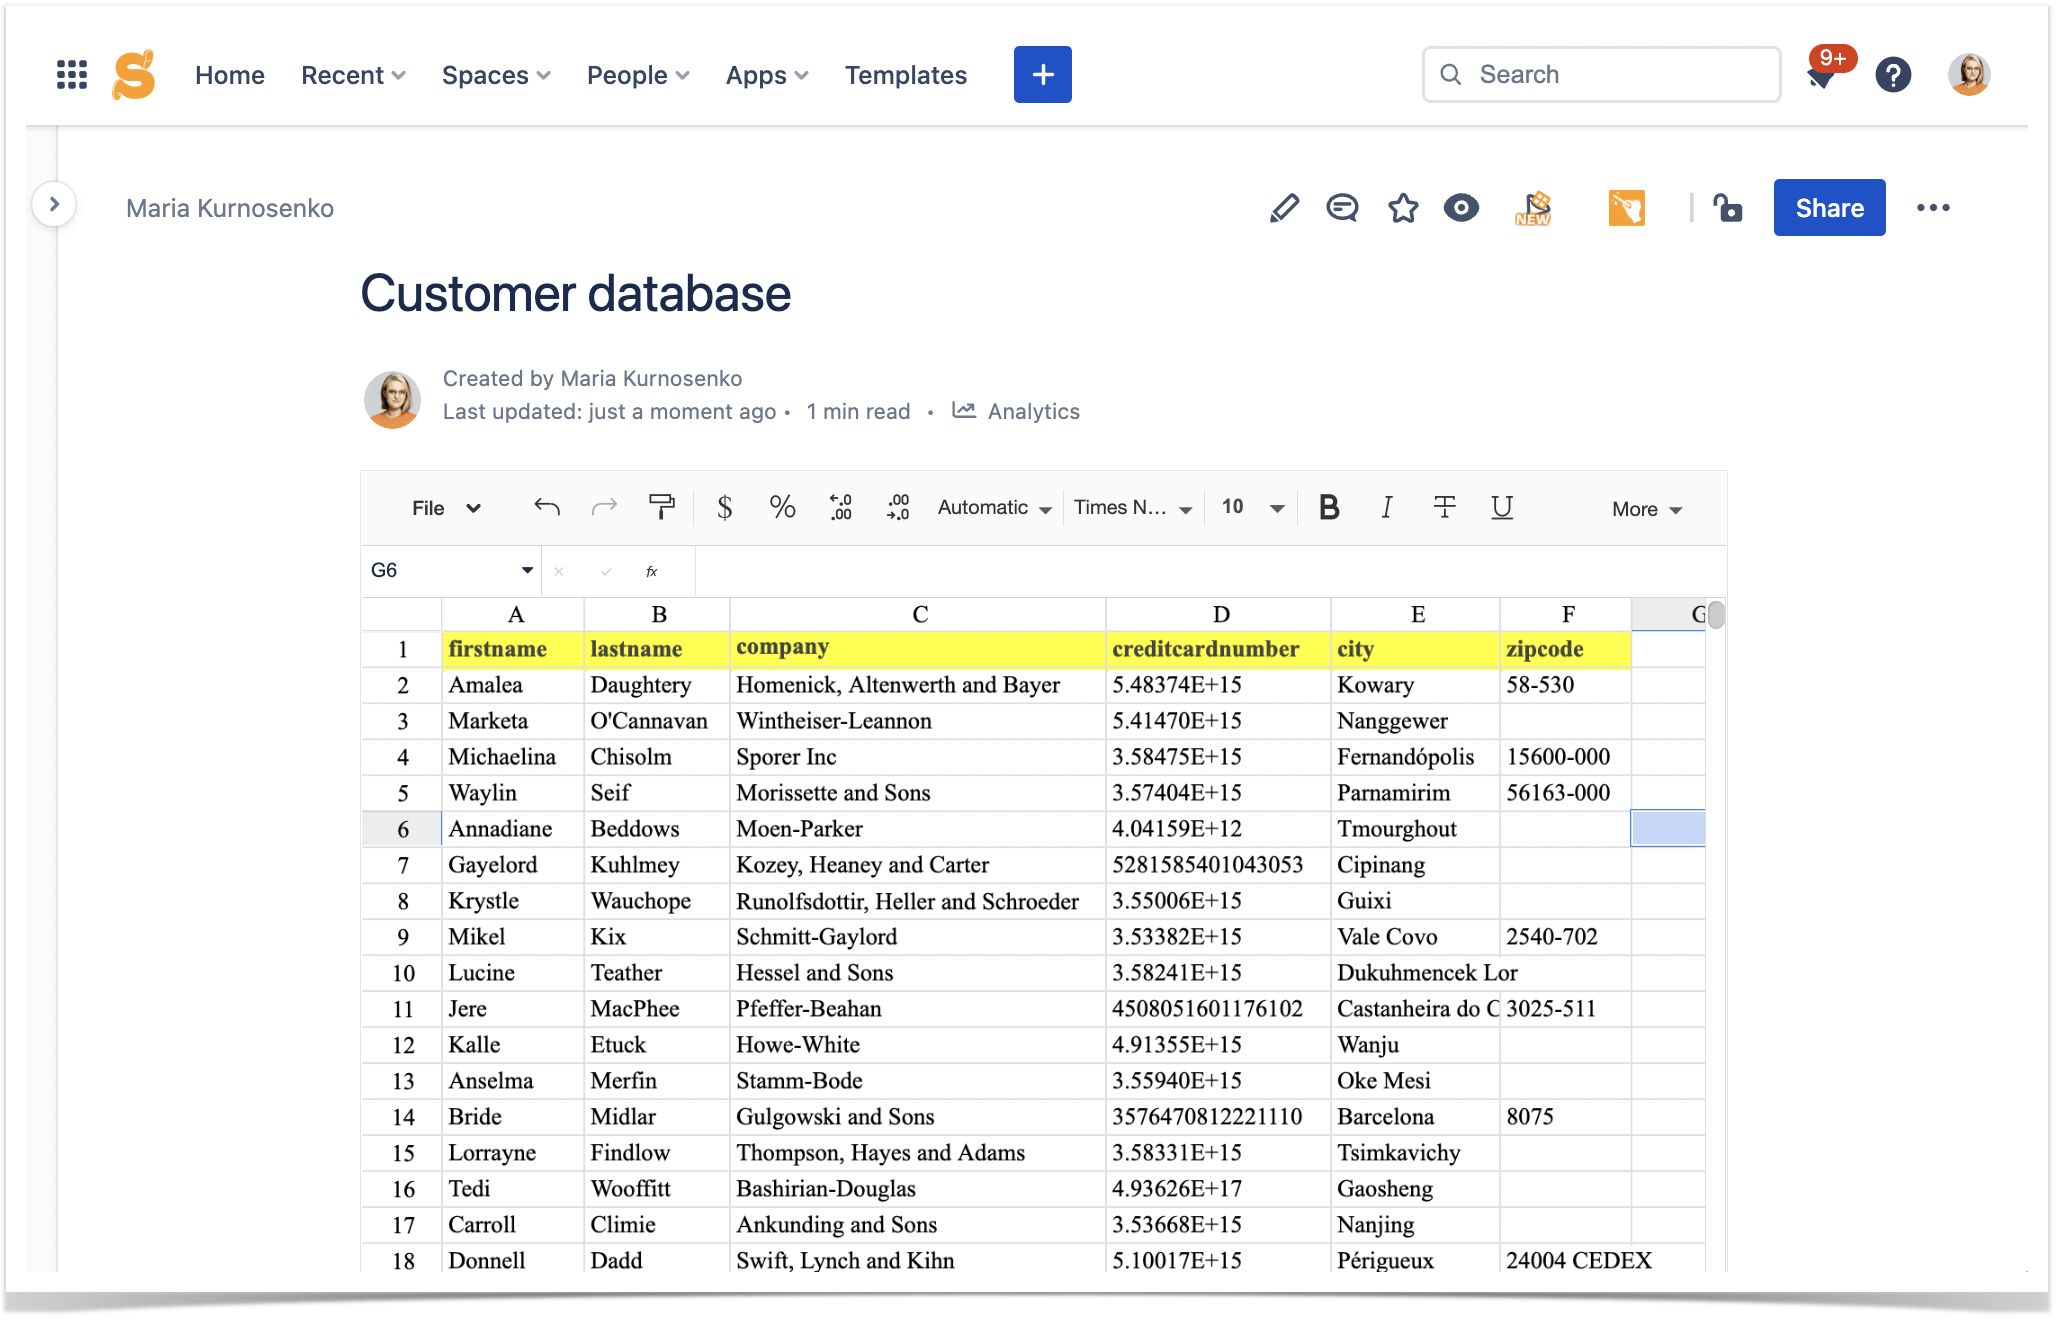
This is a convenient way to upload your MS Excel tables to Confluence. Save it as a CSV file and attach it to the appropriate Confluence page. You can work with this table in Excel and export a CSV when you need to depict it in Confluence. Each time you upload a new CSV file, all the data will be automatically updated.
Just add the Table from CSV macro on your Confluence page and set the appropriate parameters. You can select the the table’s source (attachment or URL) and choose the necessary settings for the correct table depiction, such as delimiter, encoding, or data format. You can also preview the table to see if you are getting the desired result.
Easy filtration of data in your tables
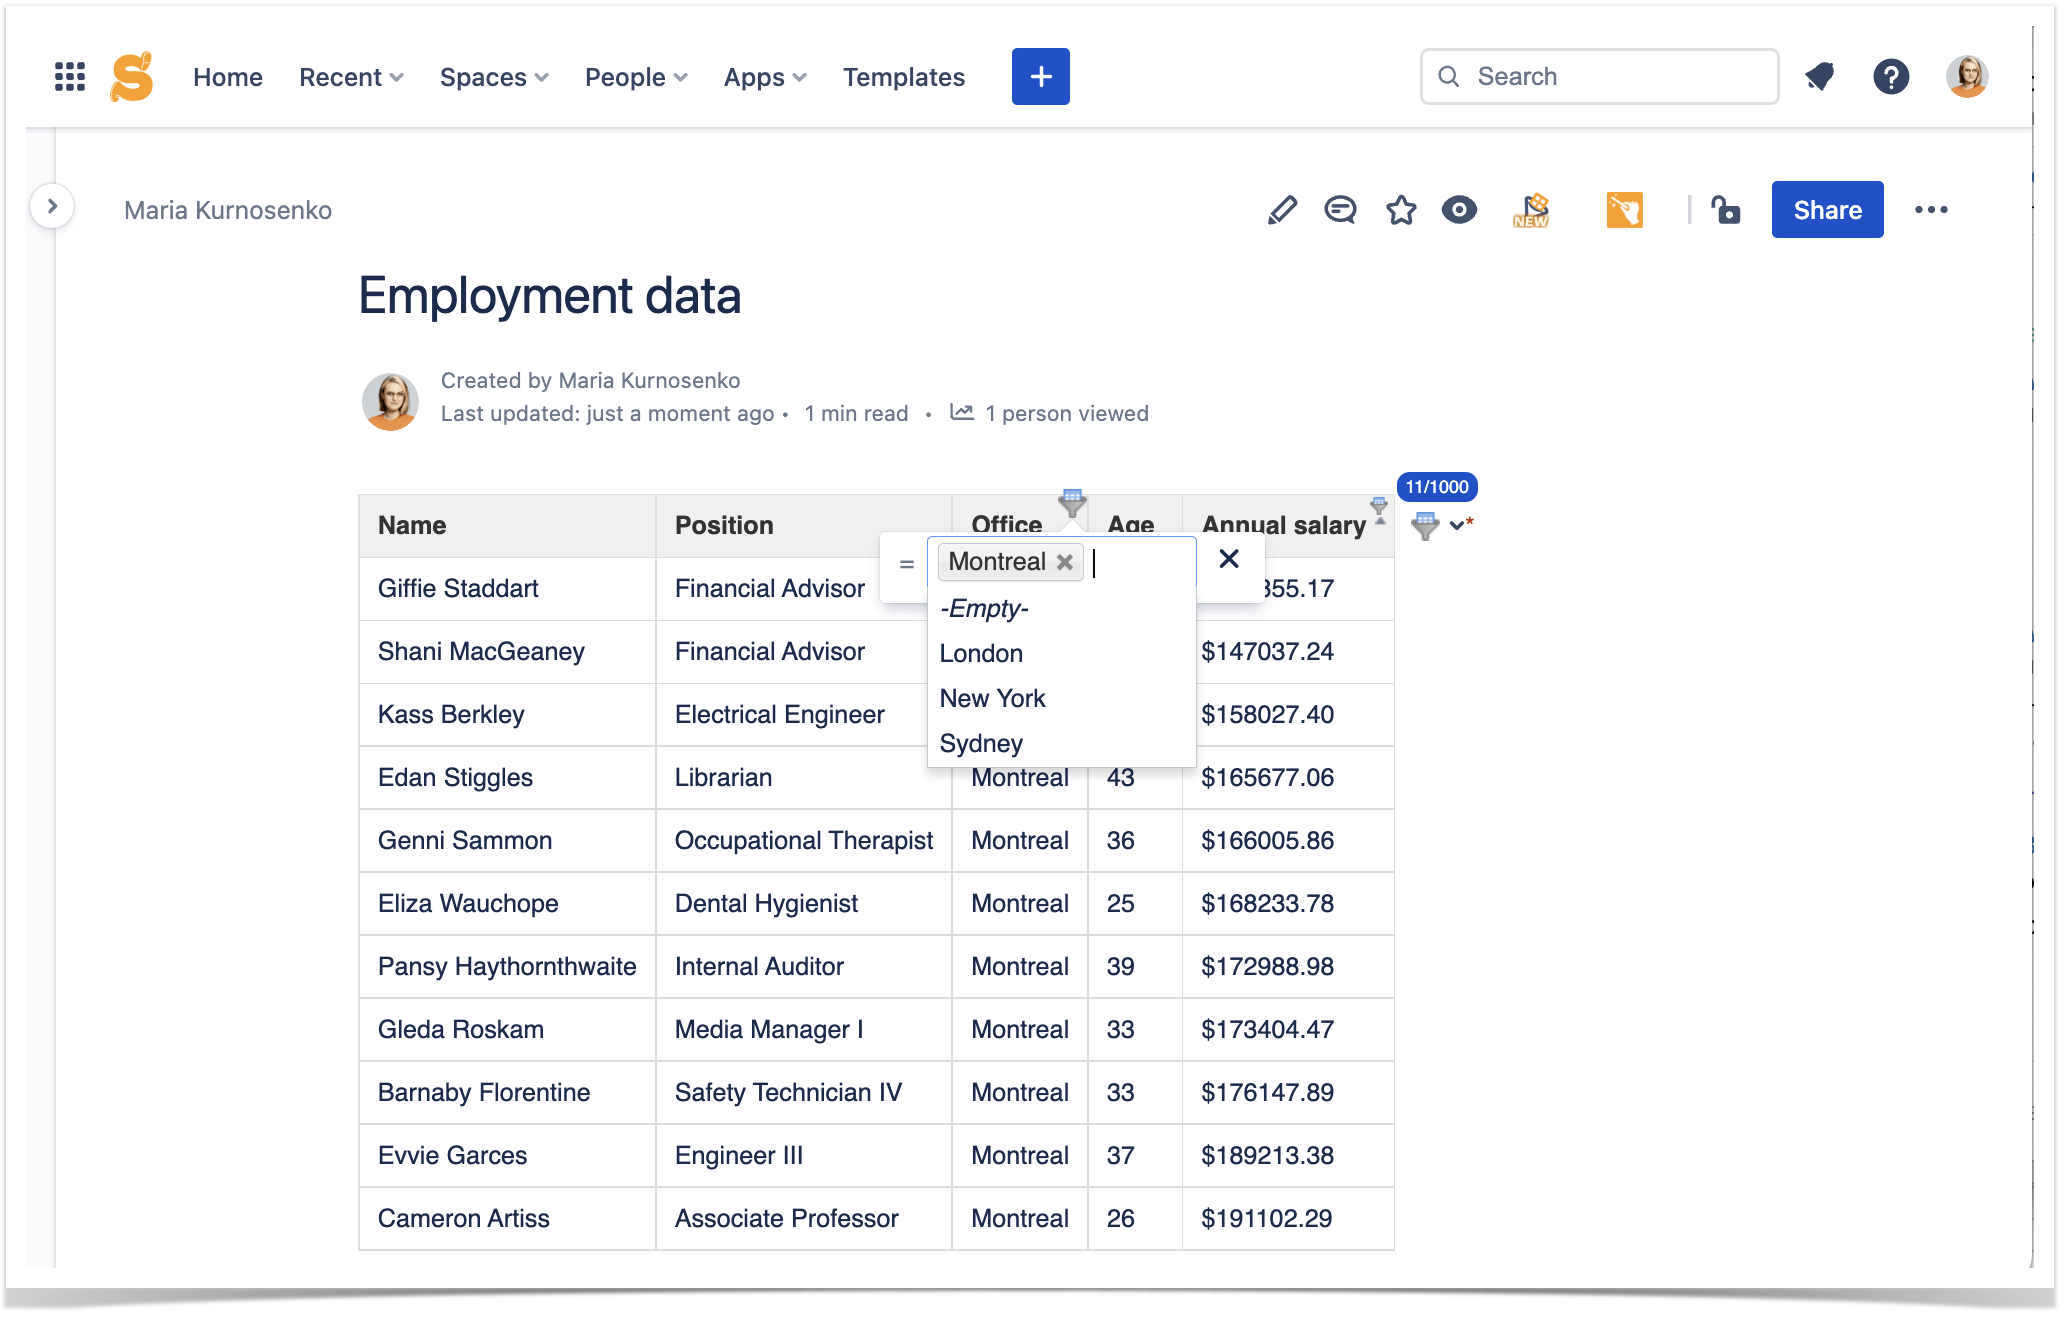
Sometimes your tables can get very large, and limiting all the information and getting a currently needed piece of data becomes challenging. In this case, you can use the Table Filter macro from Table Filter and Charts for Confluence. It allows you to filter both standard Confluence tables and tables generated by other macros. Moreover, you can do all of it on the fly right in the view mode.
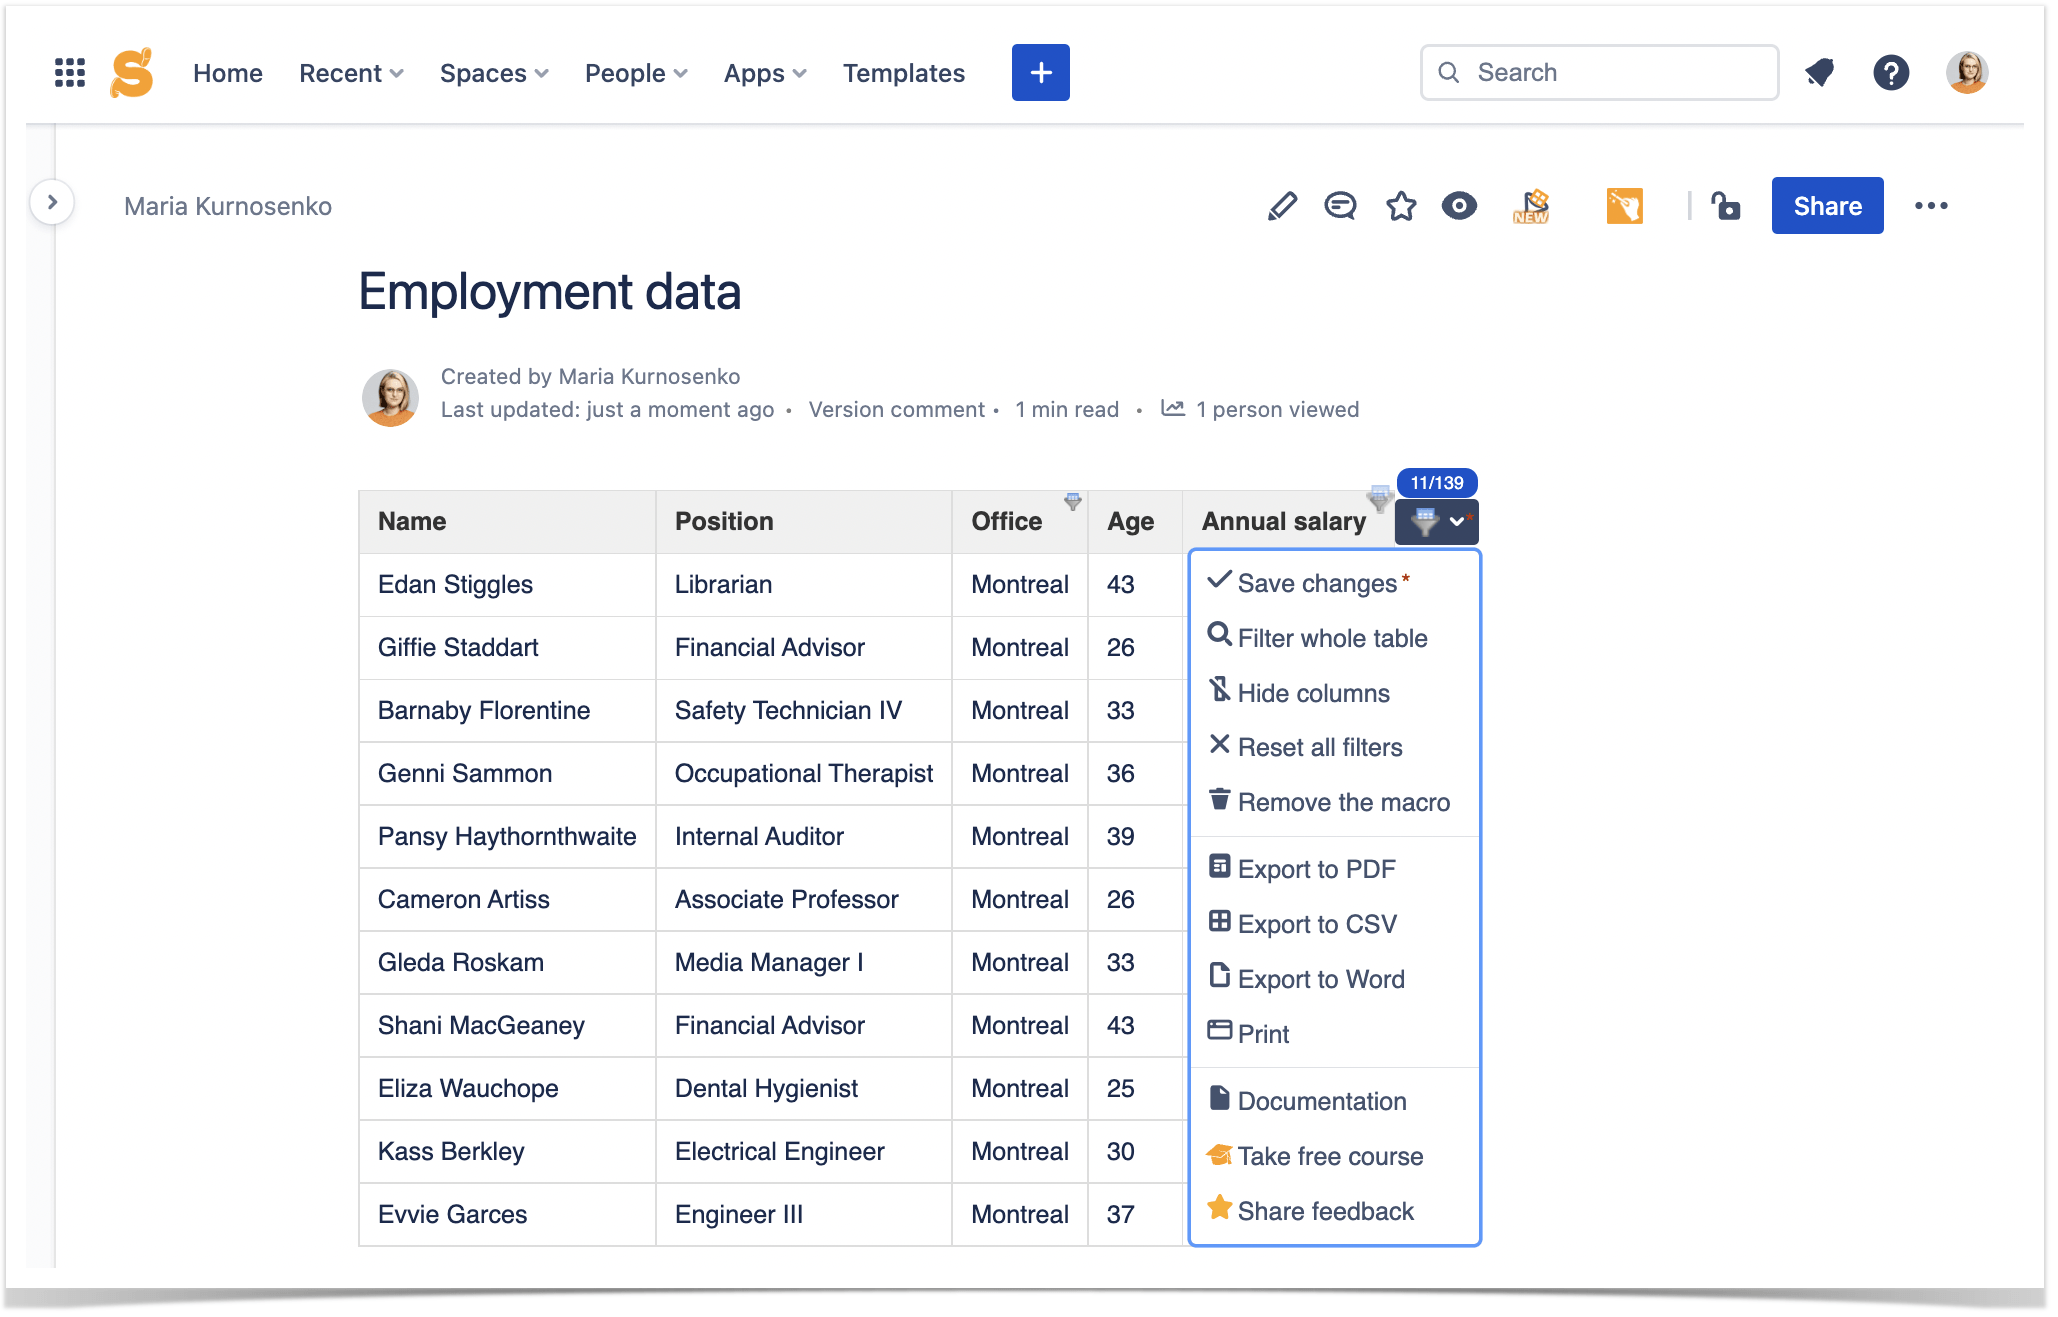
The macro automatically suggests relevant types of filters for each table column, depending on its contents. Alternatively, you can set up a global filter to search data across the entire table. Additionally, you can hide columns you are not currently using or save the filtered table as a file of a chosen format to share outside Confluence. After you finish filtering the table, the app will highlight the Save changes button with a red asterisk, reminding you to save the table in its final form.
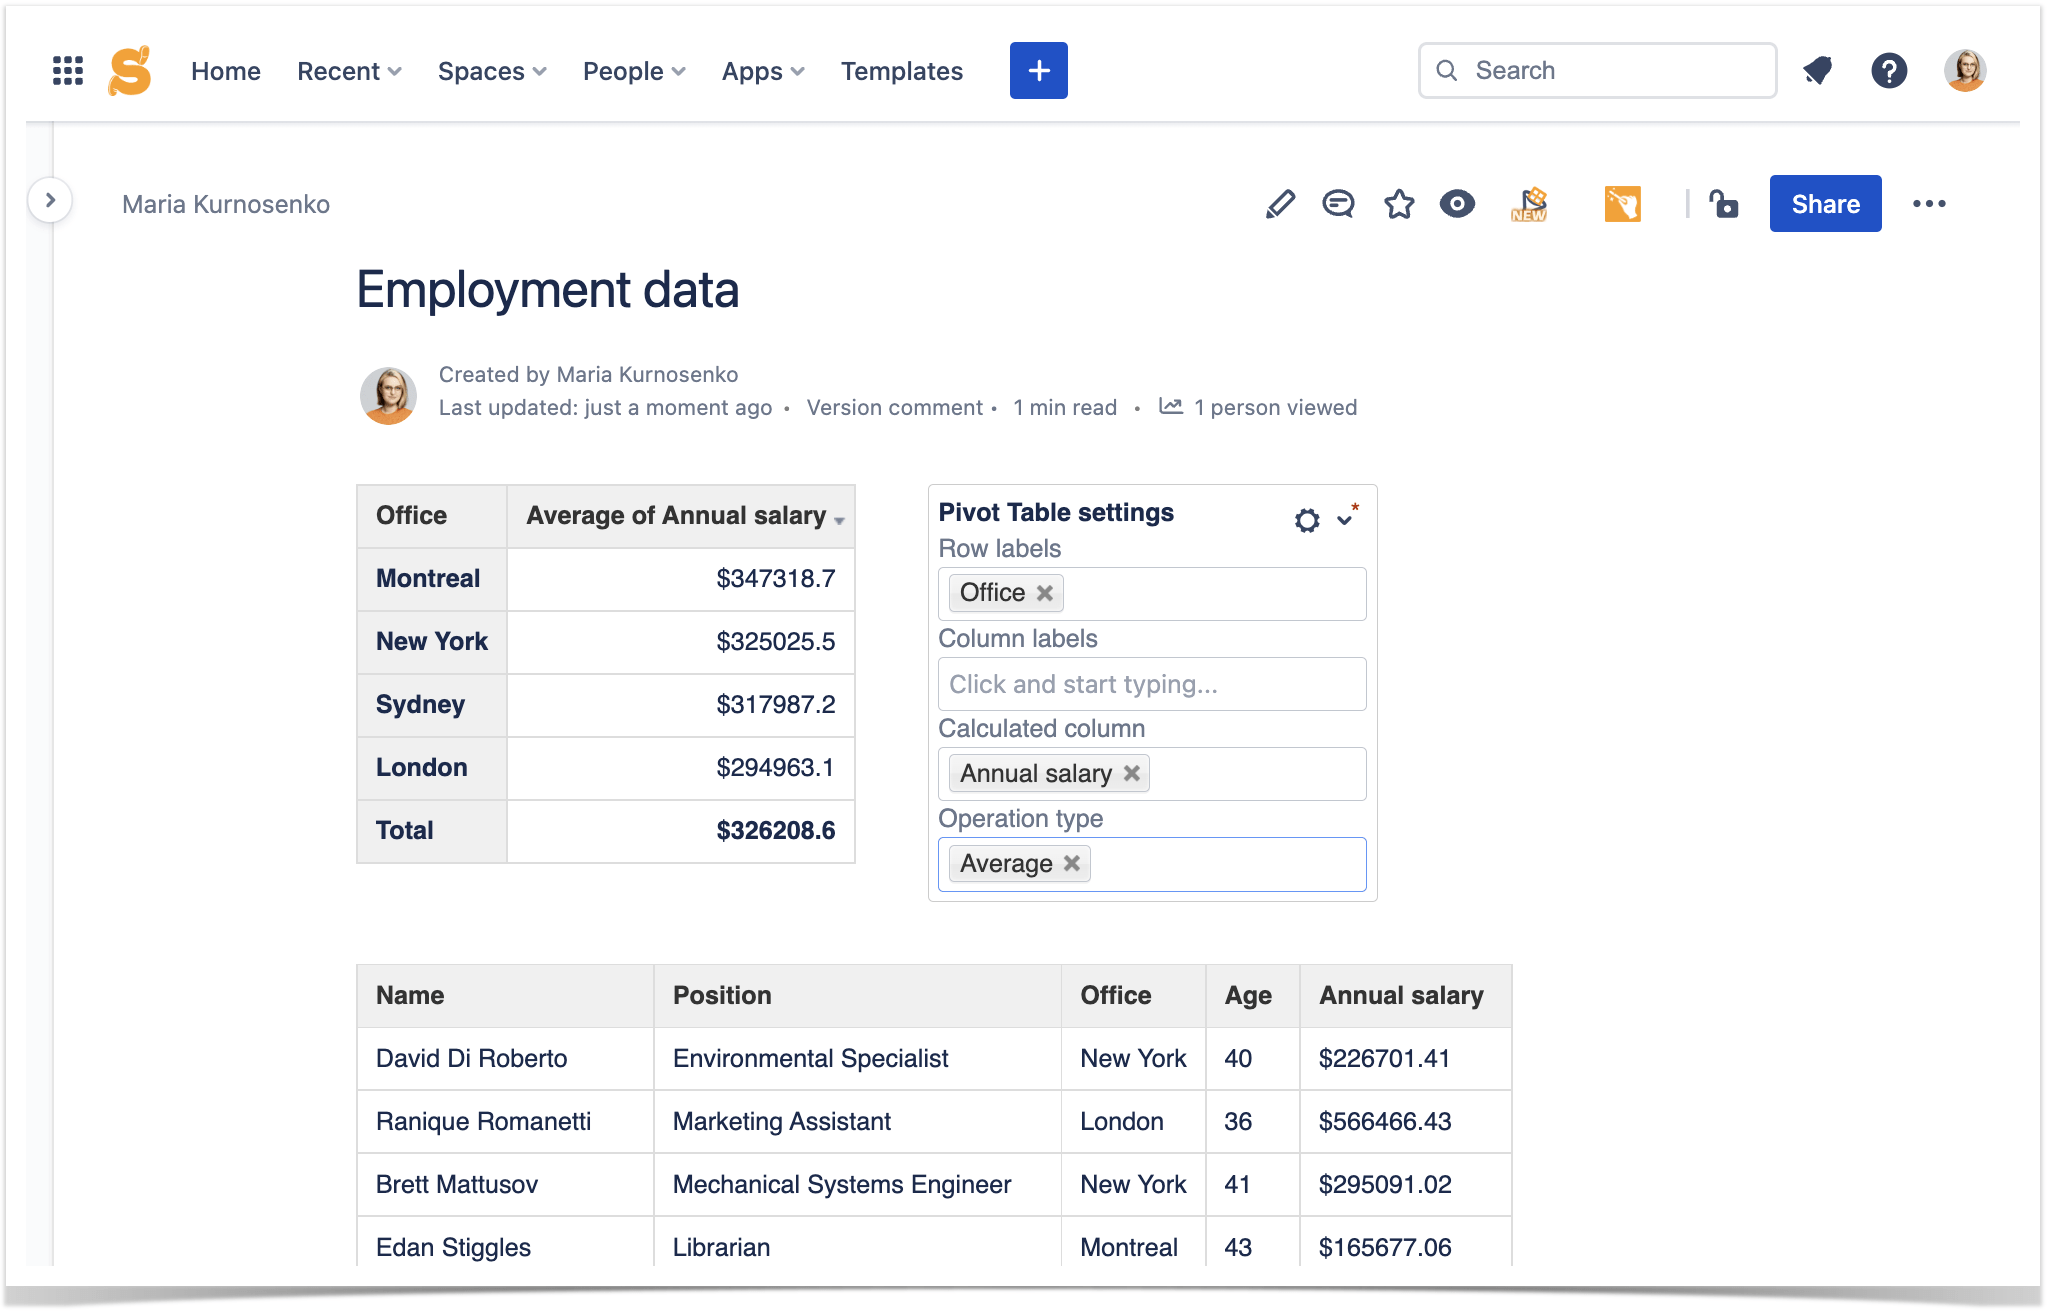
For cases when you need to group repeated values from an extensive table, the Pivot Table macro will come in handy. It allows you to get a brief overview of a big table and look at the data from multiple perspectives, depending on the chosen parameters and types of calculation. After adding the Pivot Table macro, you just need to select the columns you want to aggregate and the suitable calculation type.
If you previously applied filters to the source table and keep using them, the pivot table will adjust accordingly.
Visualizing table data with charts and graphs
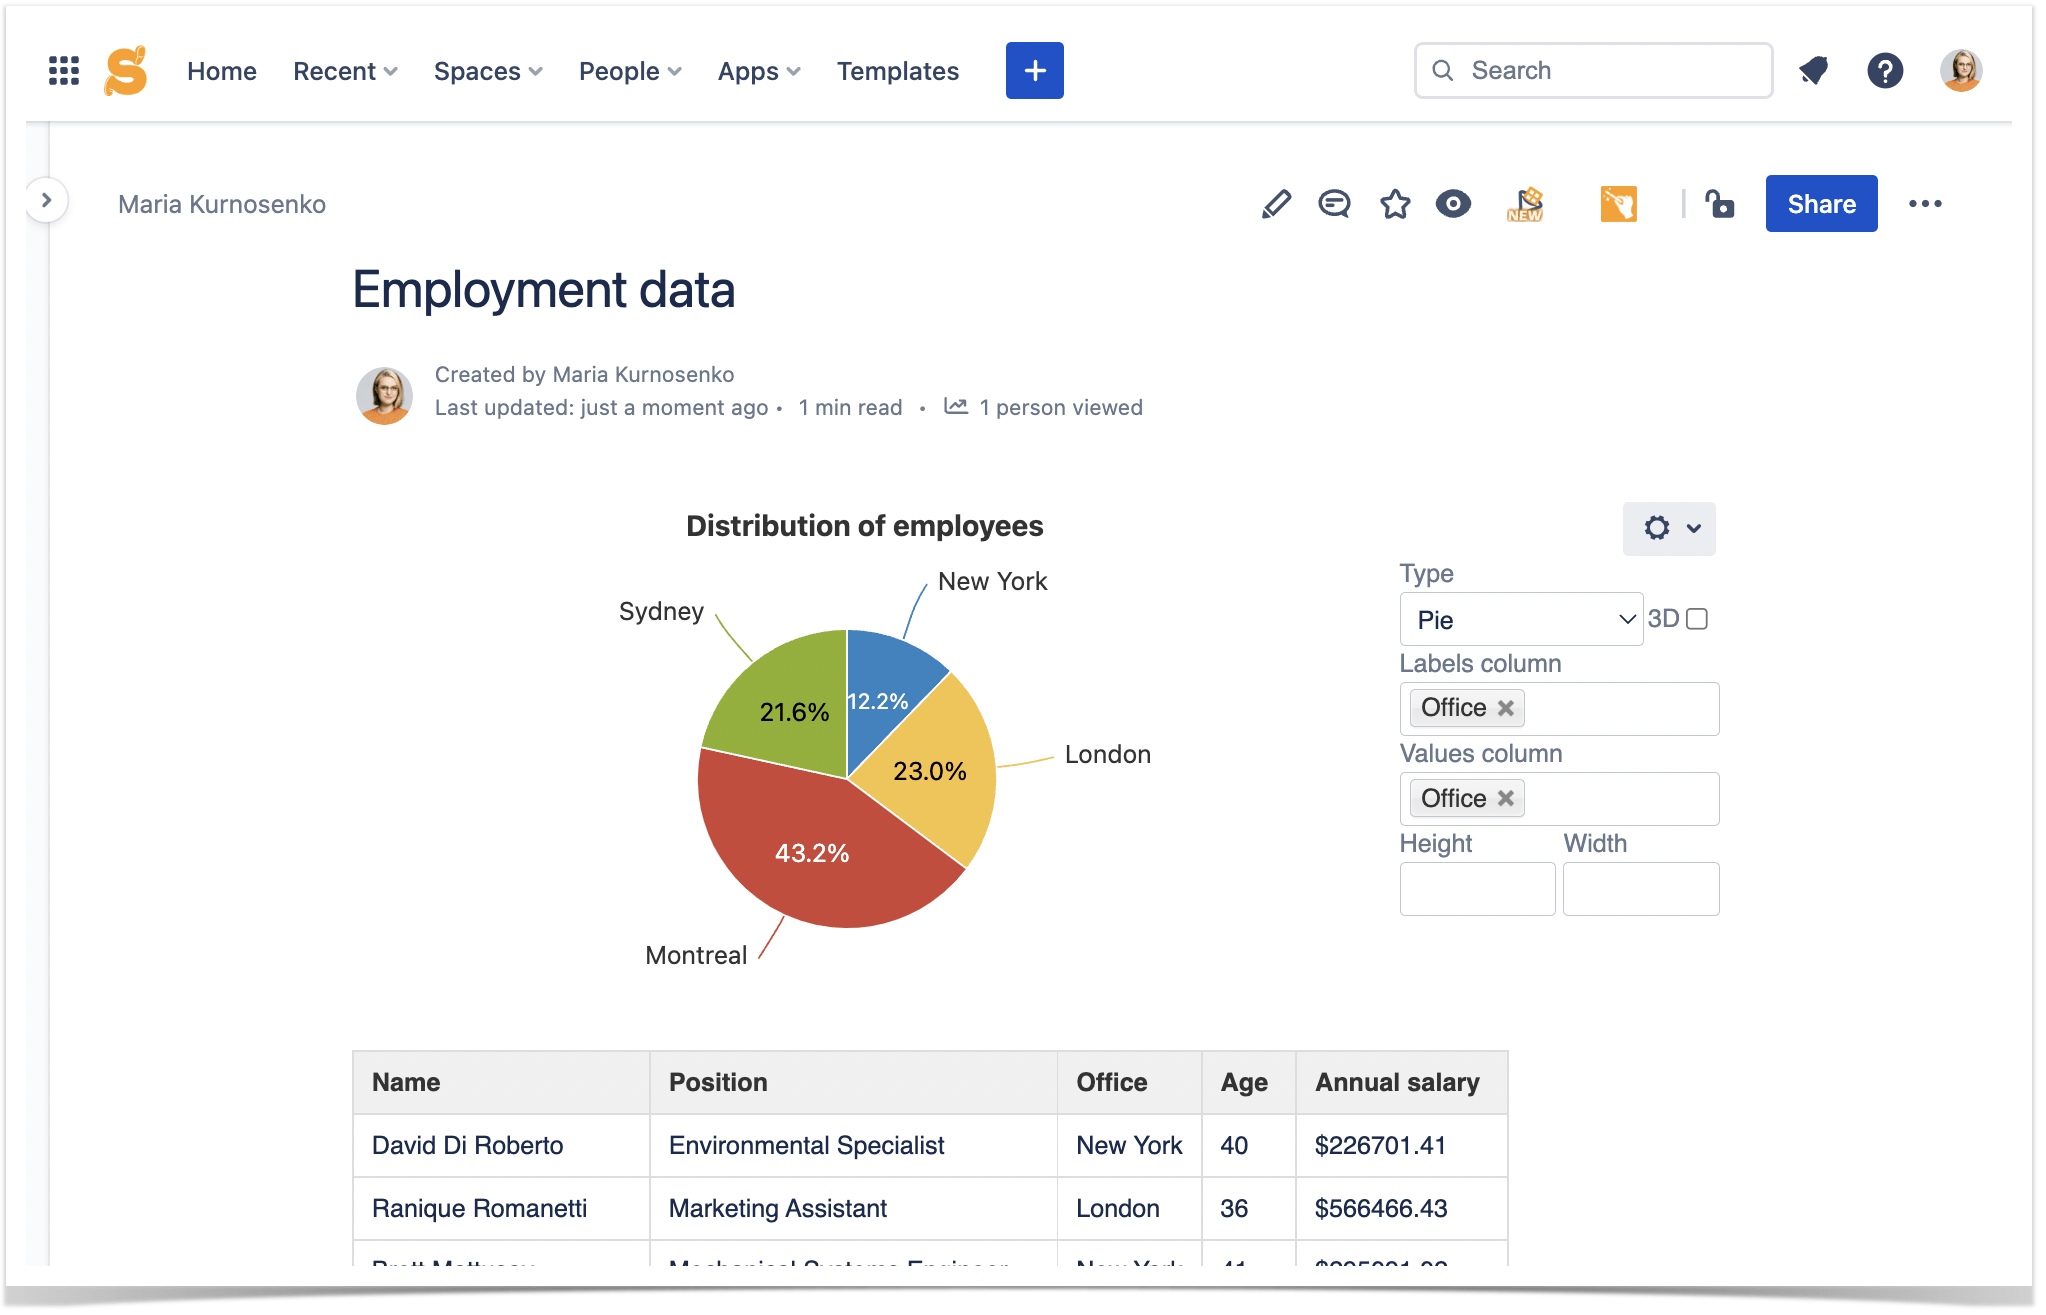
You can easily visualize numeric data for further analysis and presentation. With the Chart from Table macro, you can turn your table into a graph of a chosen type in just a few clicks without leaving the view mode. When you add the macro, it suggests multiple types of charts relevant to the source table, allowing you to add the chart in no time. After adding the chart, you can still change the data reflected on it or adjust the size and the colors.
Again, if you filter your source table or base the chart on the pivot table, the graph will automatically update to reflect the most recent version of the table.
Power up your table management with Table Filter and Charts for Confluence
Even though out-of-the-box Confluence features can limit your table management capabilities, you can enhance them with third-party apps, such as Table Filter and Charts for Confluence. Check it out on the Atlassian Marketplace and try it for free. Just follow the instructions below!
If you have any questions regarding the Table Filter and Charts for Confluence app or need assistance with using it, don’t hesitate to contact us.


