How Engineers Analyze Code Review Practices in Bitbucket

This is a fantastic plugin, really useful to analyze code review practices, monitor individual repo activity or a developer’s activity across multiple repos. Looks and works great!
Philip O’Gorman, JCA Electronics
JCA Electronics specializes in designing and manufacturing electronic control systems that are used by original equipment manufacturers (OEM). Their engineering team creates embedded drivers, embedded application software, mobile application libraries, and mobile applications for many OEMs that are mainly agricultural and construction companies.
The team uses Bitbucket for collaborating on code and extended its capabilities with the app Awesome Graphs for Bitbucket to:
- get the history of developer activity across all projects and use it for filling in timesheets
- browse commits of all branches of a repository
- analyze project activity and the process of code review
Data for billing – a click away
JCA Electronics’ engineers can be working on many projects simultaneously. Therefore, to fill in timesheets for billing, the company needed an easy way to see the daily work log of each developer.
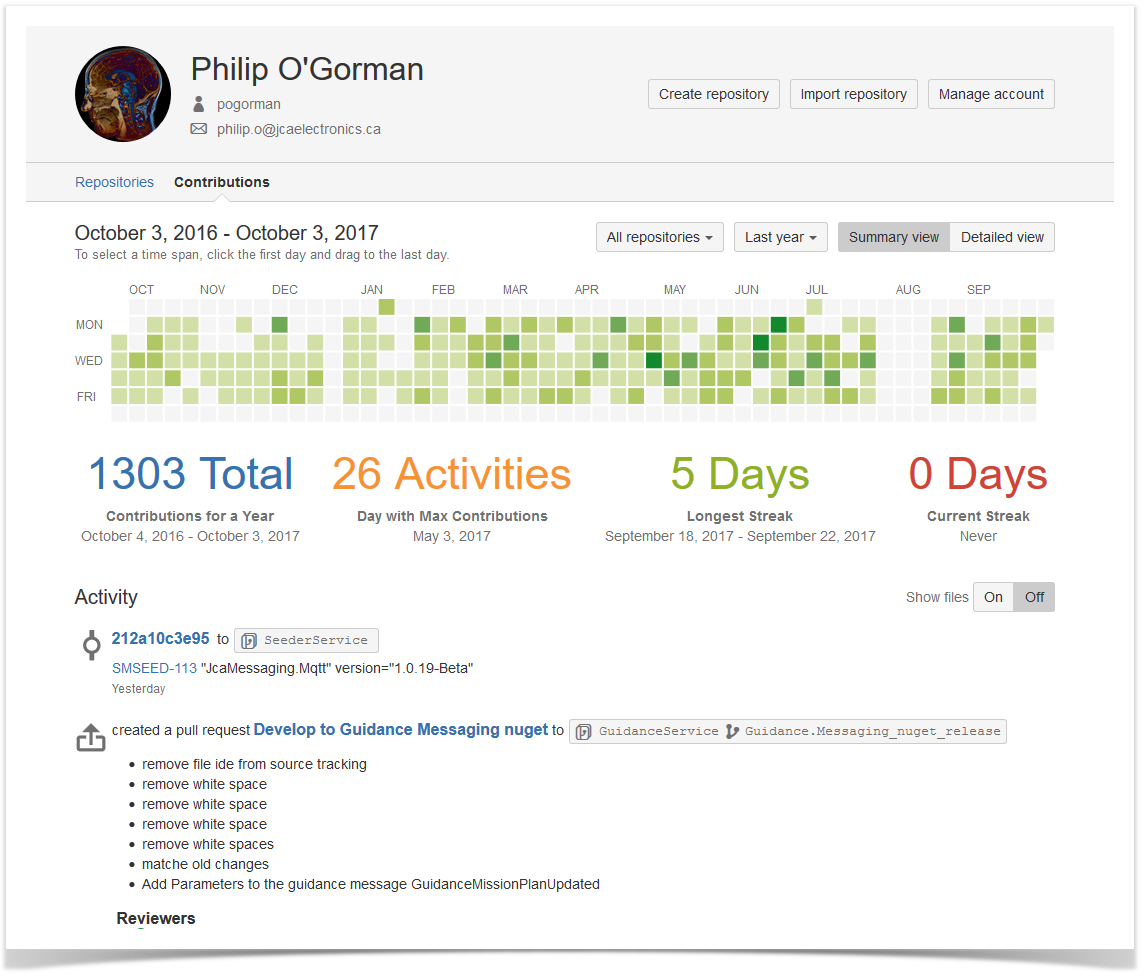
They found Contributions in user profiles invaluable for this purpose, as this page shows a developer calendar of the past year. When they click a day, the activity stream shows the list of commits and pull requests across all projects for that day.
Commits across all branches
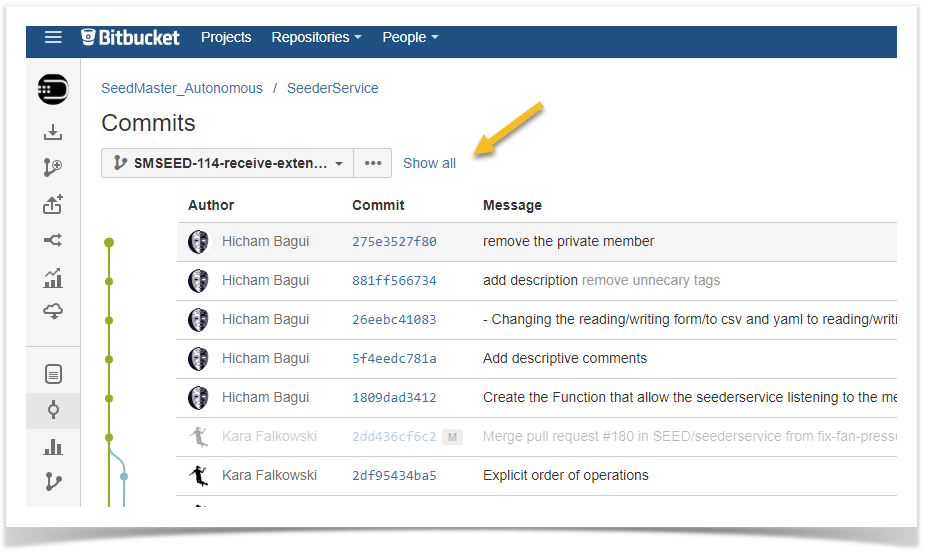
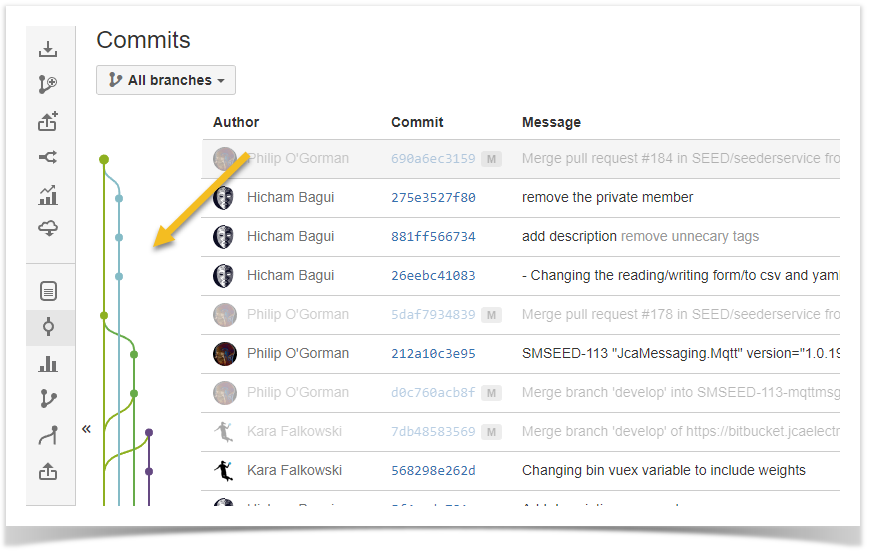
In addition, JCA Electronics appreciates the capability to see the activity across all branches (‘Show all’ link) on the Commits page of a repository or project. Before, they could only view the commits of each branch individually.
In addition, there’s a commit graph that gives a visual representation of the development flow and makes the commit log easy to read.
Project activity – at a glance
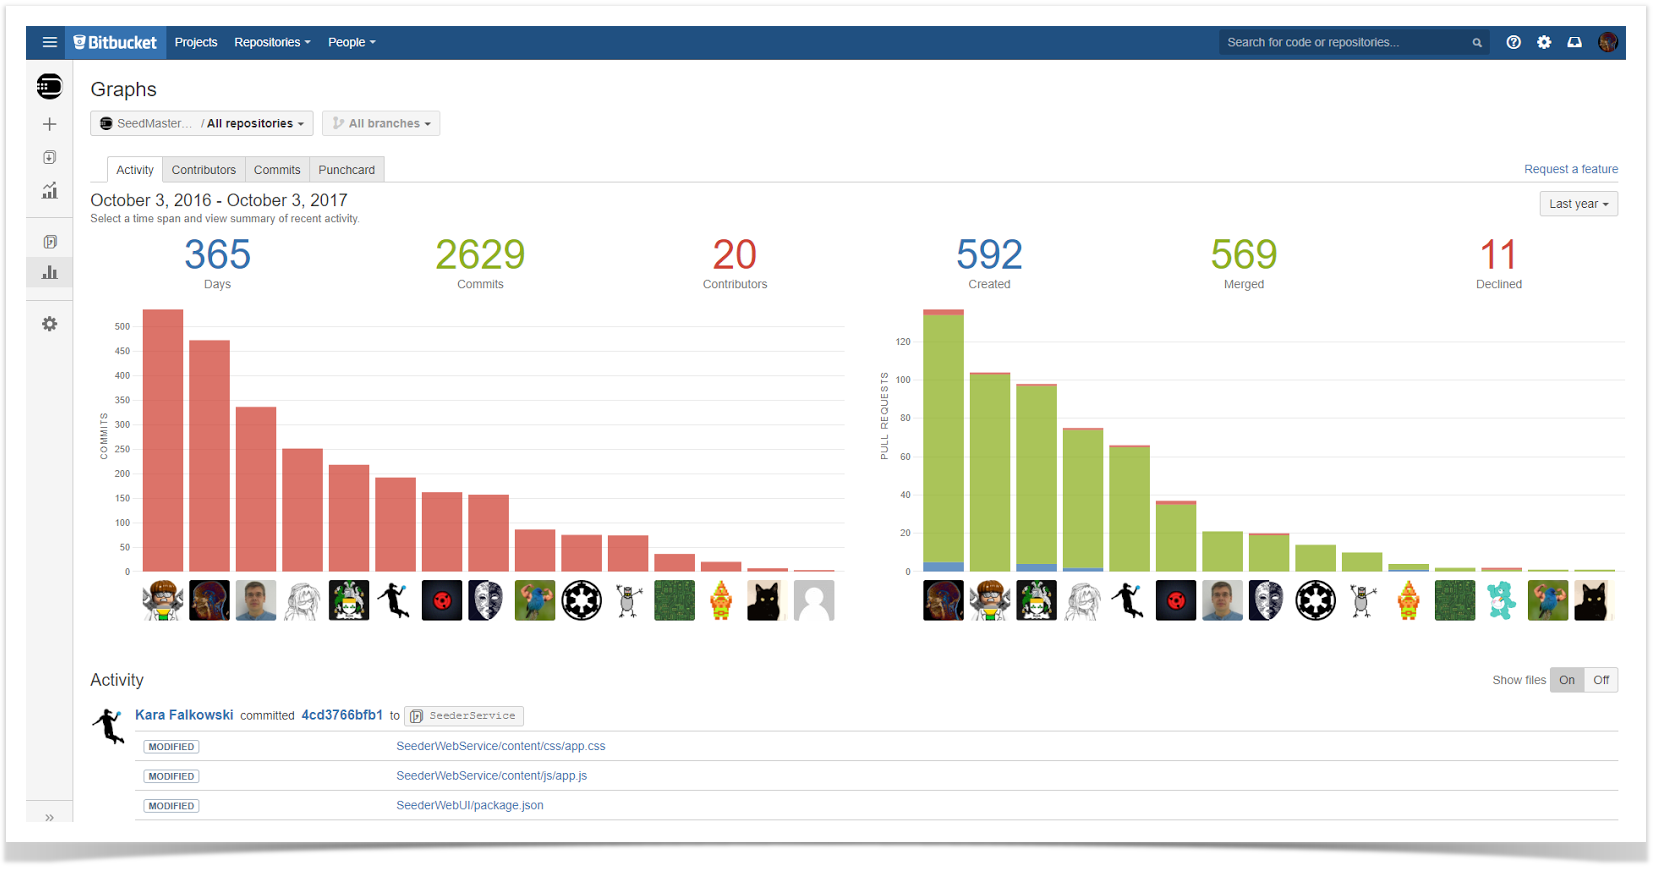
The team uses project graphs and reports to analyze project activity and monitor the number of contributors. The Graphs’ Activity tab provides the charts that let you compare the input (number of commits and pull requests) from the most active developers. In addition, it features the activity stream with the feed of commits and pull requests of the project.
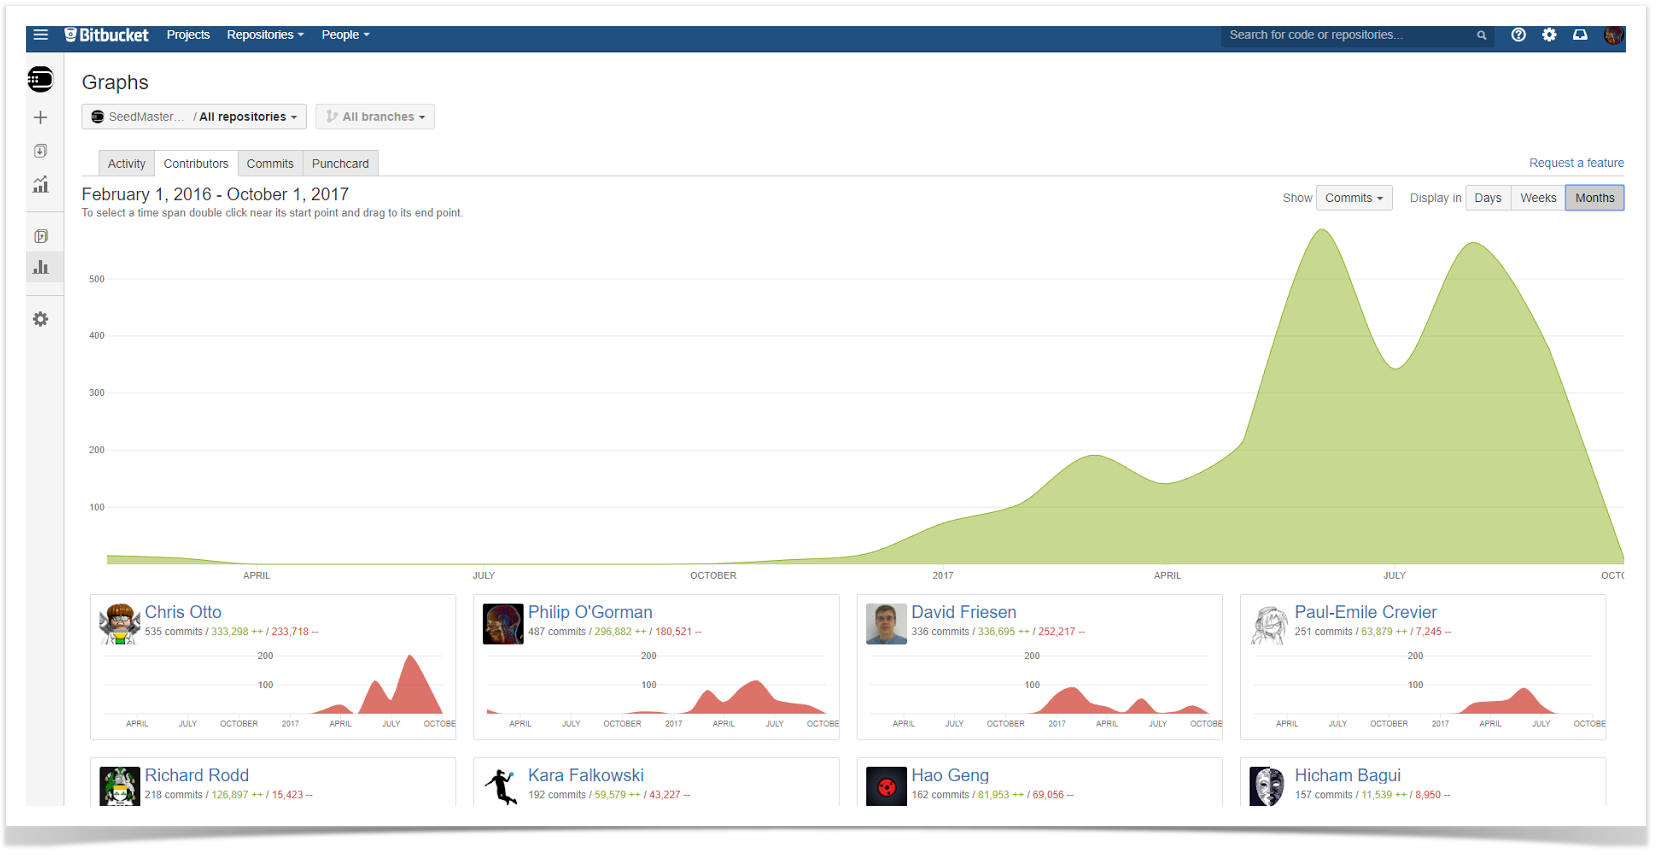
The Contributors tab captures the dynamics on two levels: team efforts (green graph) on the project and contributions of individual engineers (cards with red graphs).
The Contributors page can show graphs in commits, lines of code added or lines of code deleted. So a project manager can analyze the progress of development from different perspectives.
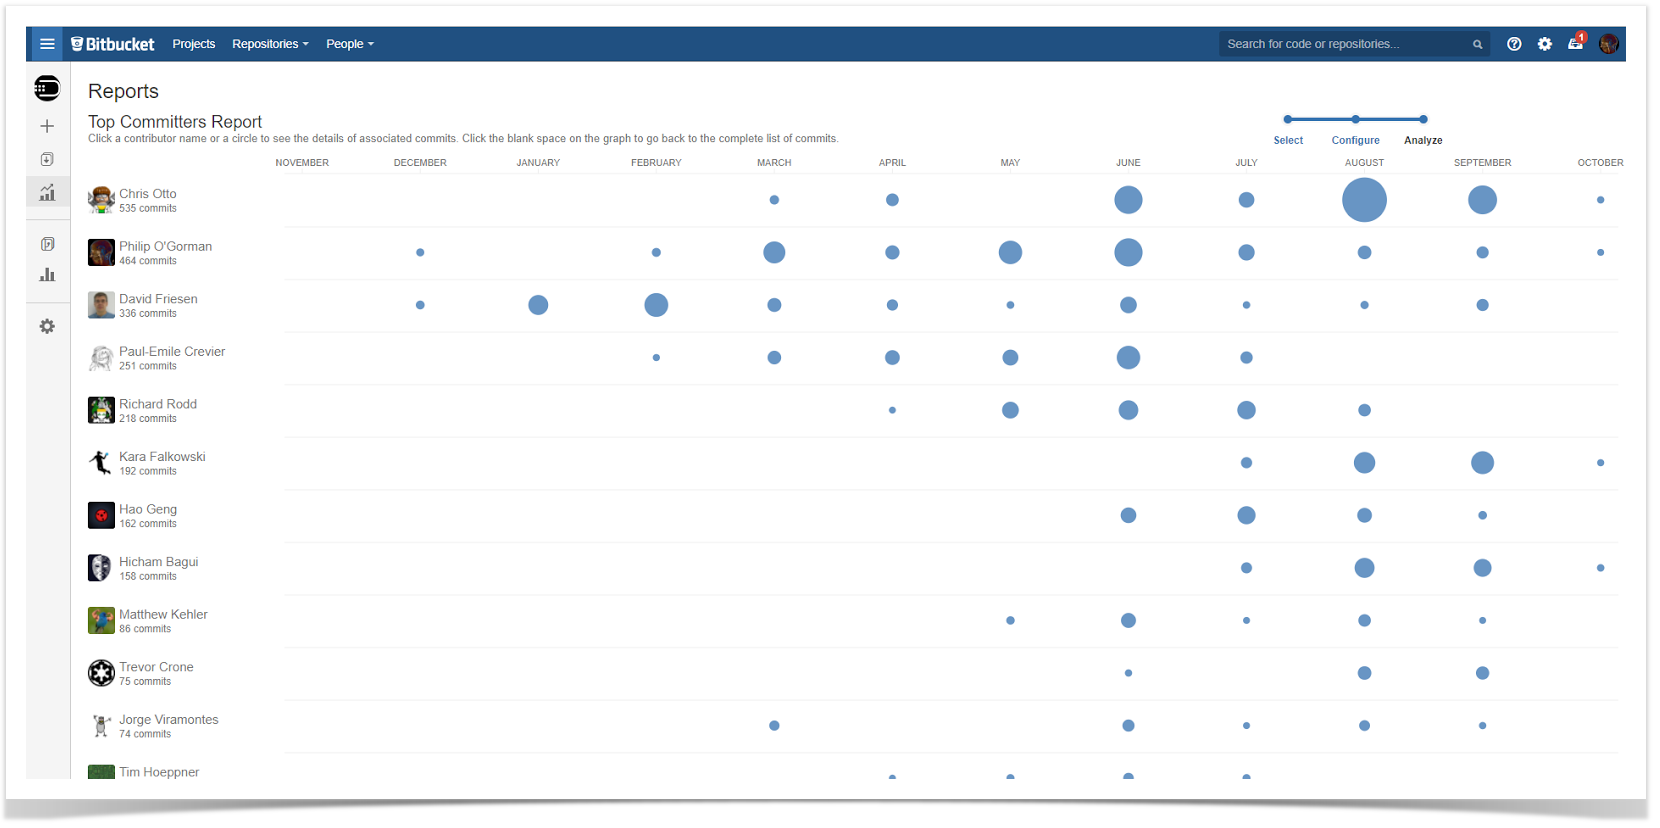
JCA Electronics also uses Top Committers Report to see what developers worked on a project during a certain period of time, e.g. a sprint, a year, and compare the number of commits each person contributed.
Tracking code review practices
The company has many projects and repositories to manage. So it is very important for them to make sure that pull requests and code reviews are utilized on each project. Activity in project graphs and Created vs Merged Pull Requests Report help the team ensure that the correct practices are being used.
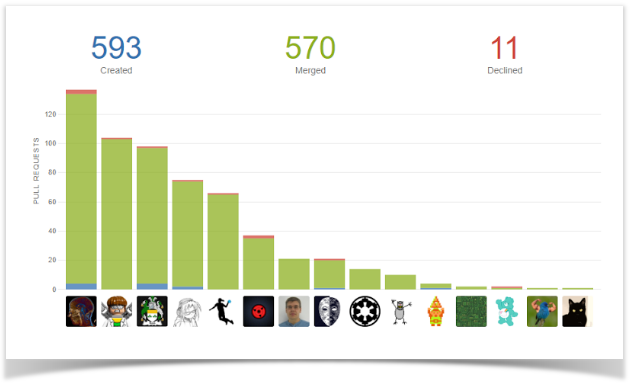
Activity shows:
- how many pull requests were created, merged, and declined in the project within a chosen time period
- who made those pull requests, including whose pull requests were declined
- what developers were more active than others
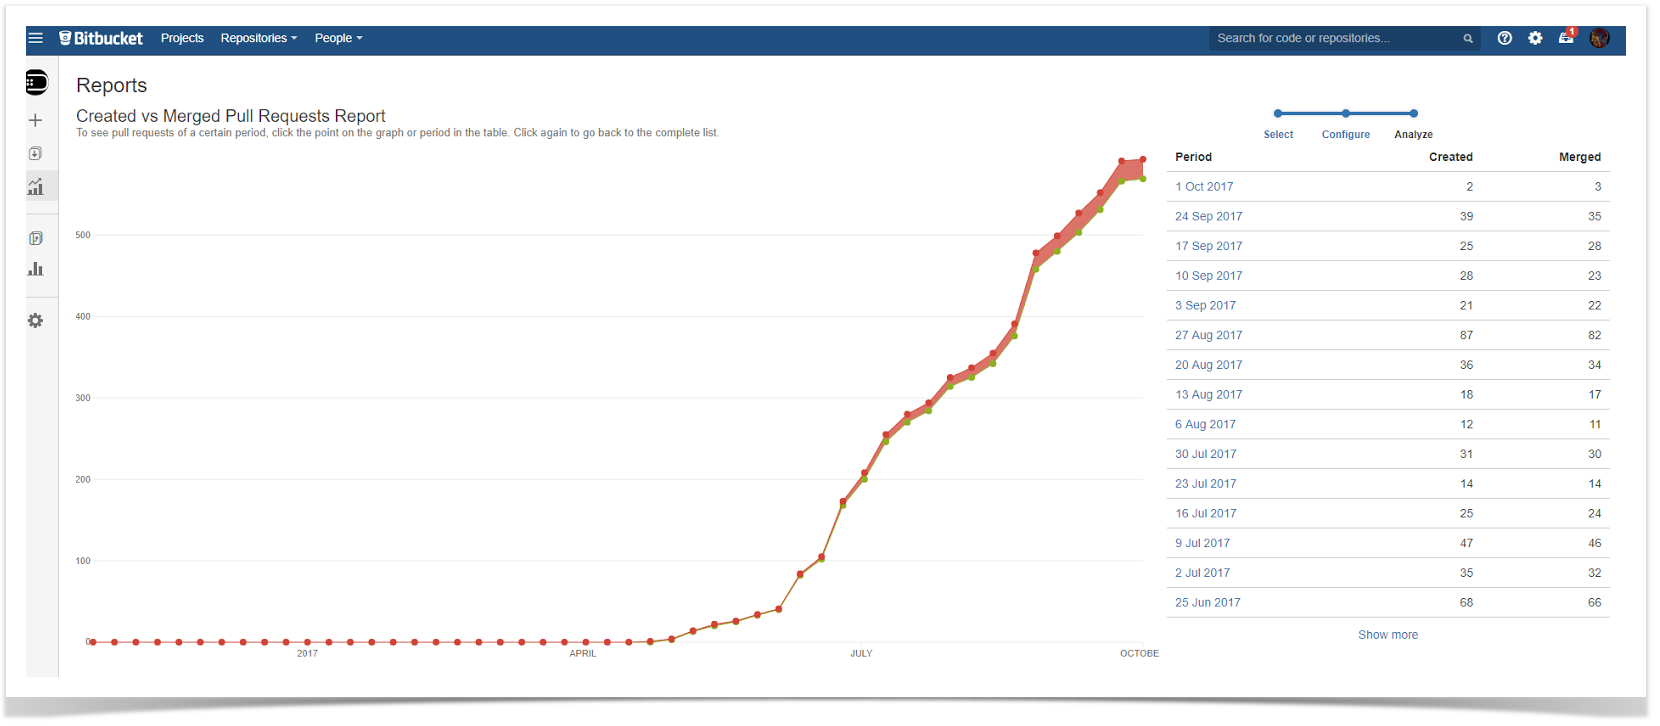
Created vs Merged Pull Requests Report visualizes the dynamics of pull requests’ creation and merging that tells the team:
- pull requests are used a lot (the curve is rapidly heading away from the Time axis) or not
- more pull requests are being created than merged (red parts of the graph) or vice versa
- how many pull requests were created and merged in each period
Conclusion
The Awesome Graphs for Bitbucket app provides JCA Electronics with the capabilities that enrich and facilitate their experience with Bitbucket. The company benefits from graphs and reports that give insights into project activity and code review practices. The graphs also provide data for billing and evaluation of contributions made by teams and individual developers.
Read more case studies to see how our customers benefit from using Awesome Graphs for Bitbucket in their work:


