Evaluating team availability with Team Calendars and Table Filter and Charts in Confluence

Atlassian is a company of professionals who deliver all kinds of enterprise applications to other professionals. They provide a variety of solutions tailored to everyday needs of most companies and keep extending them with high-demand features.
Their well-known team collaboration platform Confluence has proved to be one of the best knowledge-sharing and project planning solutions on the market. The variety of bundled features and superb extensibility with third-party apps distributed through the Atlassian Marketplace make this solution ideal for teams of all sizes and specializations.
But the power of the team is preserved only when all teammates work together and interact with each other on a regular basis. That’s why for you as a human resources manager it is necessary to track availability of all team members and identify potential problems in advance. These timely actions will let you keep healthy relationships between teammates and maintain high team performance for project development.
But how can this be achieved? You can install some automated tracking system, add the system of punishment (we are joking of course), or just use the Team Calendars app from Atlassian.
This is an extension for Confluence that allows you to manage calendars for all your teams and track all sorts of events, such as business trips, leaves, travels, and birthdays. Besides this, you can mark specific dates for team meetings, track duration of sprints, and indicate the project release dates. This way every team member will be aware of planned activities and leaves of colleagues, which will allow you to better coordinate their work and foresee the potential issues in allocation of human resources.
Displaying calendar data in Confluence
For now we have a team calendar with all sick leaves, holidays, business trips, and days when employees worked at home (yes, our company allows this ). But it is time to think how we can output this data in Confluence, so besides viewing it in the calendar we can analyze it too. And here we will take advantage of ScriptRunner for Confluence from the Adaptavist team.
ScriptRunner provides you with the following capabilities:
- built-in scripts for performing routine operations;
- creation and execution of custom scripts;
- configuration of responses to events occurred in Confluence;
- customization of Confluence interface and adjustment of its behaviour;
- scheduling routine operations for execution;
- content transfer between applications.
For our use case, we will need to create a custom script macro which will parse information from the corporate calendar and generate a table listing all events tracked in it. We go to the administration console of Confluence, here locate the ScriptRunner section and select Script Macros.
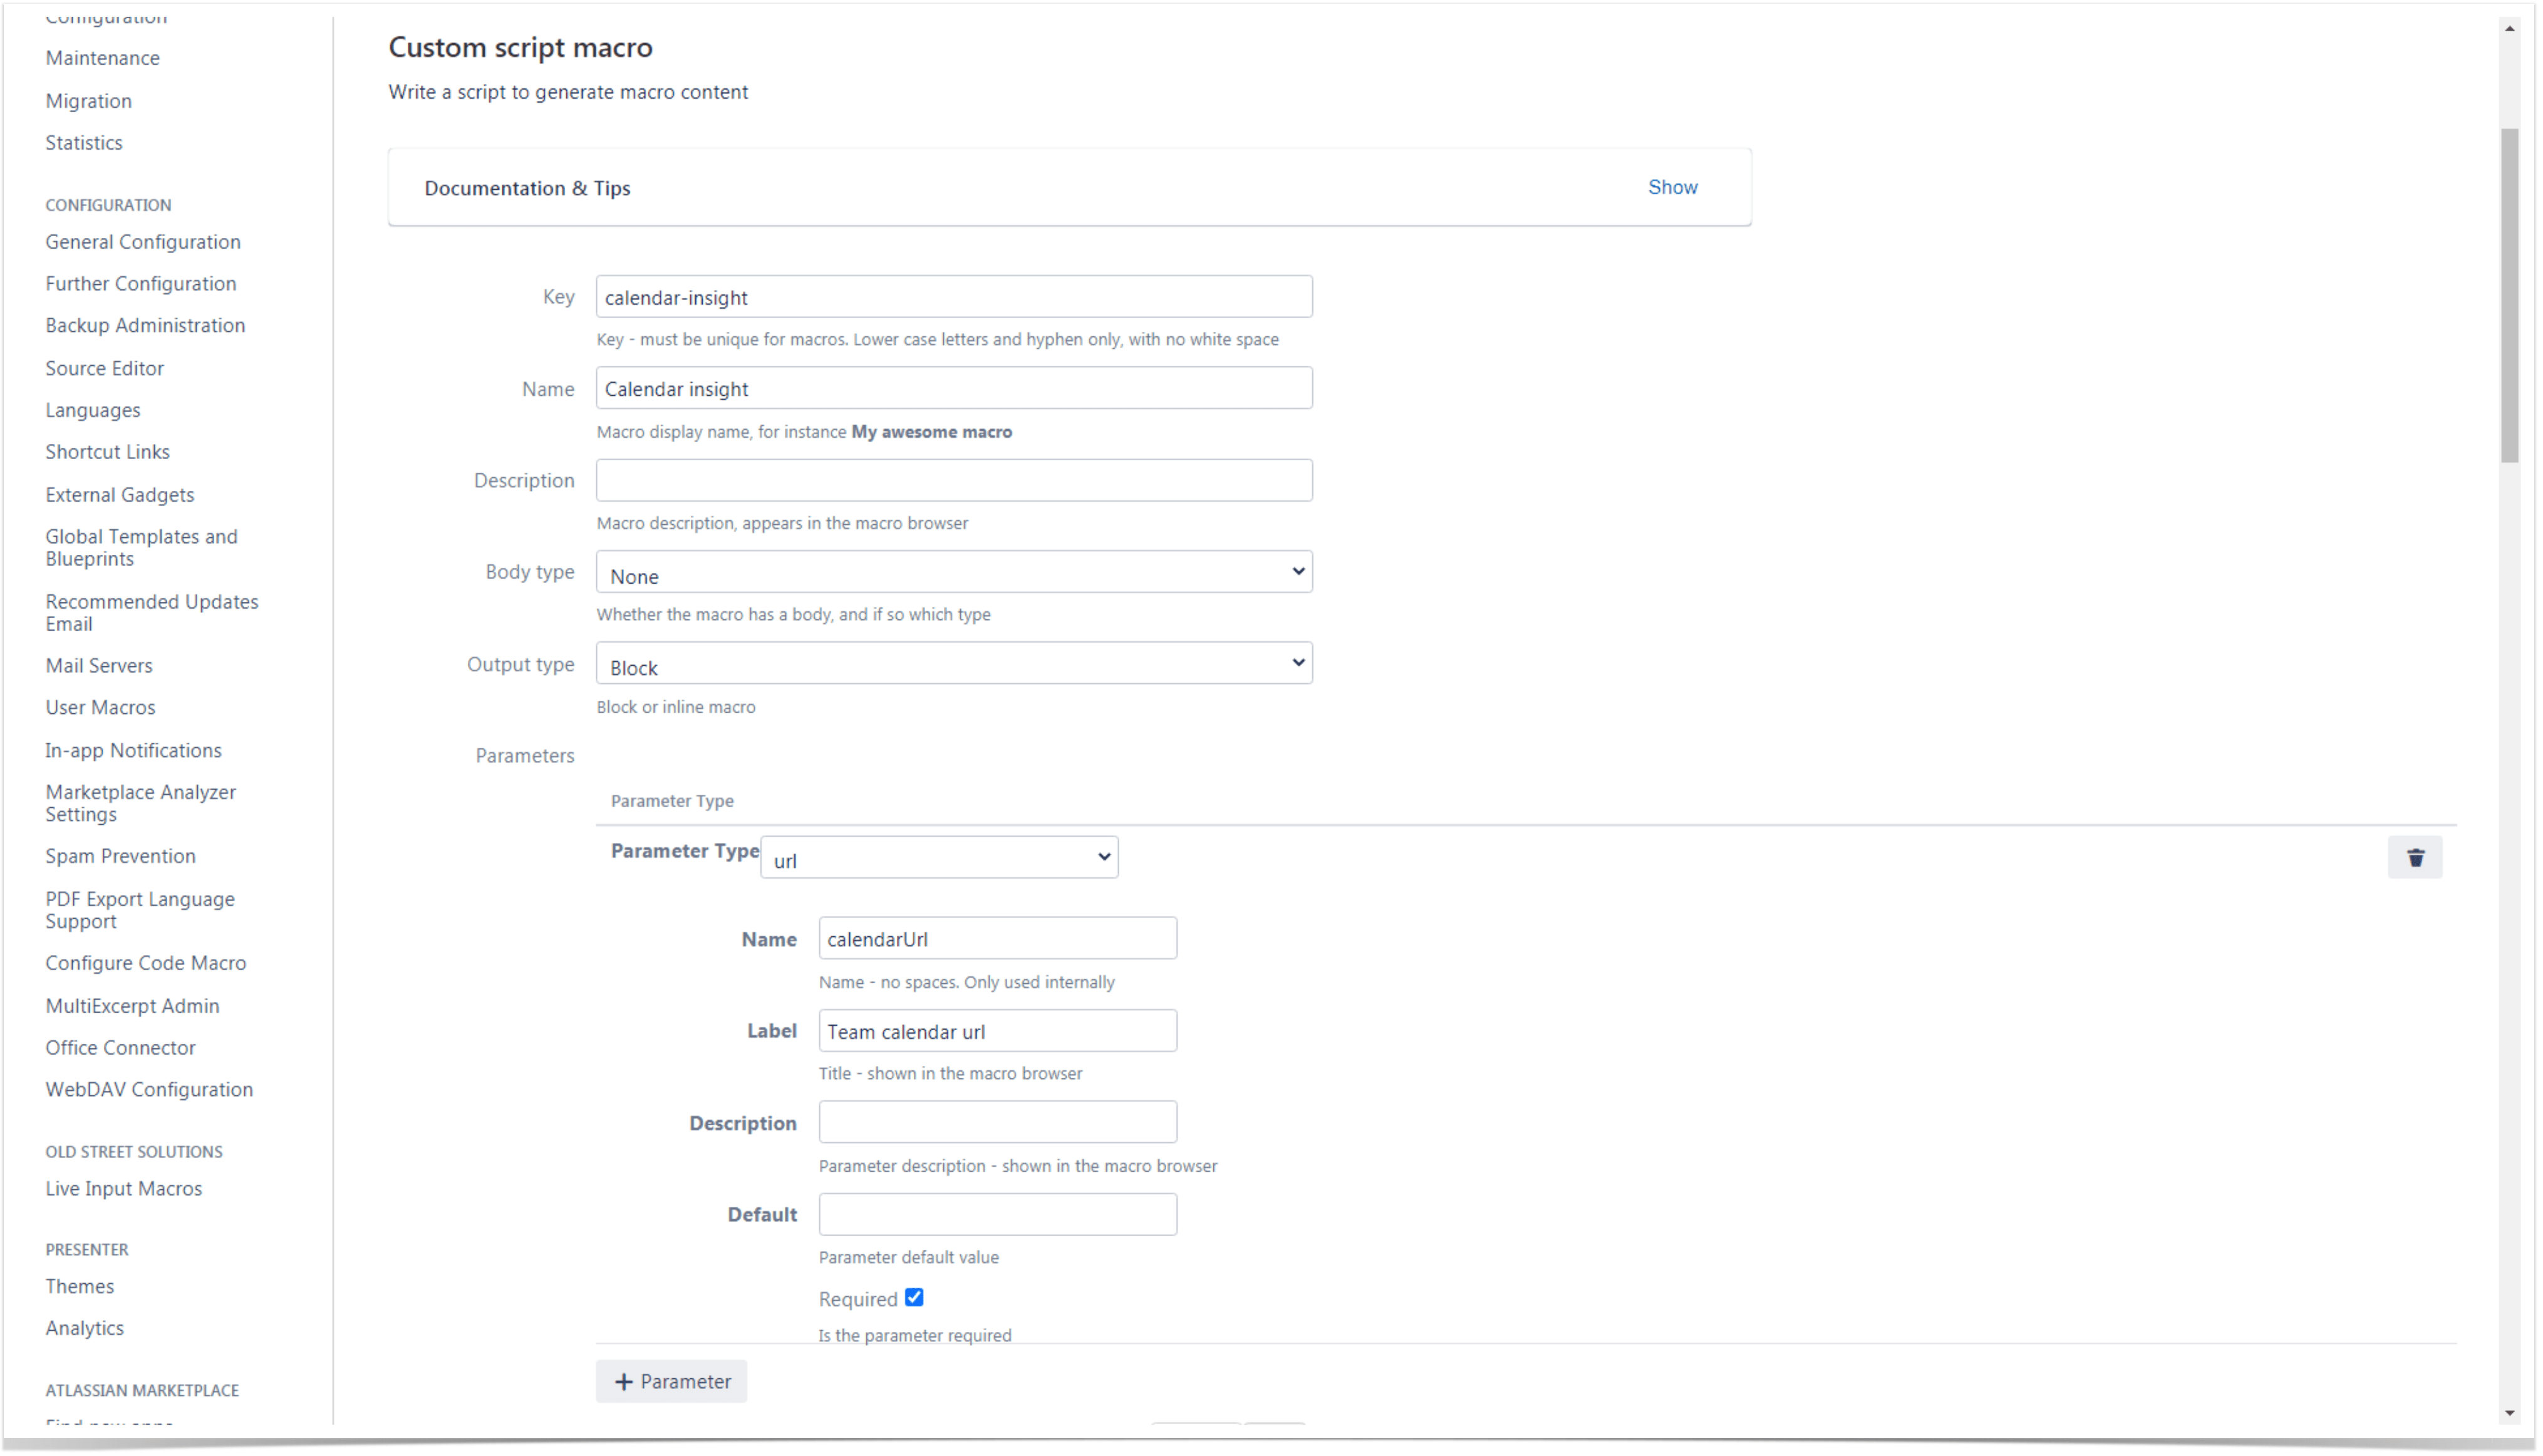
Then click Add New Item and select Custom script macro. On the opened page, specify information about the macro, as follows:
- Key – enter the key of script macro.
- Name – enter the name of the script macro. This name will be used for referencing the macro on Confluence pages.
- Description – enter the description of the macro if needed.
- Body Type – select ‘None’.
- Output type – select ‘Block’.
Once this is done, it is time to configure the script parameters:
- Parameter Type – select ‘URL’ as the script will use the path to the calendar for parsing it.
- Name – enter the internal name of the script macro.
- Label – enter the parameter name displayed when editing the macro parameters.
- Required – check the box to make the parameter as required.
Once the initial configuration of the script macro is complete, it is time enter the following macro code:
import com.atlassian.sal.api.component.ComponentLocator
import com.atlassian.plugin.webresource.WebResourceManager

def webResourceManager = ComponentLocator.getComponent(WebResourceManager)
webResourceManager.requireResource("com.atlassian.auiplugin:aui-date-picker")

"""<script type='text/javascript' src='https://cdnjs.cloudflare.com/ajax/libs/ical.js/1.3.0/ical.min.js'>
</script>
    <table class='aui team-calendar-table' data-src='${parameters.calendarUrl}'>
        <thead><tr><th>User</th><th>Type</th><th>Description</th><th>Start Date</th><th>End Date</th><th>Days</th></tr></thead>
        <tbody></tbody>
    </table>
</div>"""
Then enter the following JavaScript code for the macro:
AJS.toInit(function() {
    AJS.$('.team-calendar-table').each(function() {
        var table = AJS.$(this);
        table.removeClass("team-calendar-table");

        AJS.$.ajax({
            type: 'GET',
            cache: false,
            url: table.data('src'),
            dataType: 'json',
            complete: function(data) {
                var calData = ICAL.parse(data.responseText);
                var comp = new ICAL.Component(calData);
                var events = comp.getAllSubcomponents("vevent");
                var body = table.find('tbody');
                events.forEach(function (event) {
                    var start = event.getFirstPropertyValue("dtstart").toJSDate();
                    var end = event.getFirstPropertyValue("dtend").toJSDate();
                    var spent = (end - start) / 86400000;
                    var user = event.getFirstProperty("attendee");
                    user = user ? user.jCal[1].cn : "";

                    var tr = AJS.$('<tr></tr>');
                    tr.append(AJS.$('<td></td>').text(user));
                    tr.append(AJS.$('<td></td>').text(event.getFirstPropertyValue("x-confluence-subcalendar-type")));
                    tr.append(AJS.$('<td></td>').text(event.getFirstPropertyValue("description") || event.getFirstPropertyValue("summary")));
                    tr.append(AJS.$('<td></td>').text(AJS.$.datepicker.formatDate("yy-mm-dd", start)));
                    tr.append(AJS.$('<td></td>').text(AJS.$.datepicker.formatDate("yy-mm-dd", end)));
                    tr.append(AJS.$('<td></td>').text(spent.toFixed(2)));
                    body.append(tr);
                });
            }
        });
    });
})
Once this is done, save the script macro.
Outputting the team calendar in Confluence
It is time to output a table with calendar data on a Confluence page. Let’s create a new page and add our script macro on it by entering {Calendar Insight} (as you remember it was the name we assigned to our script macro). Once inserted, double-click the macro placeholder and enter the URL of the calendar you want to output.
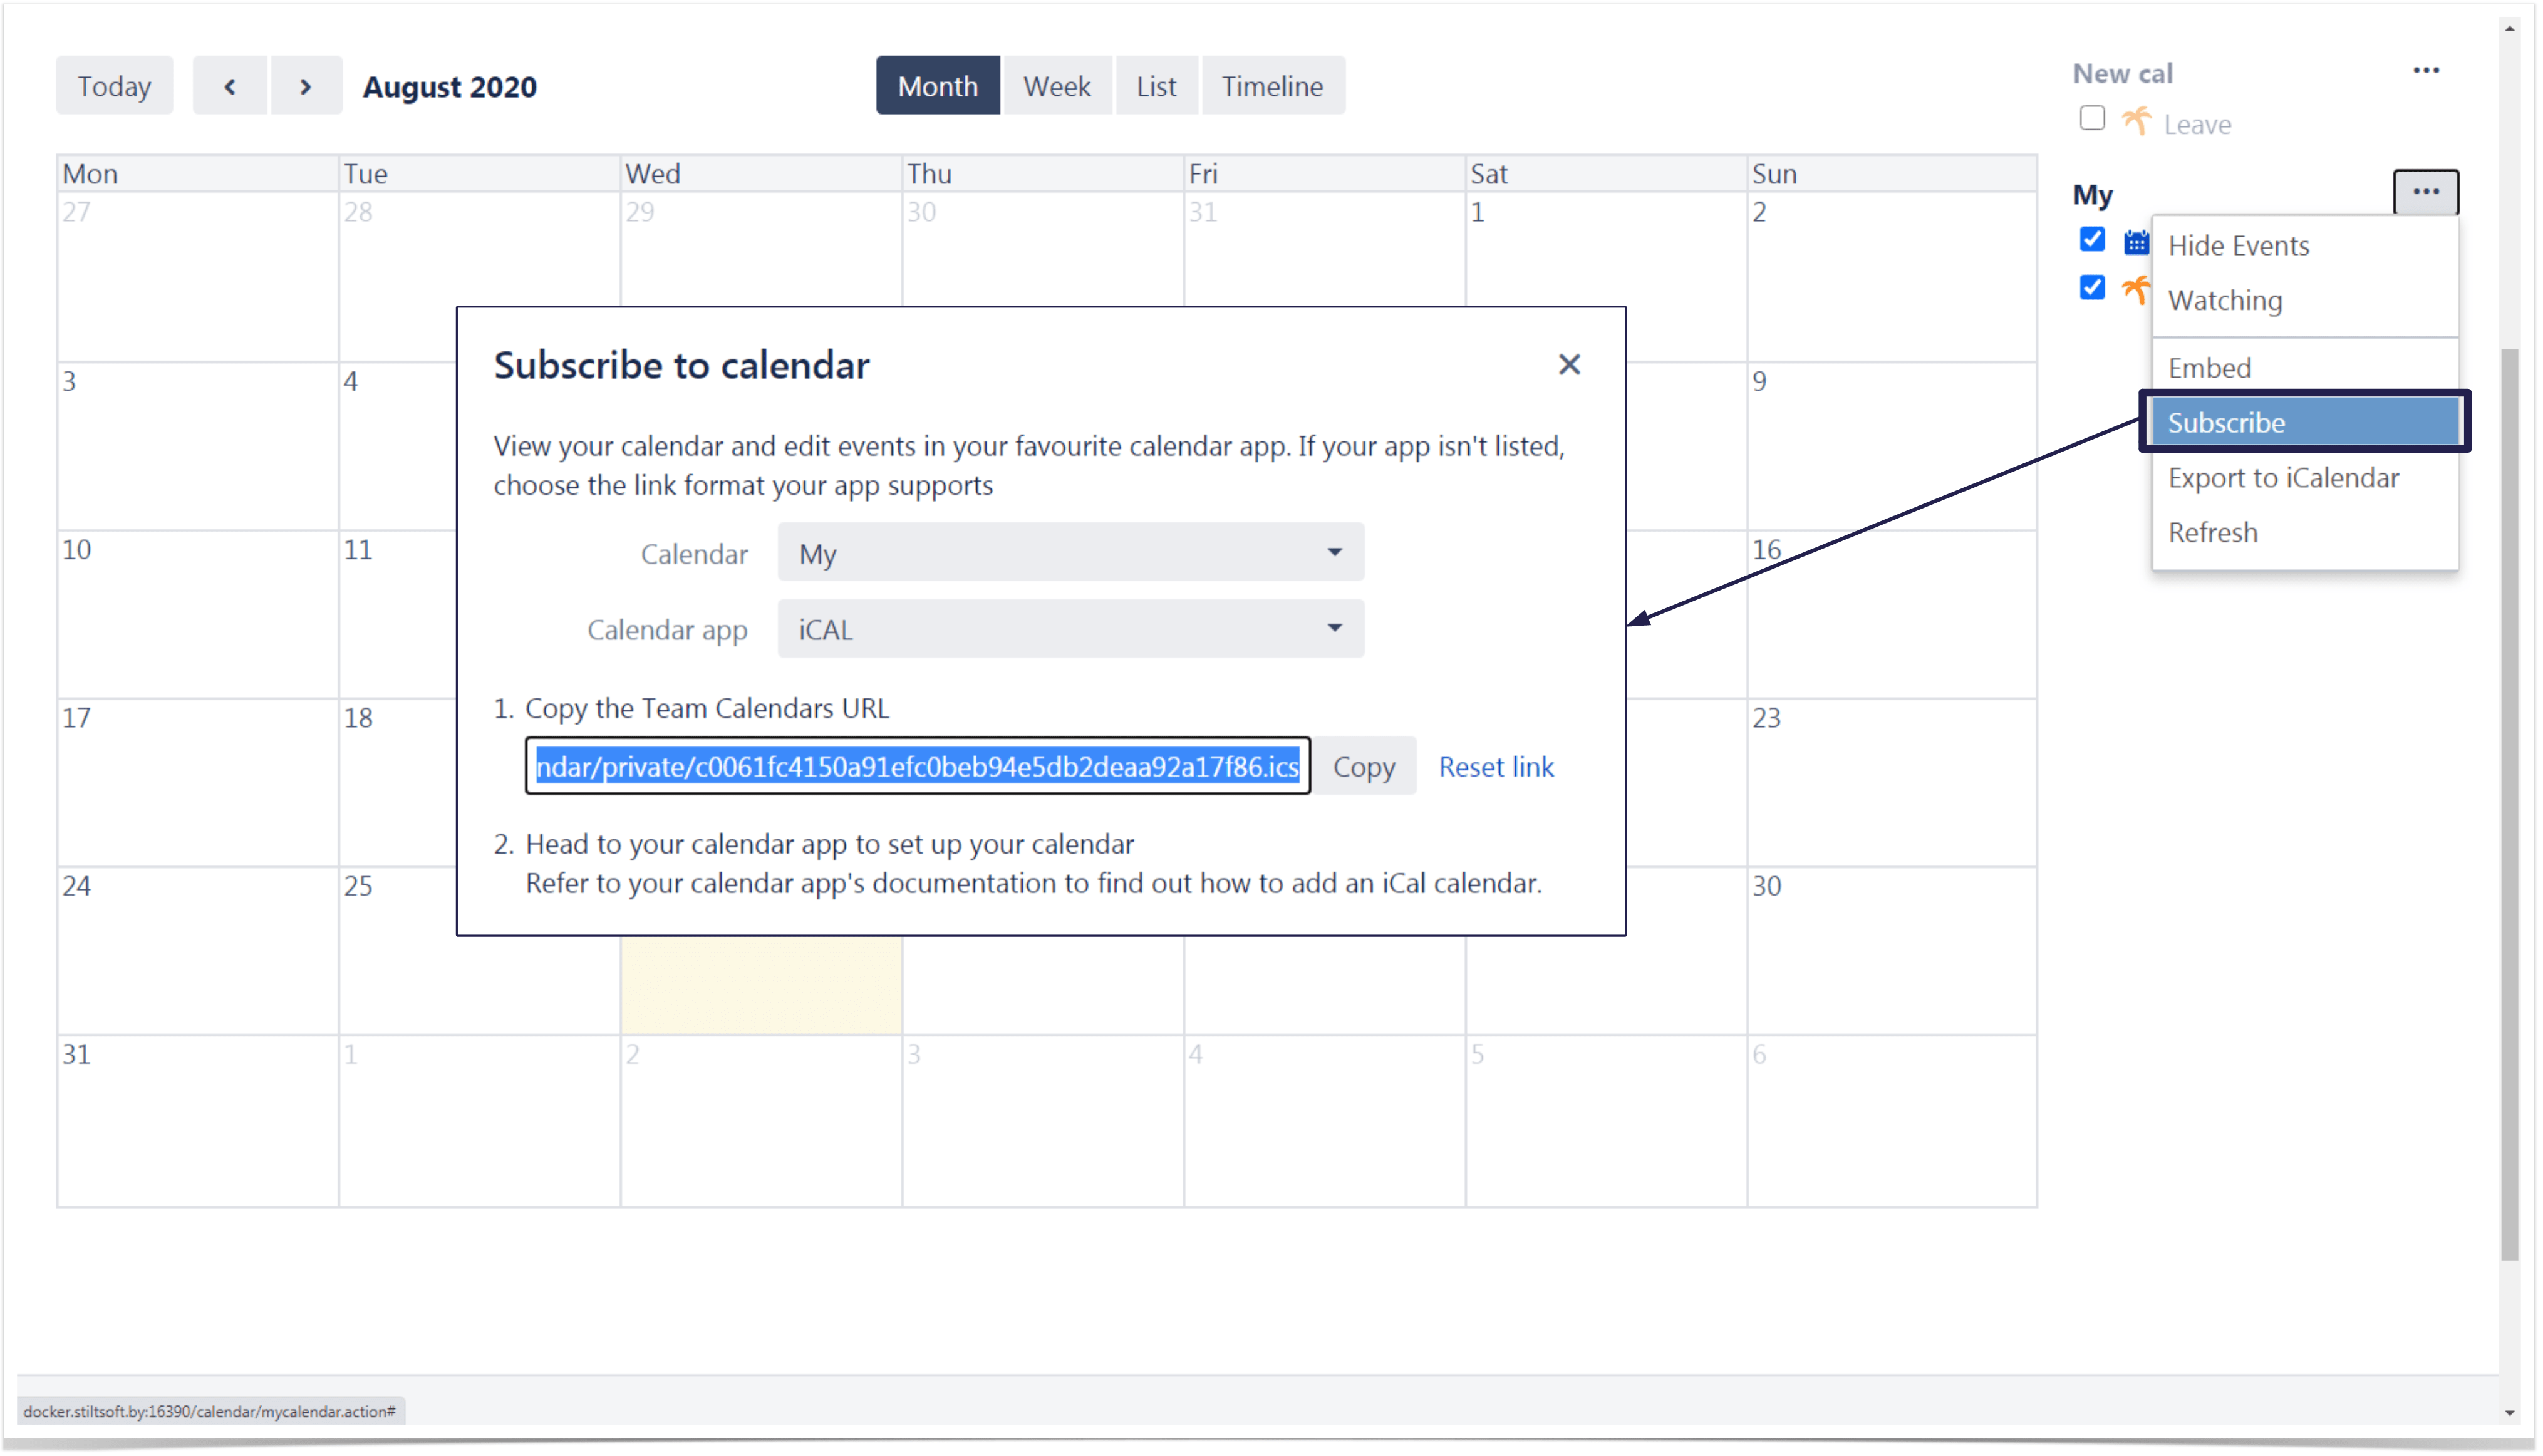
To get the URL of the calendar, select Calendars on the Confluence menu and open the appropriate calendar. Then click the management options button, select Subscribe, and choose the iCal Calendar app.
In the appeared form, copy the URL to embed the calendar on the page. Return to the page with the script macro and paste this address in the macro and save it with the page.
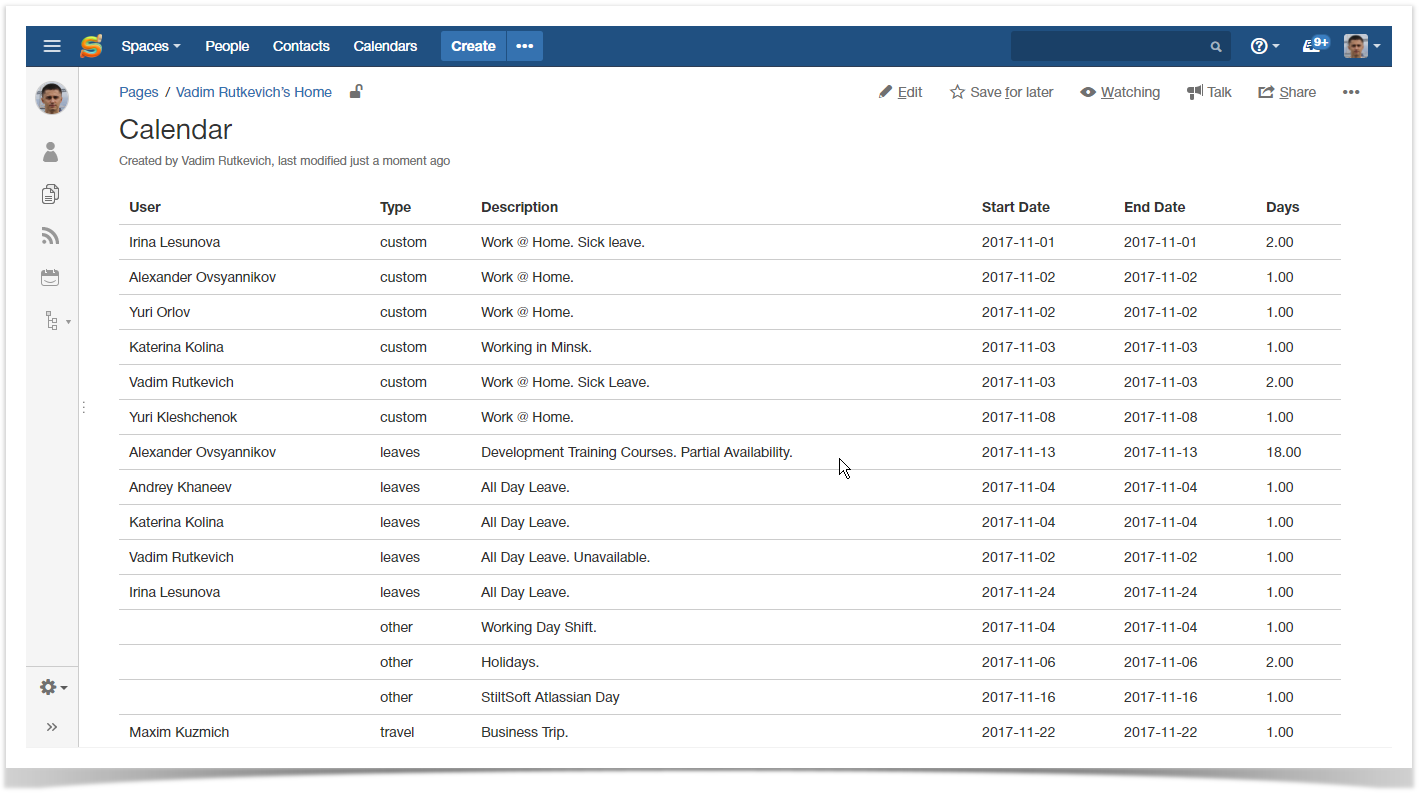
After all operations you should get a page with the table listing the following information:
- User – the user who the calendar event relates to.
- Type – type of the event added into the calendar.
- Description – description of the event.
- Start / End Dates – period which the event covers.
- Days – duration of the calendar event in days.
Well, this is just a start. Now let’s transform this information into the human-readable format and analyze it in Confluence.
Pro tip:
Learn more about using Spreadsheets in Confluence
Analyzing calendar data in Confluence
As you may have already understood, the generation of the table with calendar events was just a start. Its initial view will tell us nothing about the number of leaves and unavailability of people due to specific reasons.
And here we are going to apply Table Filter and Charts. Initially designed as a tool for filtration of table data, this app has transformed into something greater. As of now it provides you with the following capabilites:
- filtration of almost any kind and format of data in Confluence
- aggregation of information in multidimensional pivot tables
- visualization of source or aggregated data series with dynamic charts
All the macros bundled within the app are mutually compatible, so you can create complex combinations of them for delivering reports you are interested in.
Watch the following video on details how to analyze calendar events or continue reading this blog post.
Visualizing breakdown of calendar events by type and user
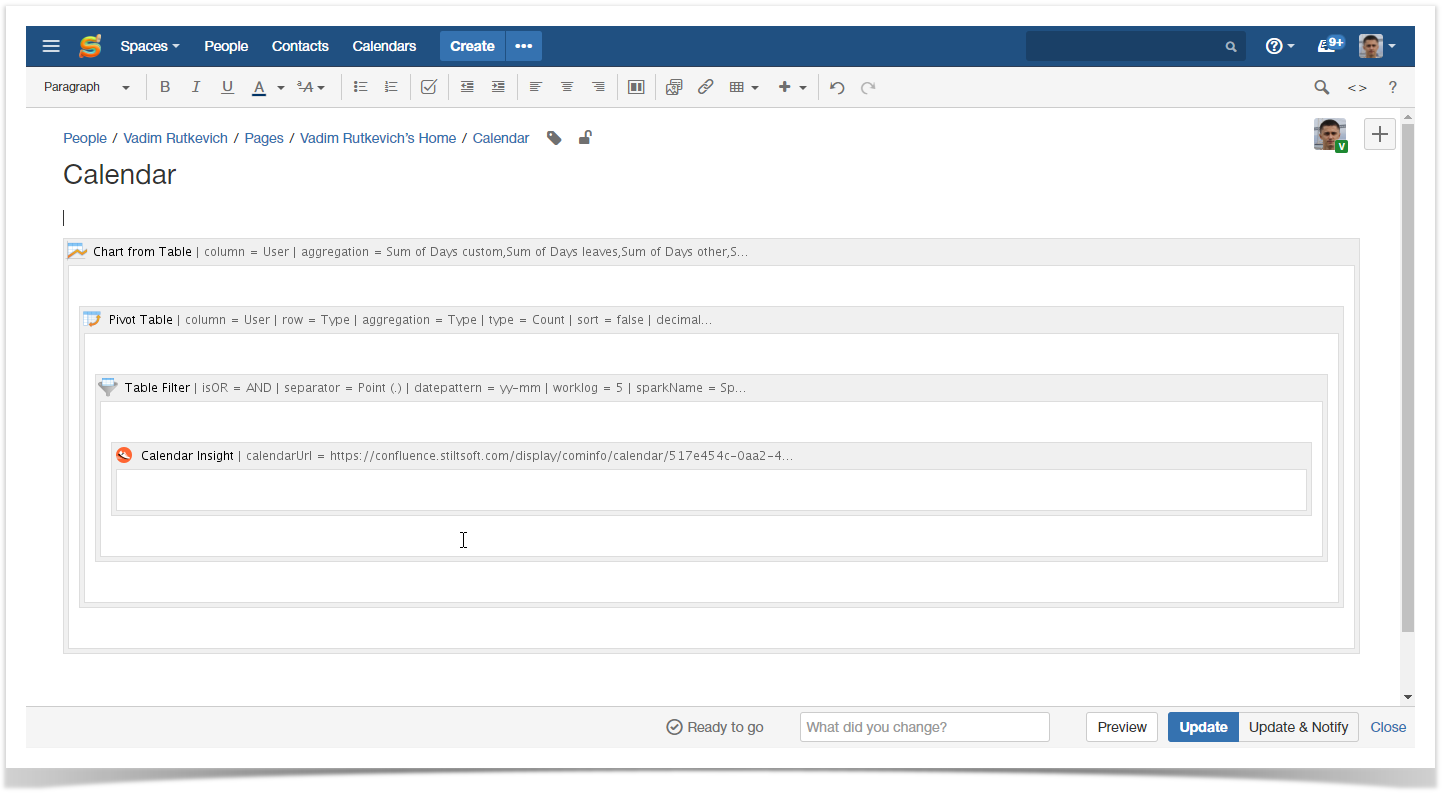
So let’s get started and see the breakdown of calendar events by type for this year. For doing this, you need to place our Calendar Insight macro within the Table Filter, then within the Pivot Table, and, finally, within the Chart from Table macro on the page.
As the result, you should have something like this on your Confluence page.
After saving the page, let’s proceed to building our pivot table and visualizing it with the column chart.
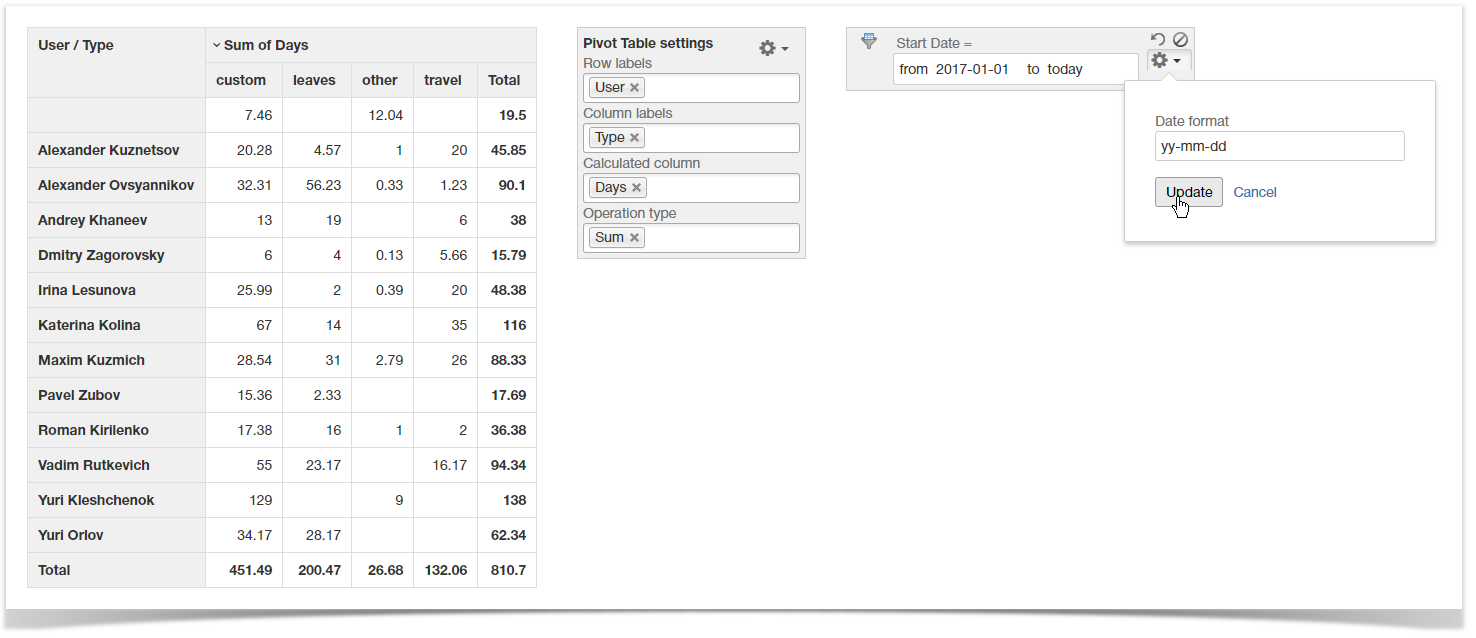
First of all, we need to limit the data for this year, so we are adding a date filter and pick the correct date format. The start date is set as January 1, 2017 and for the end date we will use the dynamic parameter ‘today’. The end date will change every new day, so all the time we will deal with the actual data.
After doing this we proceed to building a pivot table. As we want to see aggregation against users in breakdown by type we need to do the following:
- Row labels – select the User column.
- Column labels – select the Type column.
- Calculated column – select the Days column which stores the duration of events in days.
- Operation type – select ‘Sum’.
After doing all manipulations you should receive something like this:
Now it’s high time to visualize this information with the column chart. On the chart control panel, select the columns of the pivot table with aggregated values. Then choose the Column type and adjust its dimensions. And here’s our chart showing people who prefer working at home.
Visualizing dynamics of leaves and work at home
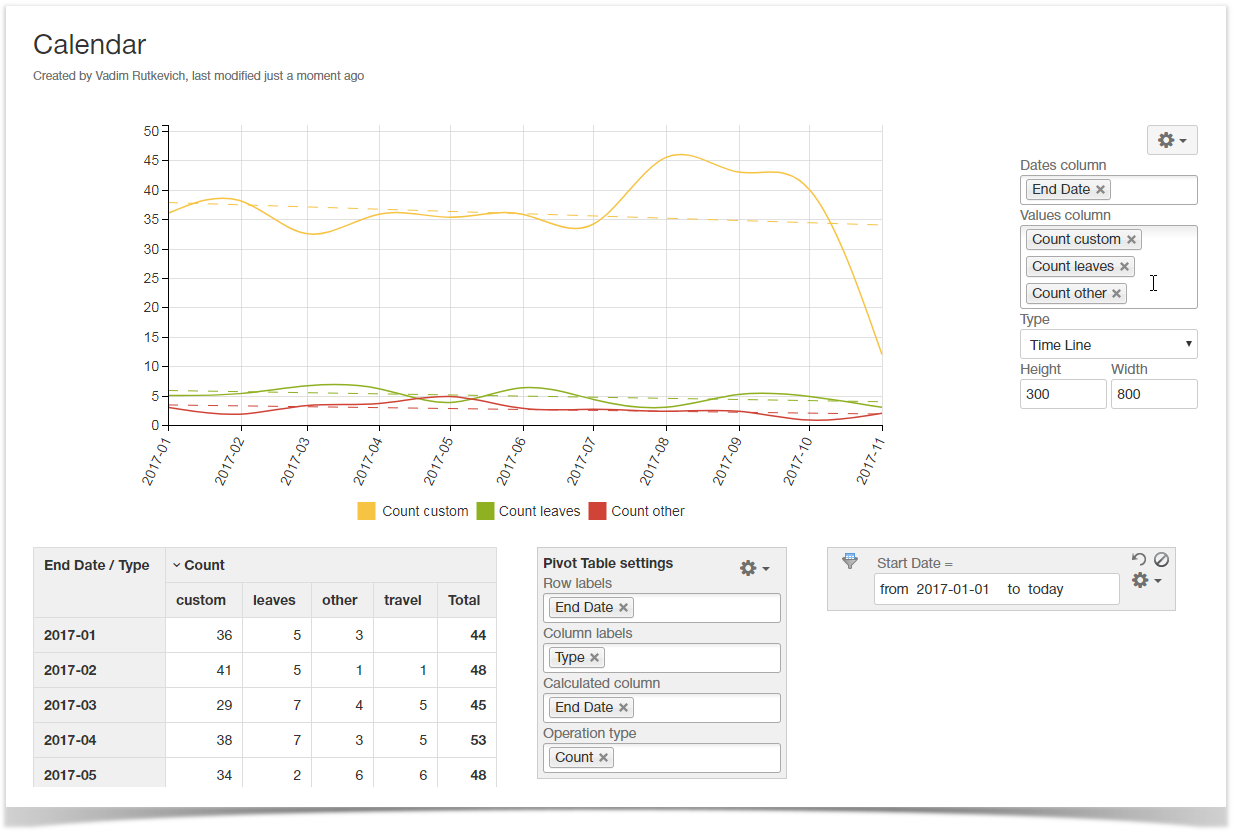
Now let’s identify the dynamics of leaves and work at home events added during this year. This information will show us whether there are problems with office visits that may have negative impacts on the team performance and communication between members.
The reporting period we leave the same, there is no need to change anything in the filtration parameters.
Let’s build a new pivot table, as follows:
- Set the End date column as a row label.
- Select the Type column as a column label.
- Use the End date as a calculated column.
- Choose Count as an operation.
- Save the modified configuration of the pivot table.
Now let’s change the date aggregation period to see the statistics for months. You need to edit the page and edit the Pivot Table macro. Here on the Options tab, locate the Date period aggregation option and select here ‘Month’. Save the macro.
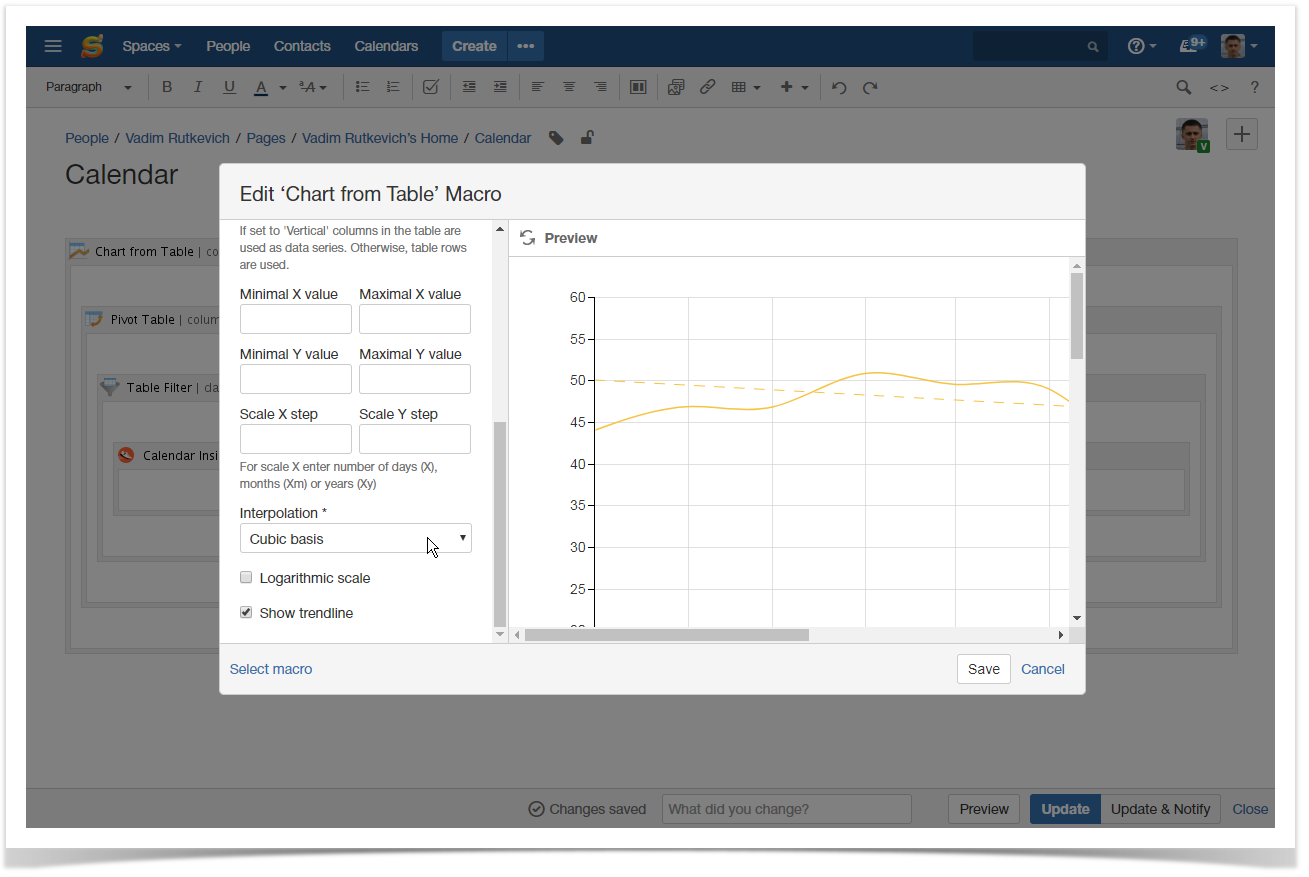
As we plan to view the dynamics of data movements, you need to edit the Chart from Table macro too. Here on the Adjustments tab enable the Show trendline option and select the ‘Cubiс basis’ as the interpolation mode to make the charts looking smooth.
After saving the macro and the page add the required data series for chart generation.
You can go further and add users into the pivot table. This way you can view dynamics for specific users and perform the targeted adjustments to avoid problems with the team integrity in future.
Just a start…
This blog post just introduces a use case that the Table Filter and Charts app can cover. But the sphere of applicability is not limited to analysis of calendars only. Take a quick look at our series of video tutorials featuring different use cases of filtering, aggregating, and visualizating table data in Confluence.
Feel free to share your impressions or comment on the post below.


