How to Use Spreadsheets in Confluence

Meet Aimee, a savvy data analyst who loves using spreadsheets daily. Recently, Aimee’s company switched to Confluence Cloud, and she wants to complete her latest project directly in the Atlassian Ecosystem. Aimee agreed to organize and analyze data regarding the newest bunch of orders. She will further share this information with the project manager, who will use the data to proceed with the delivery planning. Aimee is a loyal spreadsheet fan and loves to work both hard and smart. After spending some time in Confluence, Aimee found herself longing for the spreadsheet functionalities and familiar Excel-like environment.
If you, like Aimee, lack the potential of Excel or Google Sheets while working in Confluence, the Table Spreadsheet macro will soon become your go-to. With its help, you can:
- Embed the spreadsheet into your Confluence page and edit it in view mode.
- Customize table cells, borders, and text.
- Filter the table, aggregate data into a pivot, and create a chart.
- Use formulas and conditional formatting presets.
- Add multiple sheets if needed.
Let’s examine the Table Spreadsheet macro, the new feature of Table Filter, Charts & Spreadsheets for Confluence, and learn more about how it works.
How to Use the Table Spreadsheet Macro
So, Aimee’s task is to analyze spreadsheet data so that project managers can swiftly decide the most efficient way to deliver the orders and allocate the necessary resources.
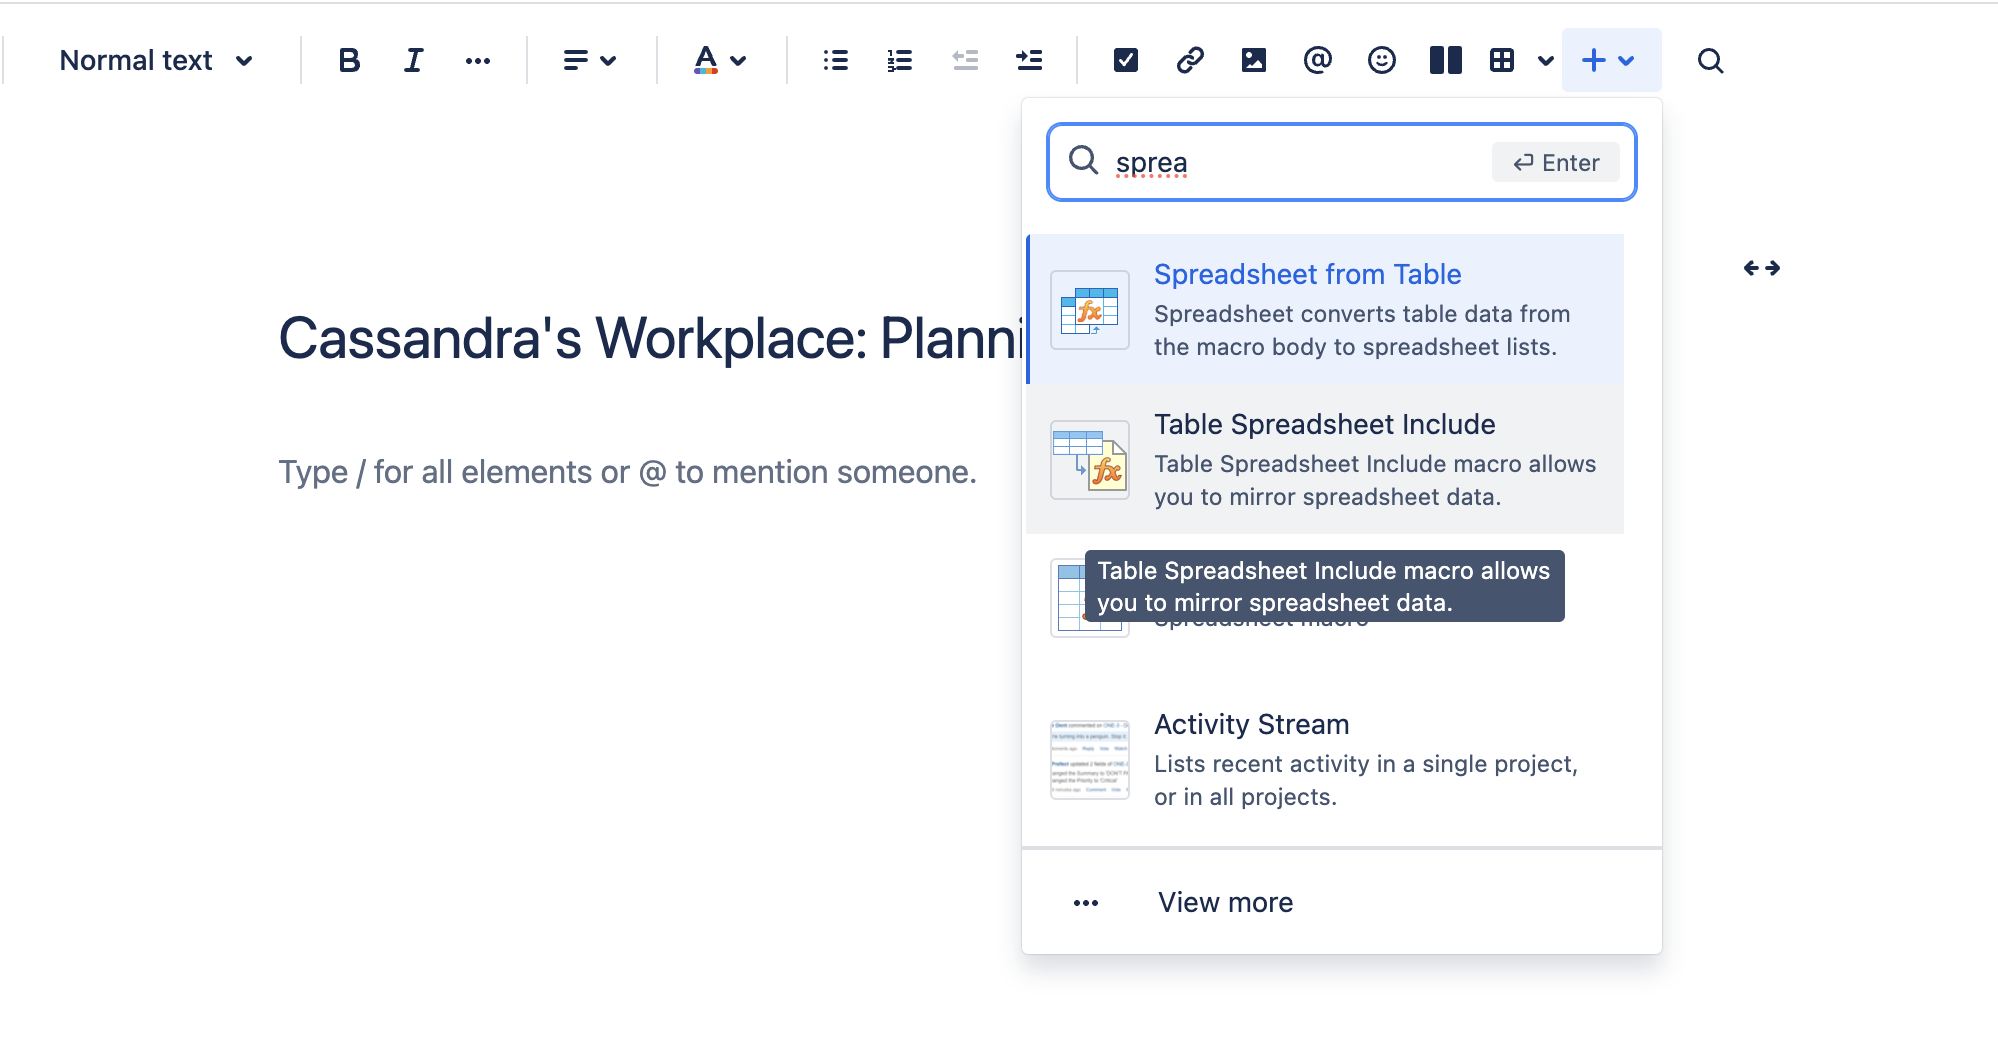
To add the macro, go to the edit mode. Type /Table Spreadsheet or click the Plus button on the top control panel, and select the macro.

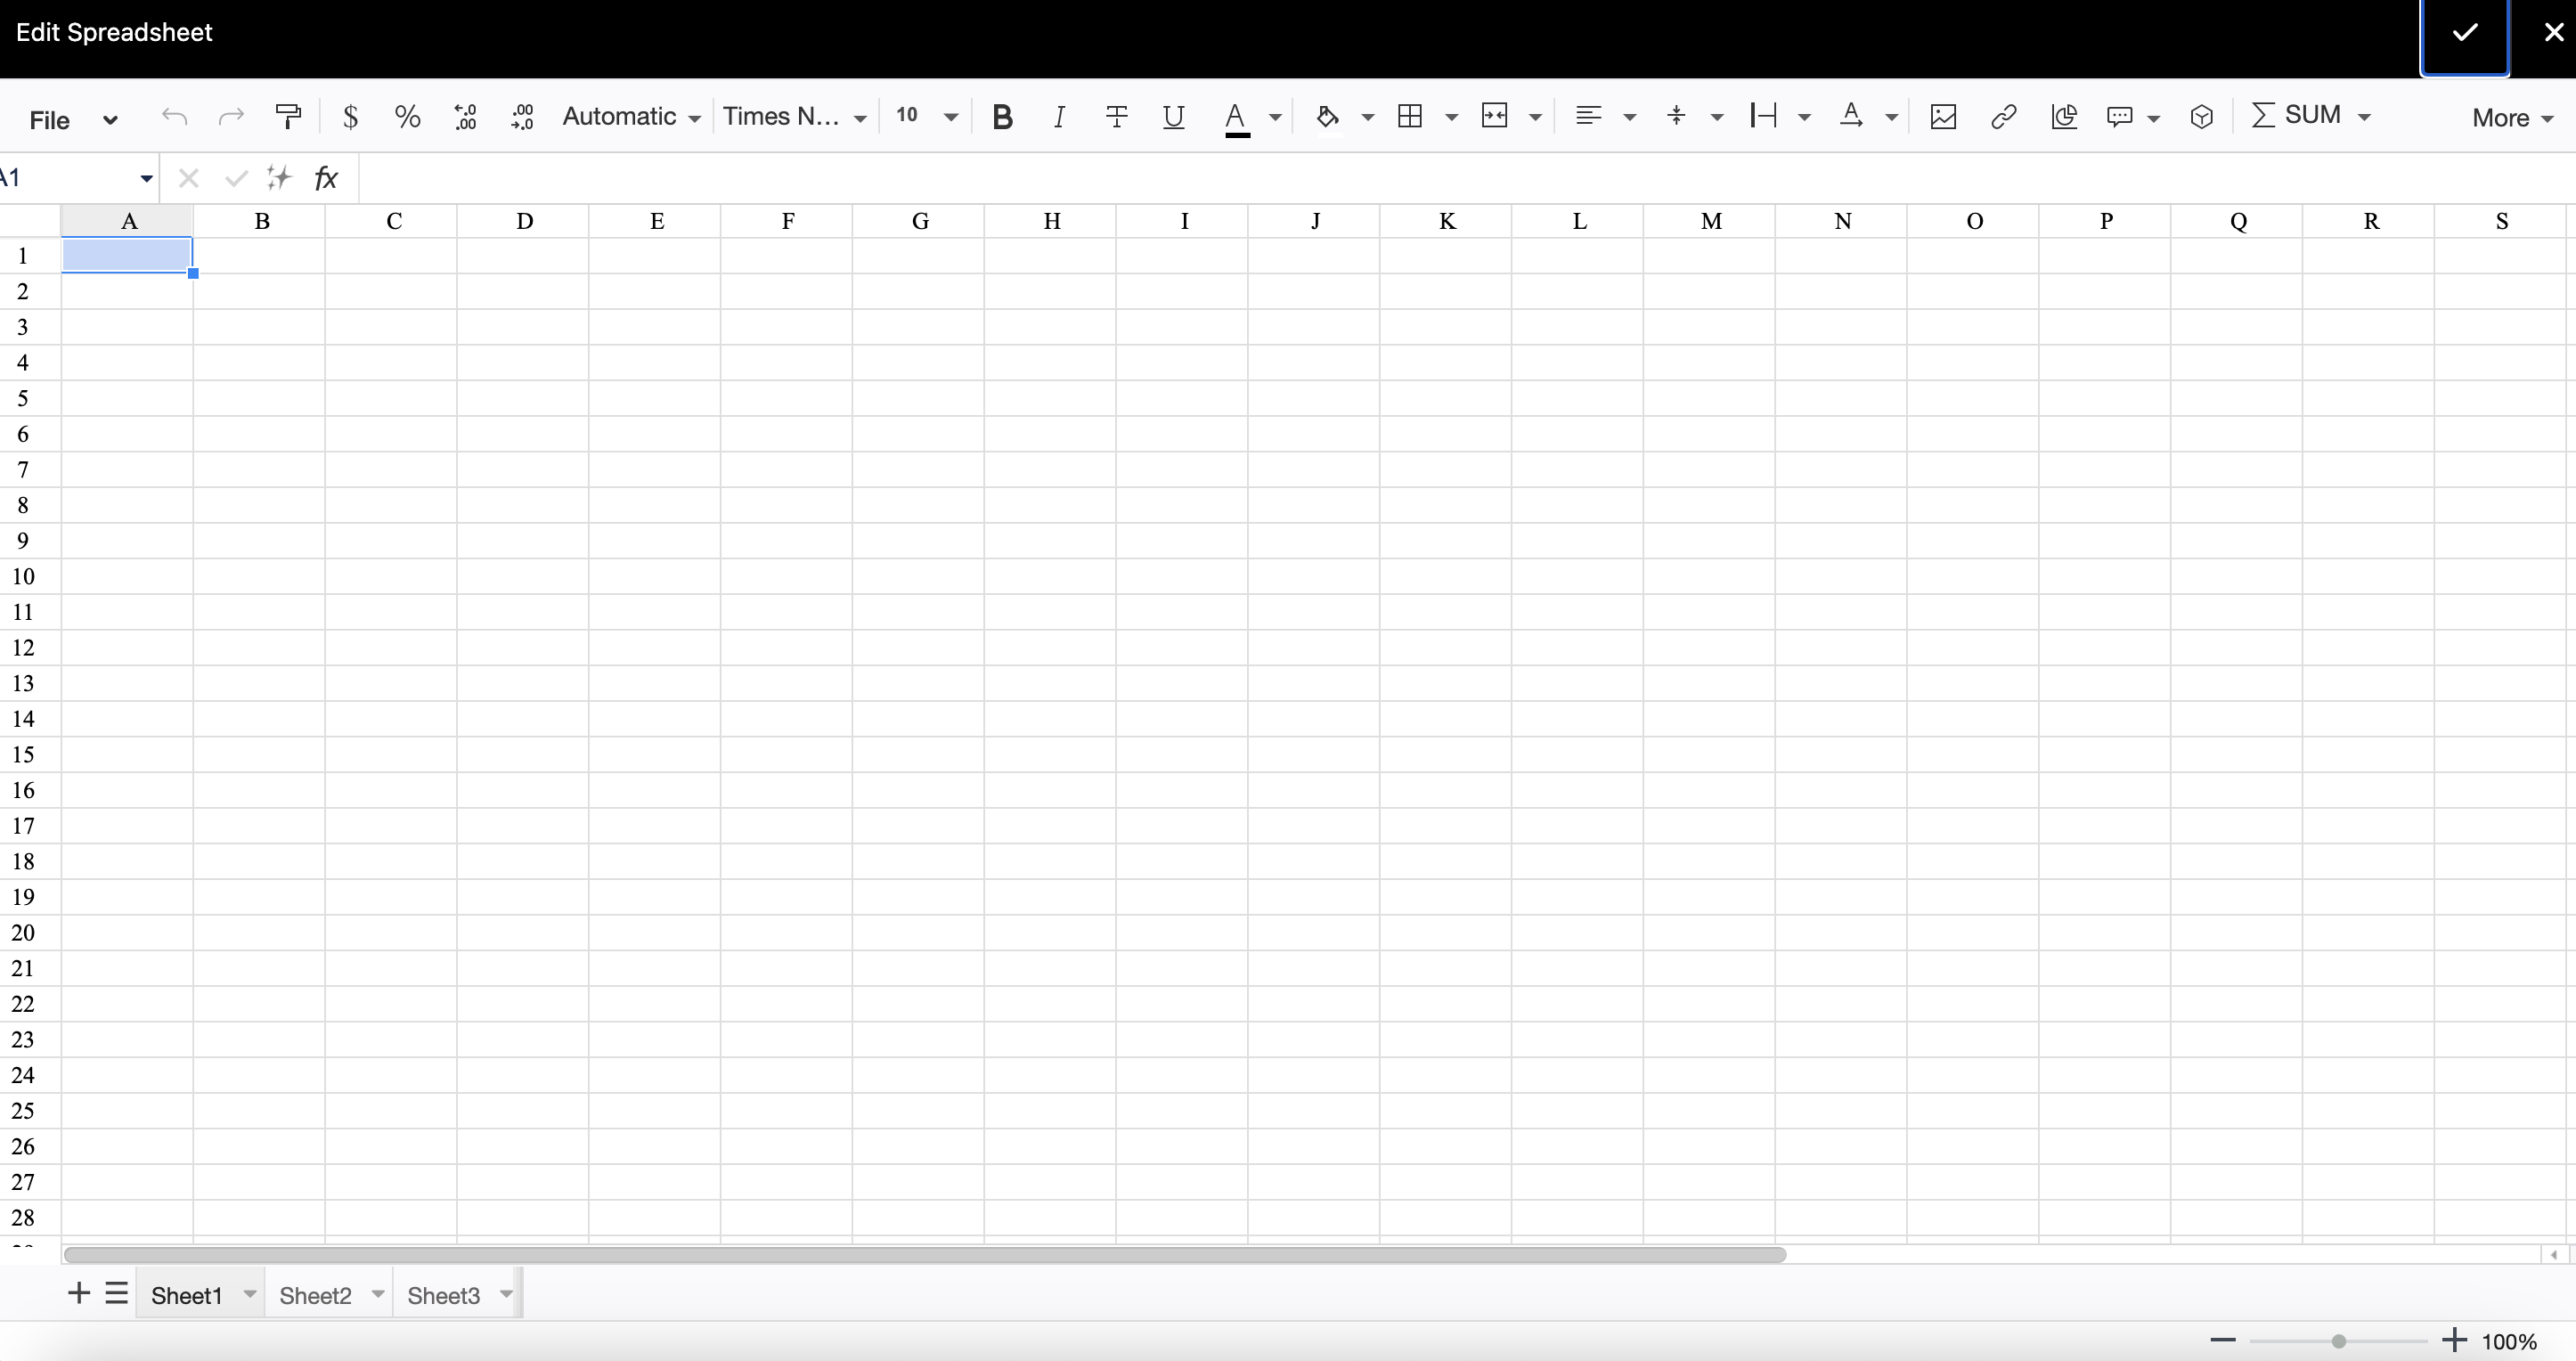
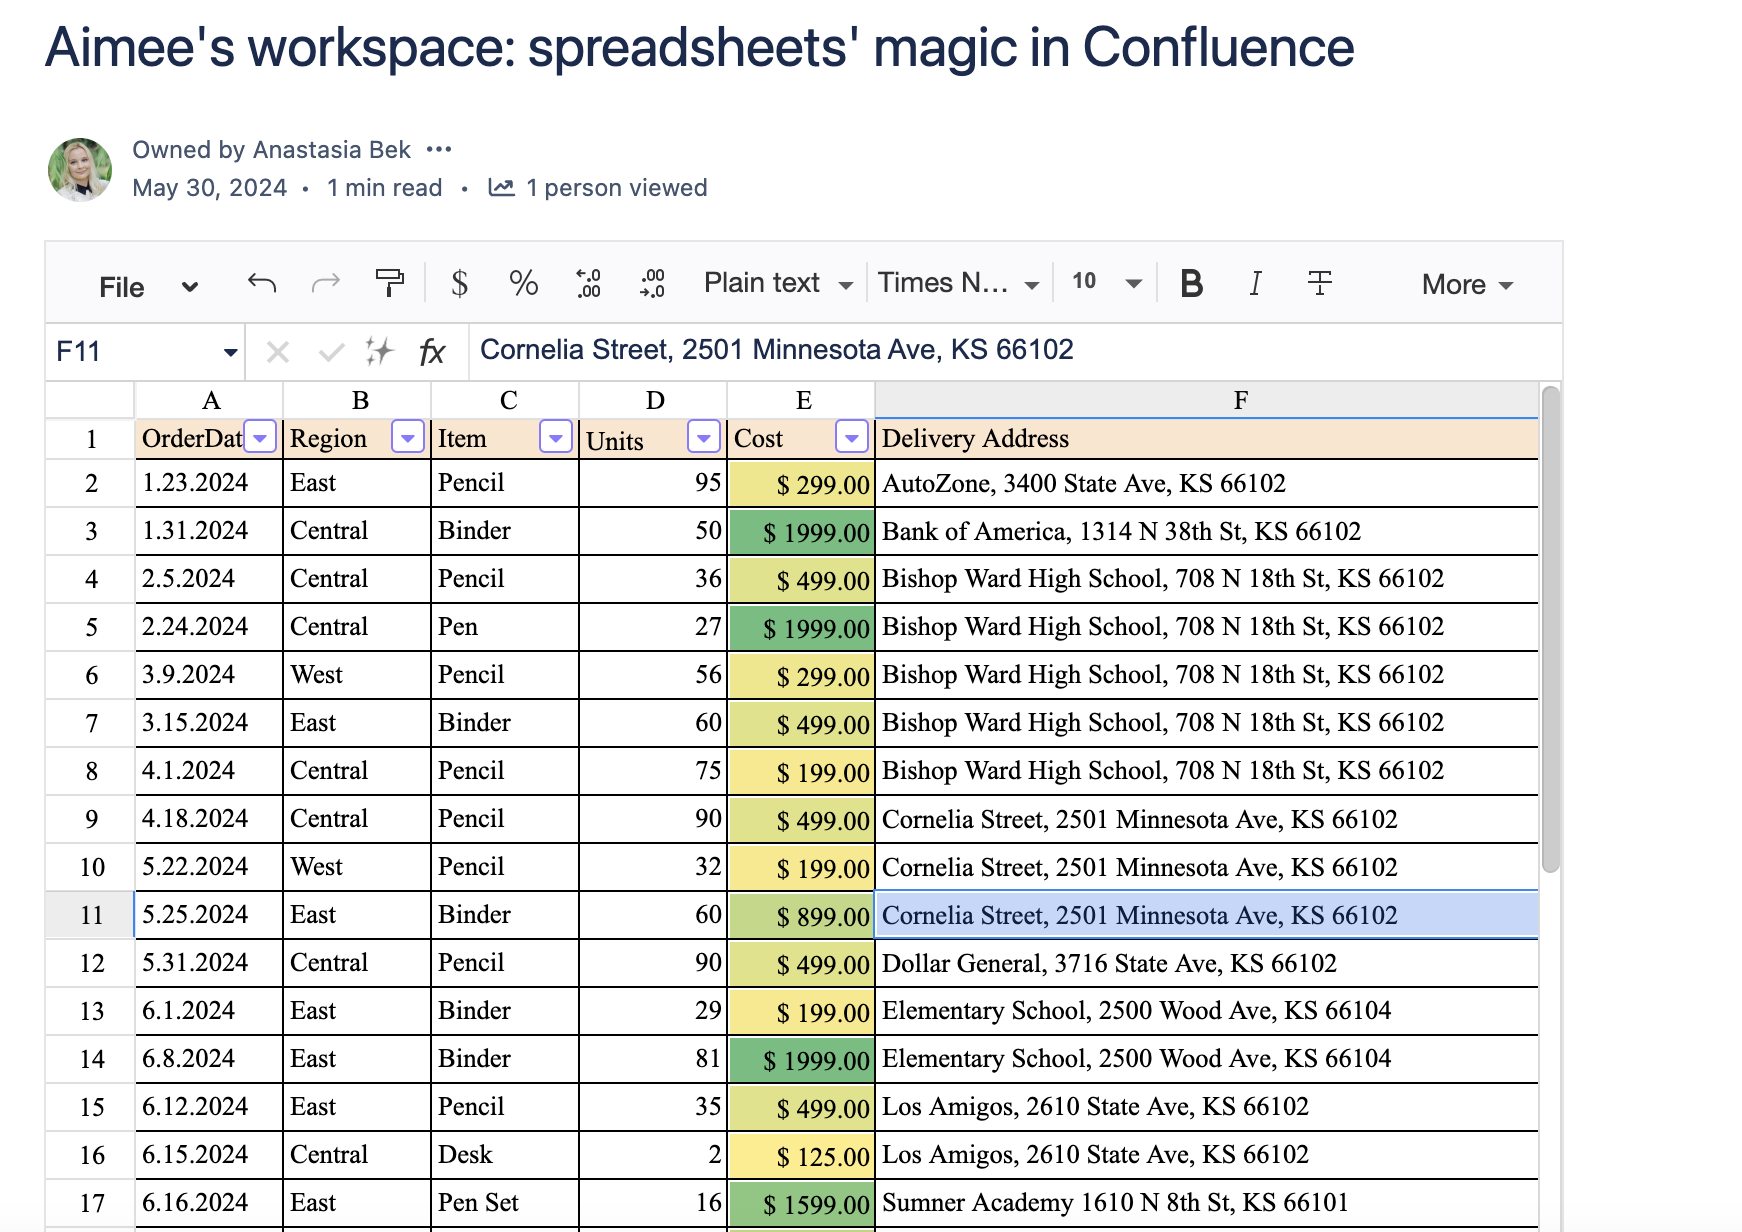
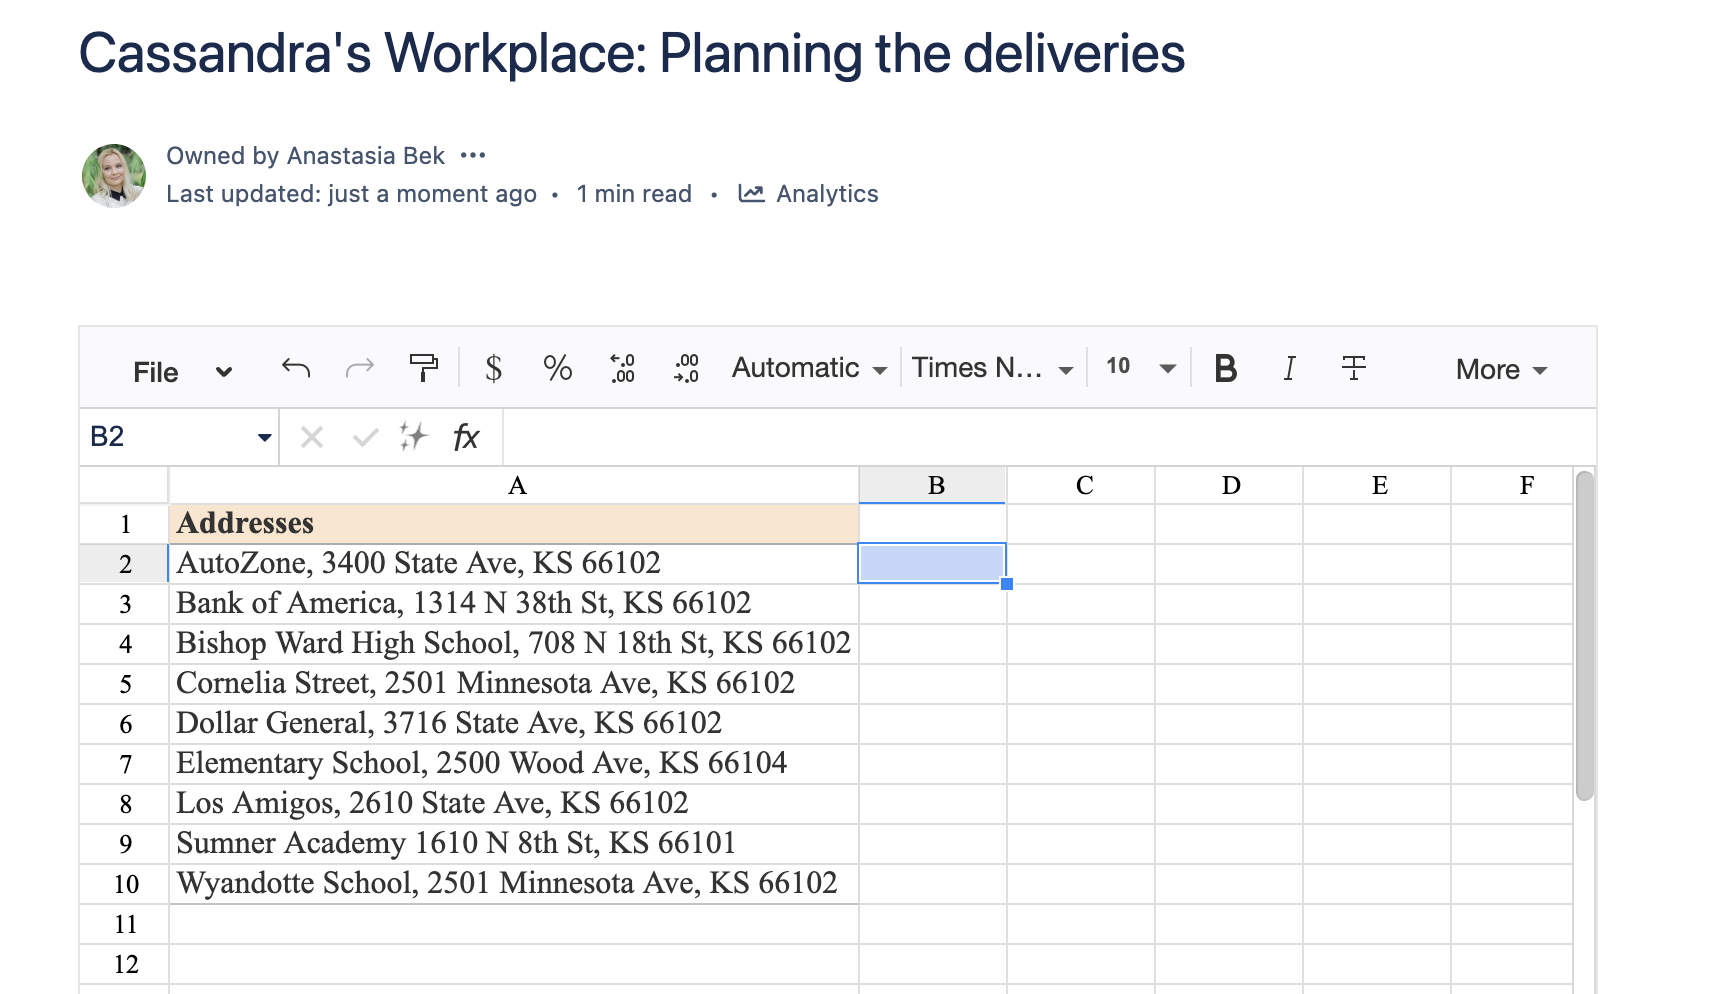
When the macro opens, you’ll see a new spreadsheet.
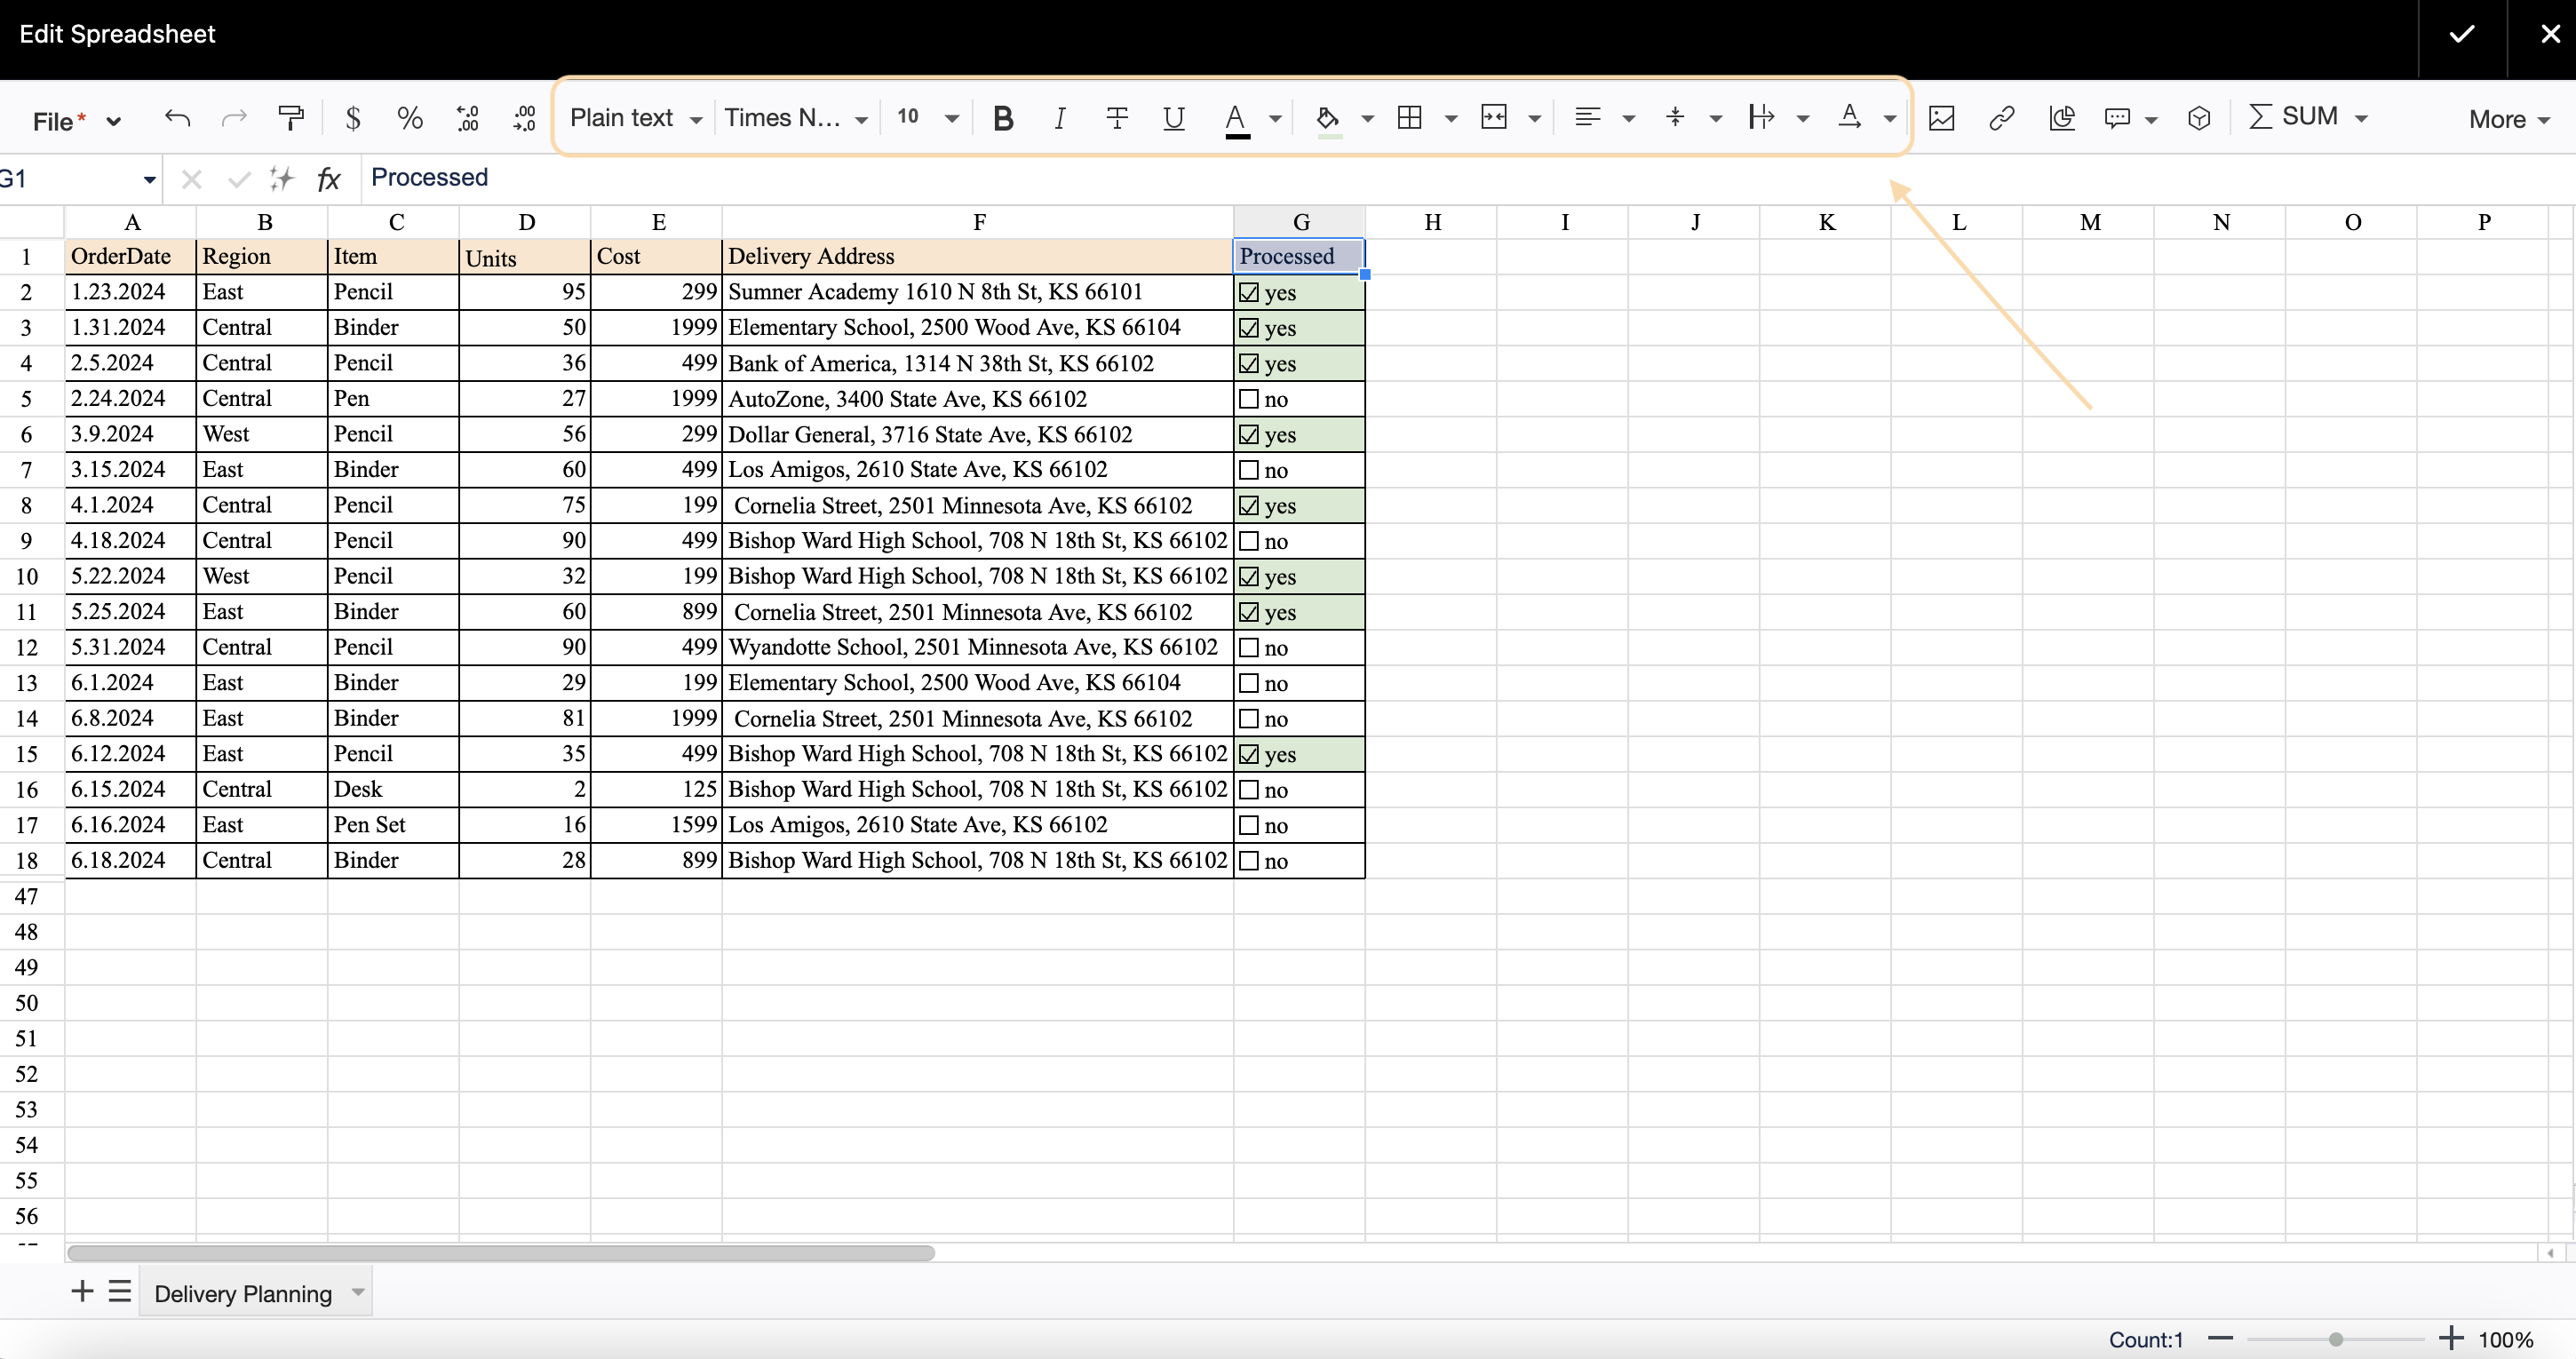
Now you can create your table:
- set table borders
- choose cell color
- freeze header row or column
- align the text
- choose the font and text style
- merge cells, if needed.
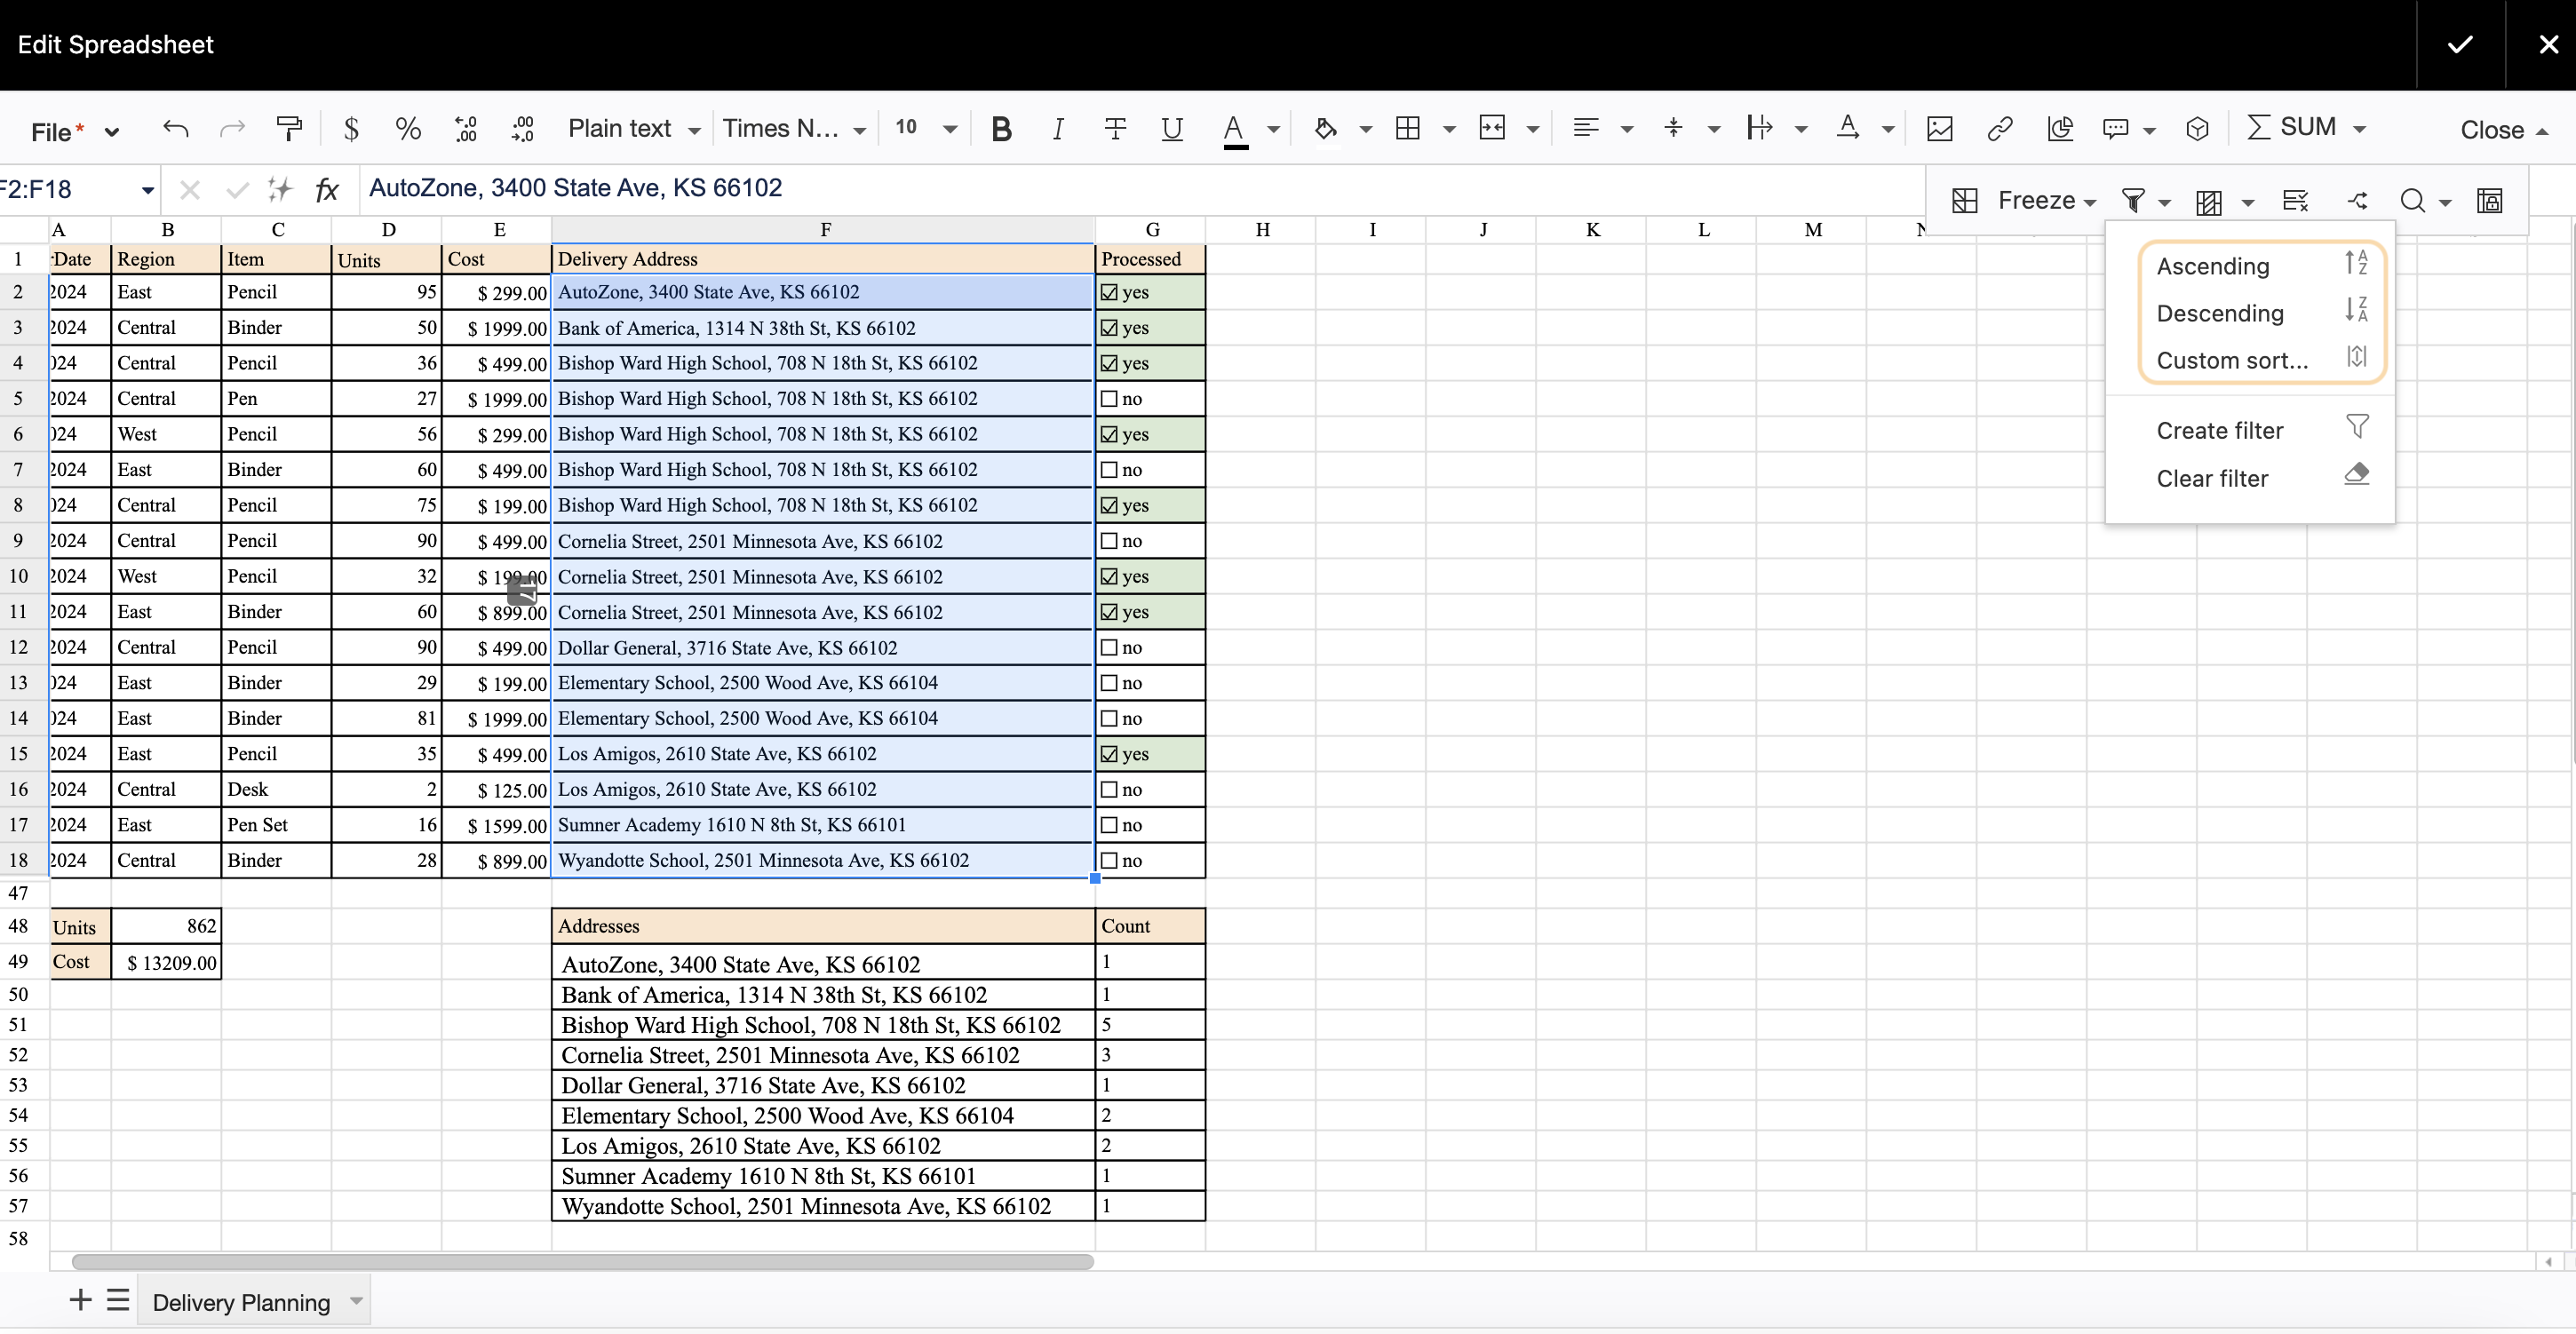
To sort the table, click the funnel icon in the editor pane. You can select ascending or descending sorting or customize your own.
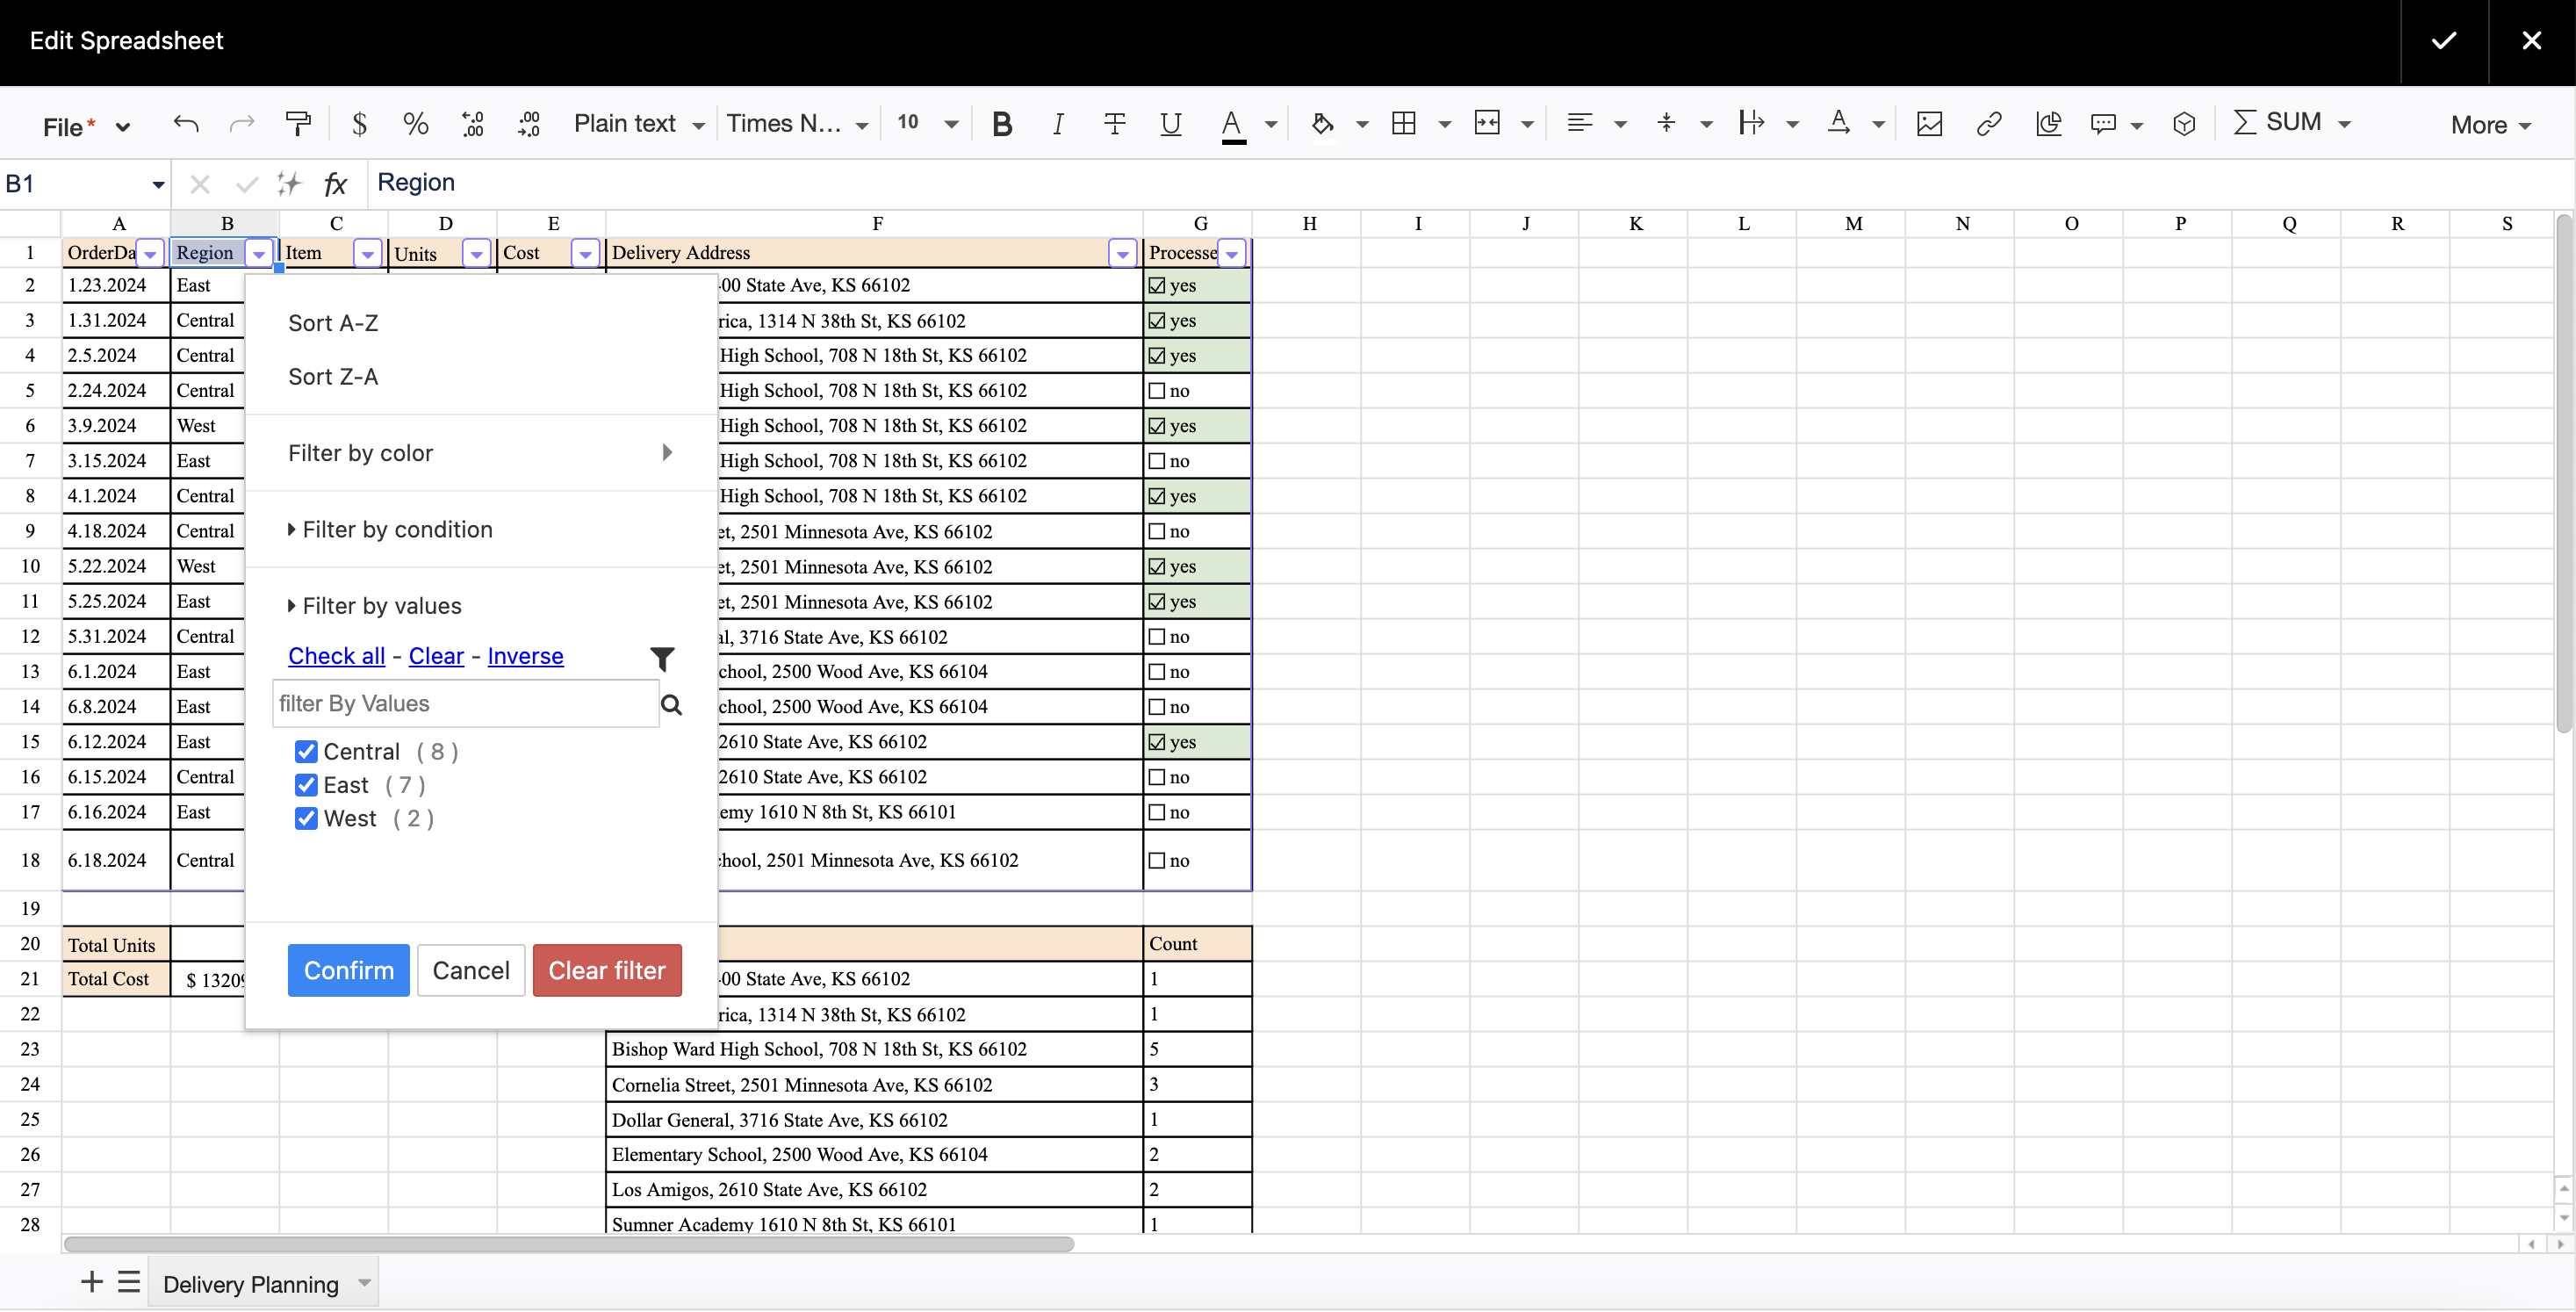
You can also enable table filtration here. You can filter by values and conditions and remove the filter when it is no longer needed.
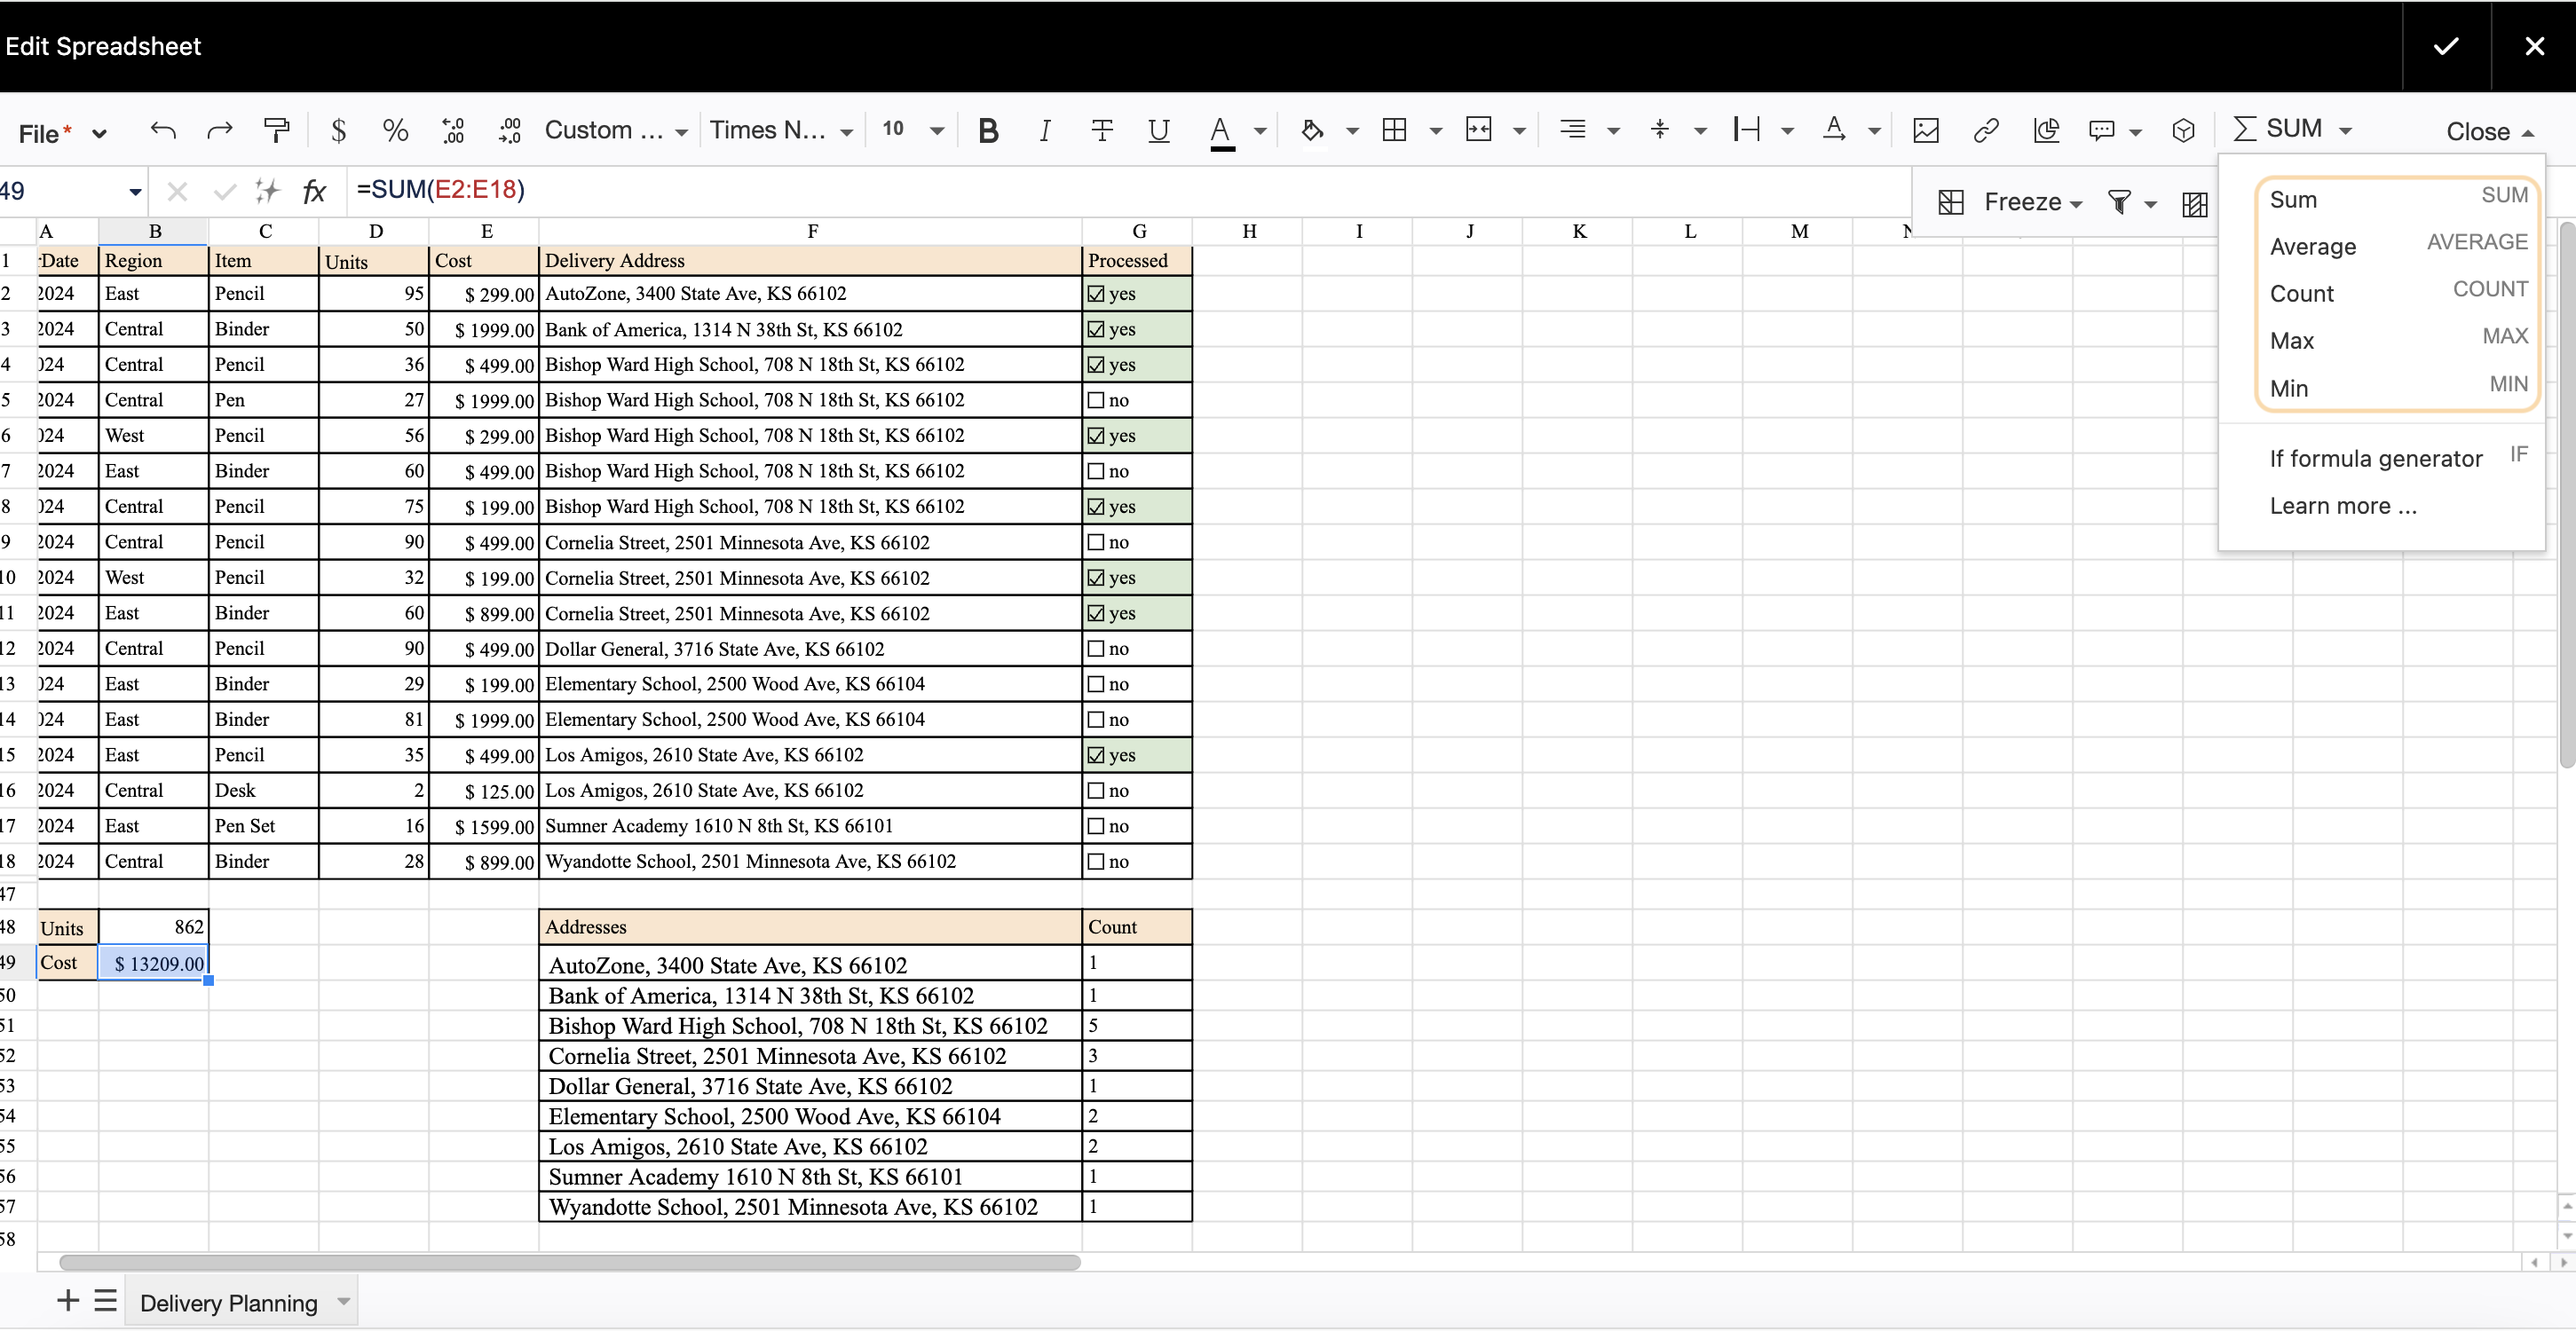
Add formulas to count table data automatically.
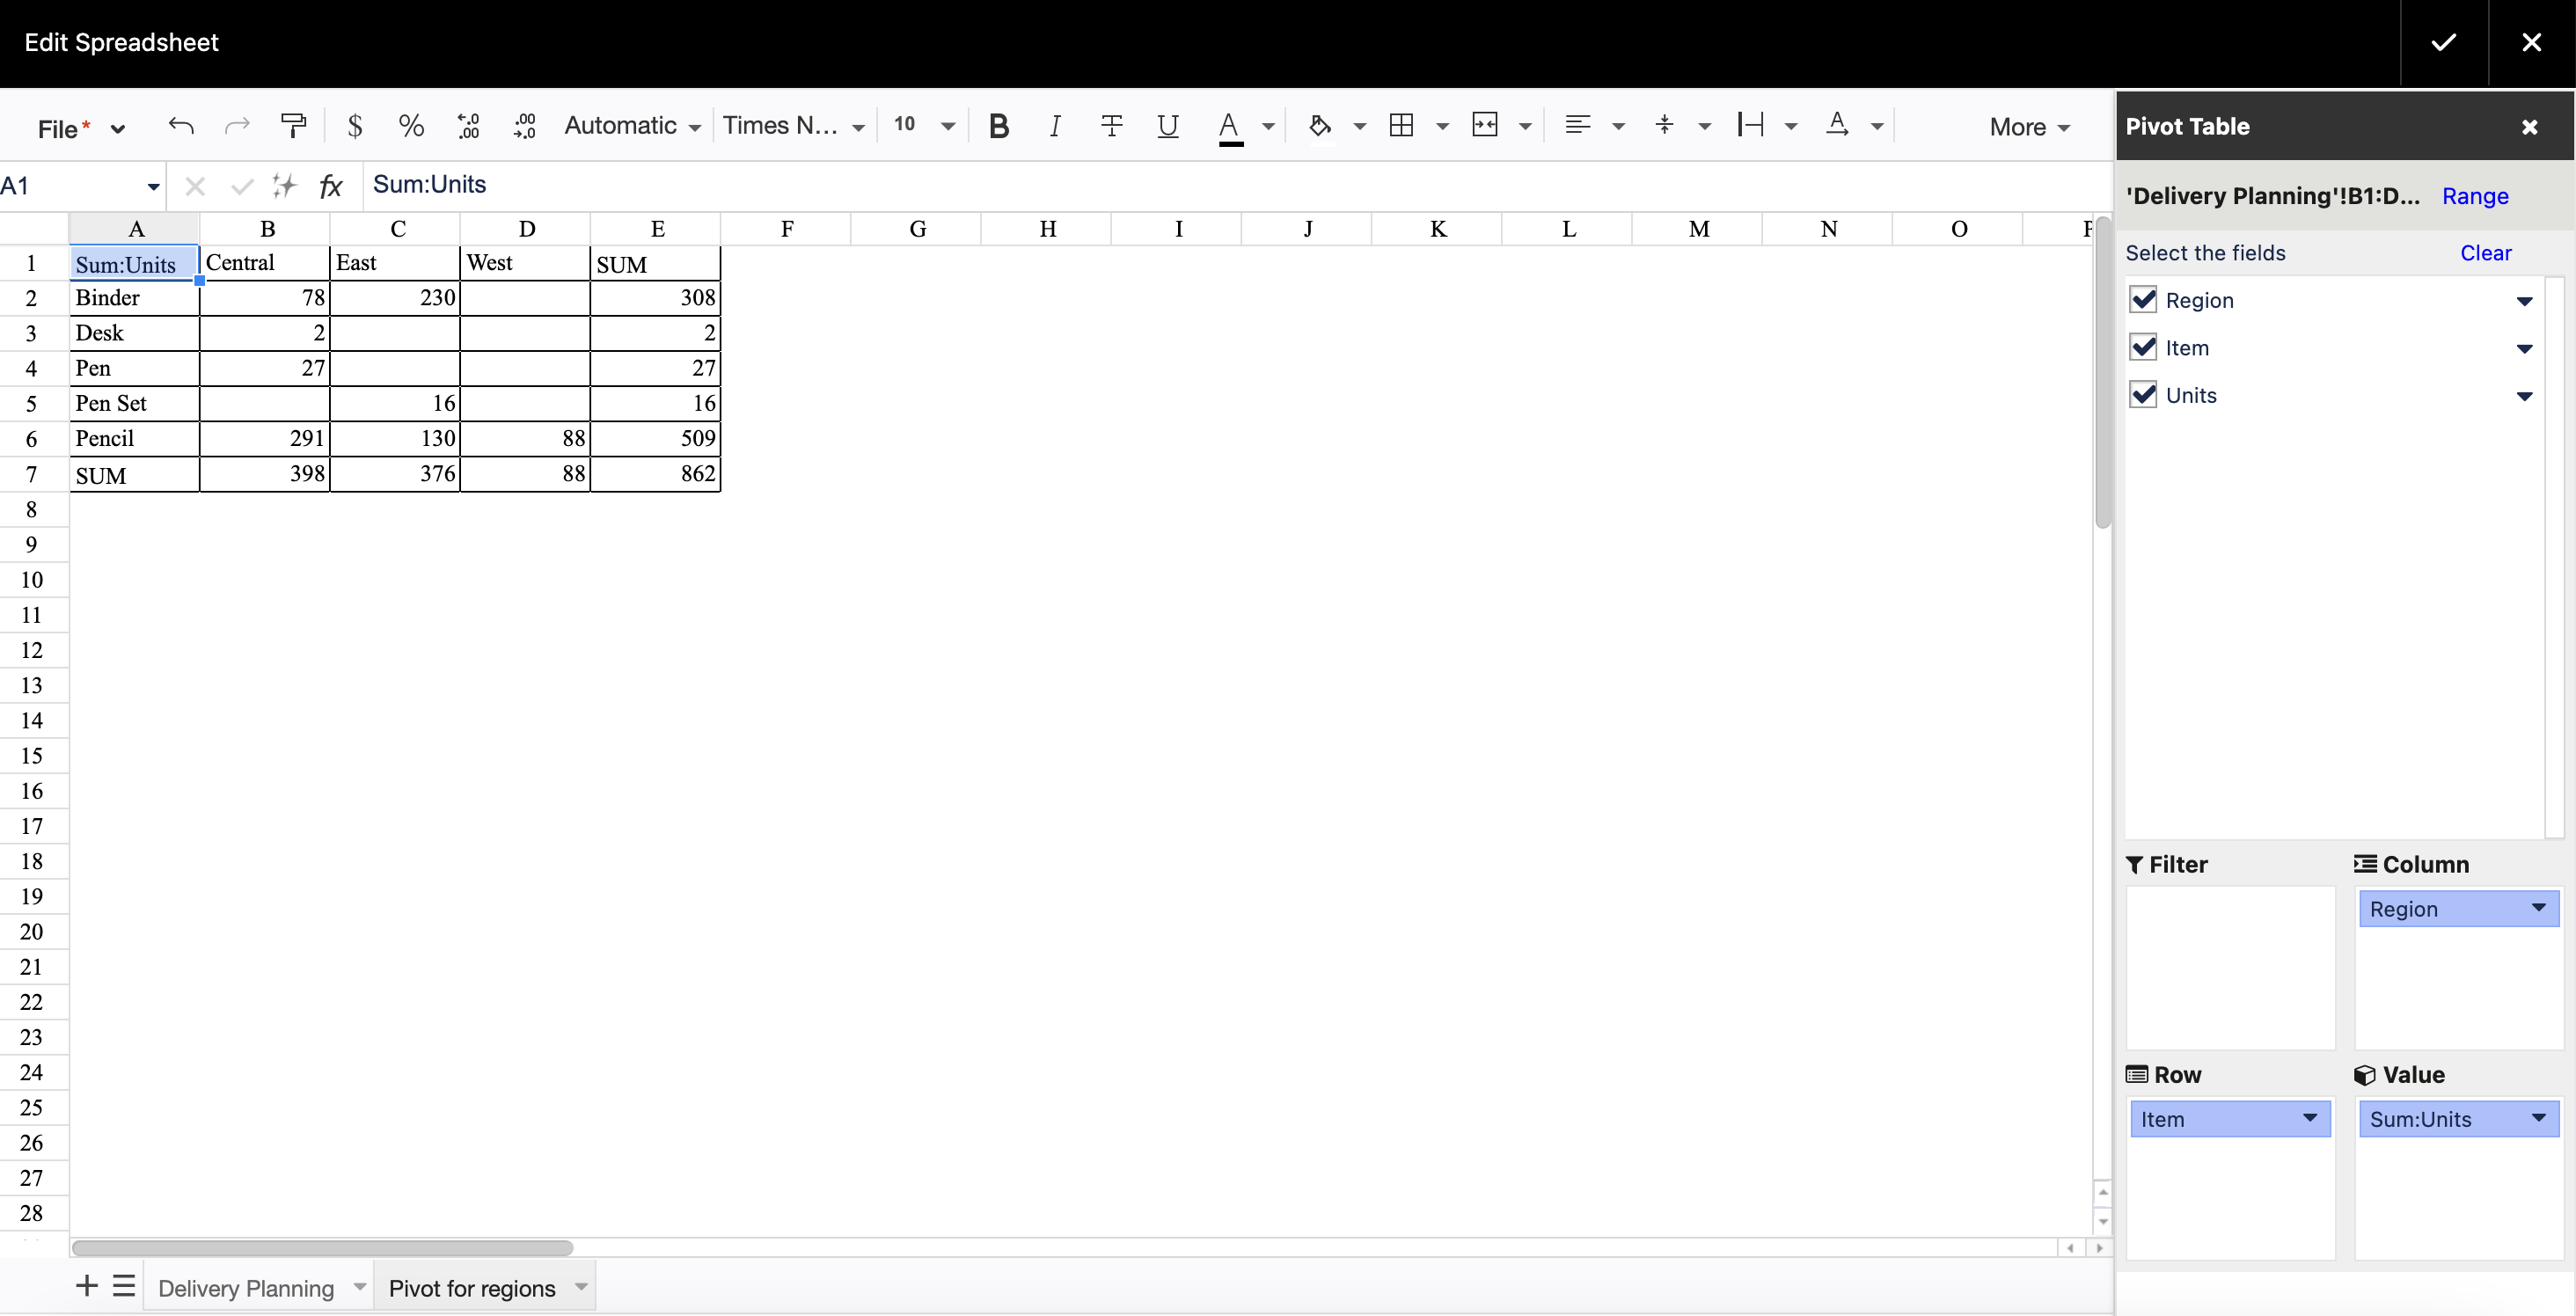
To add a pivot table, select the data range you want to aggregate. Click the button on the editor pane. It creates a new sheet with the pivot table settings. Place the chosen columns into corresponding spaces and select the type of aggregation.
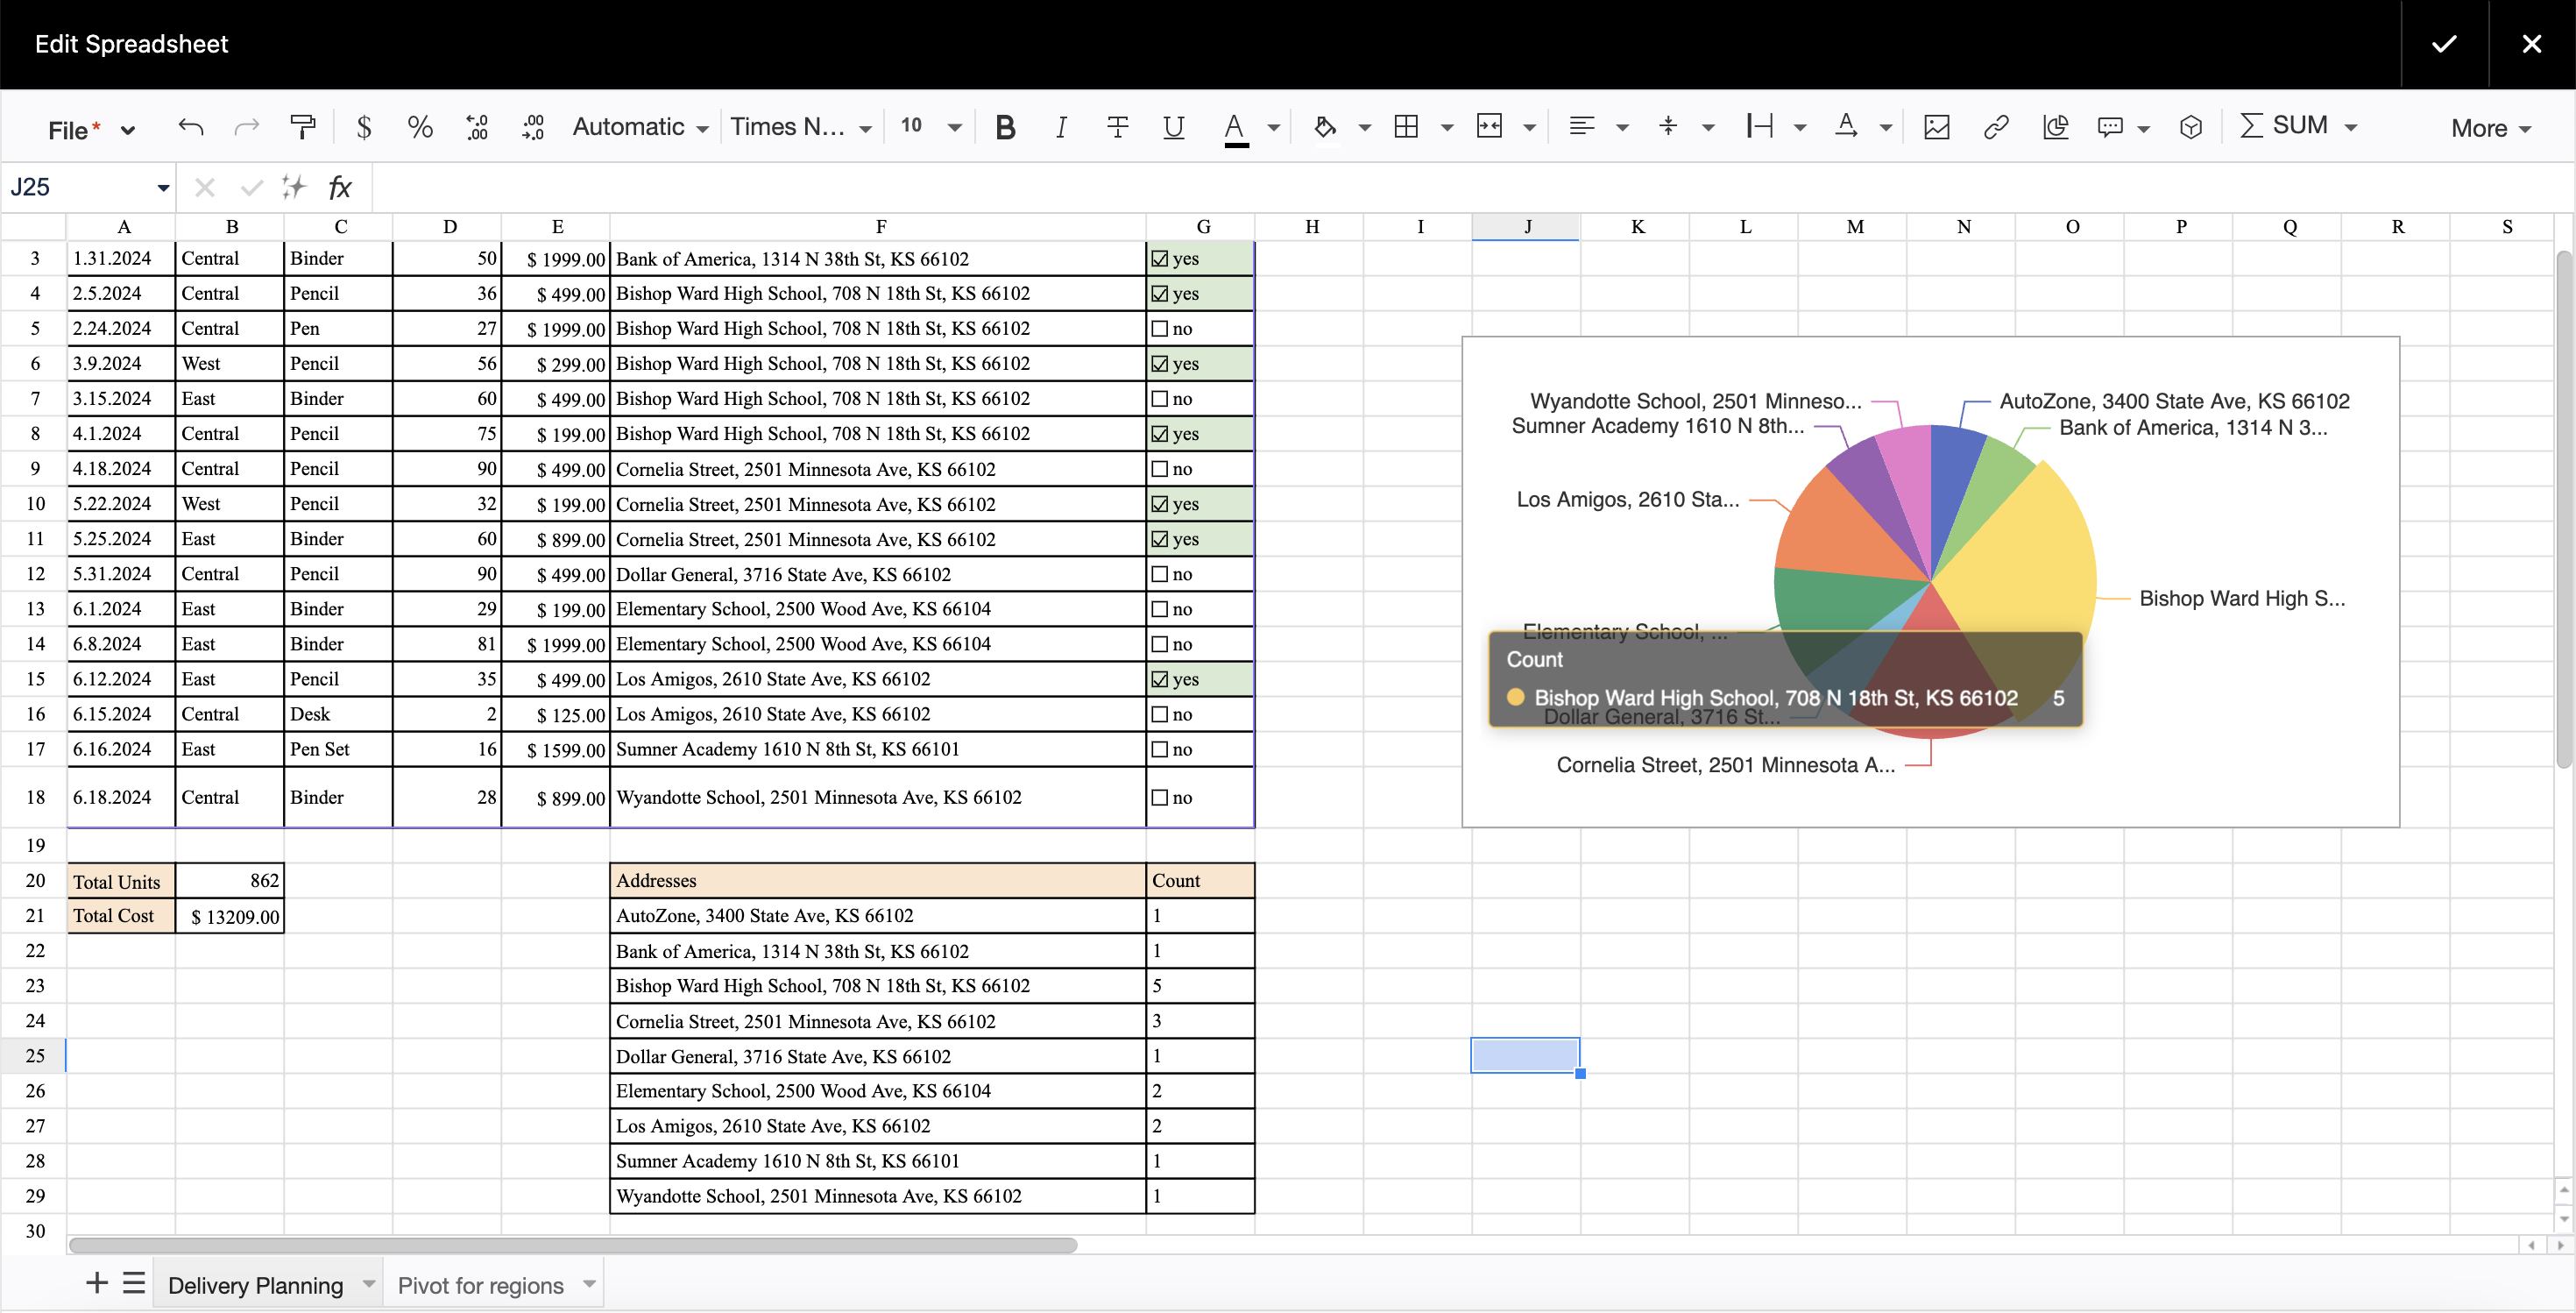
To add a chart, select the data range you need to turn into a chart. Next, click the Button on the editor pane. Select the chart type and choose the settings.
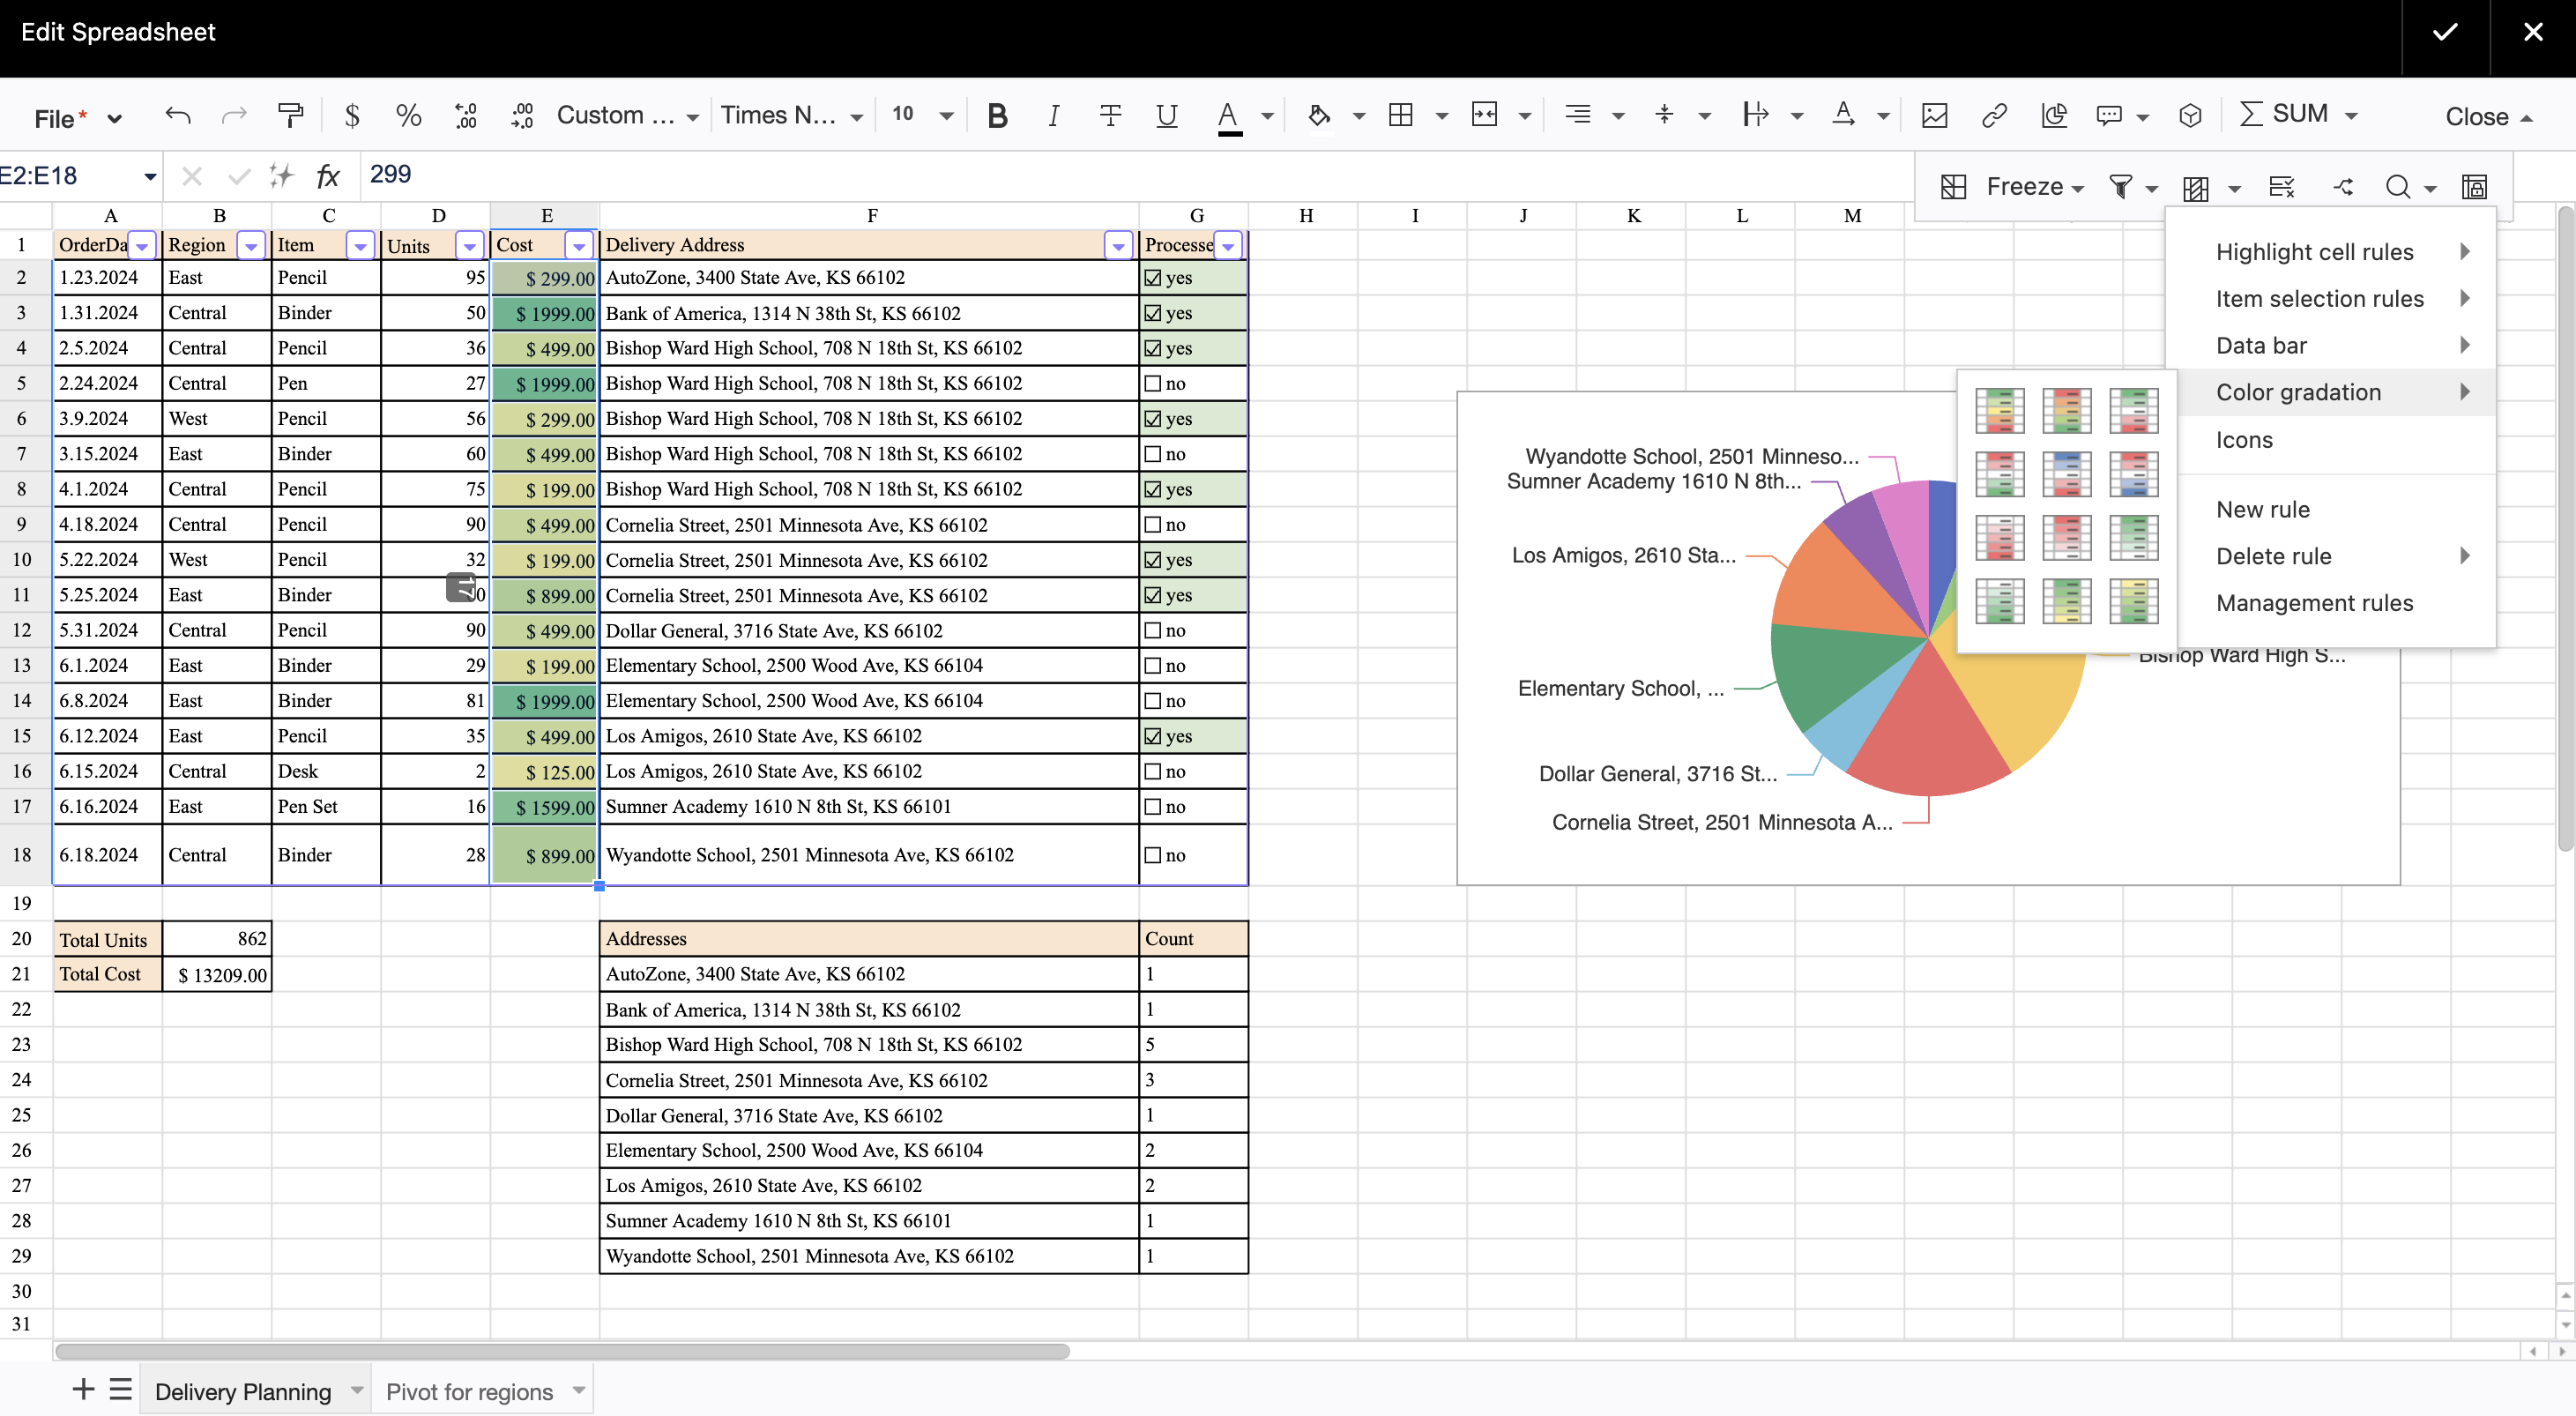
You can set up conditional formatting if you want to highlight the cells depending on their values. Click the Button on the editor pane and choose a suitable formatting preset. You can set your own formatting rules if you want.
After you finish editing the spreadsheet, save the macro and the page. You can then edit the spreadsheet in view mode.
How to Use the Table Spreadsheet Include Macro
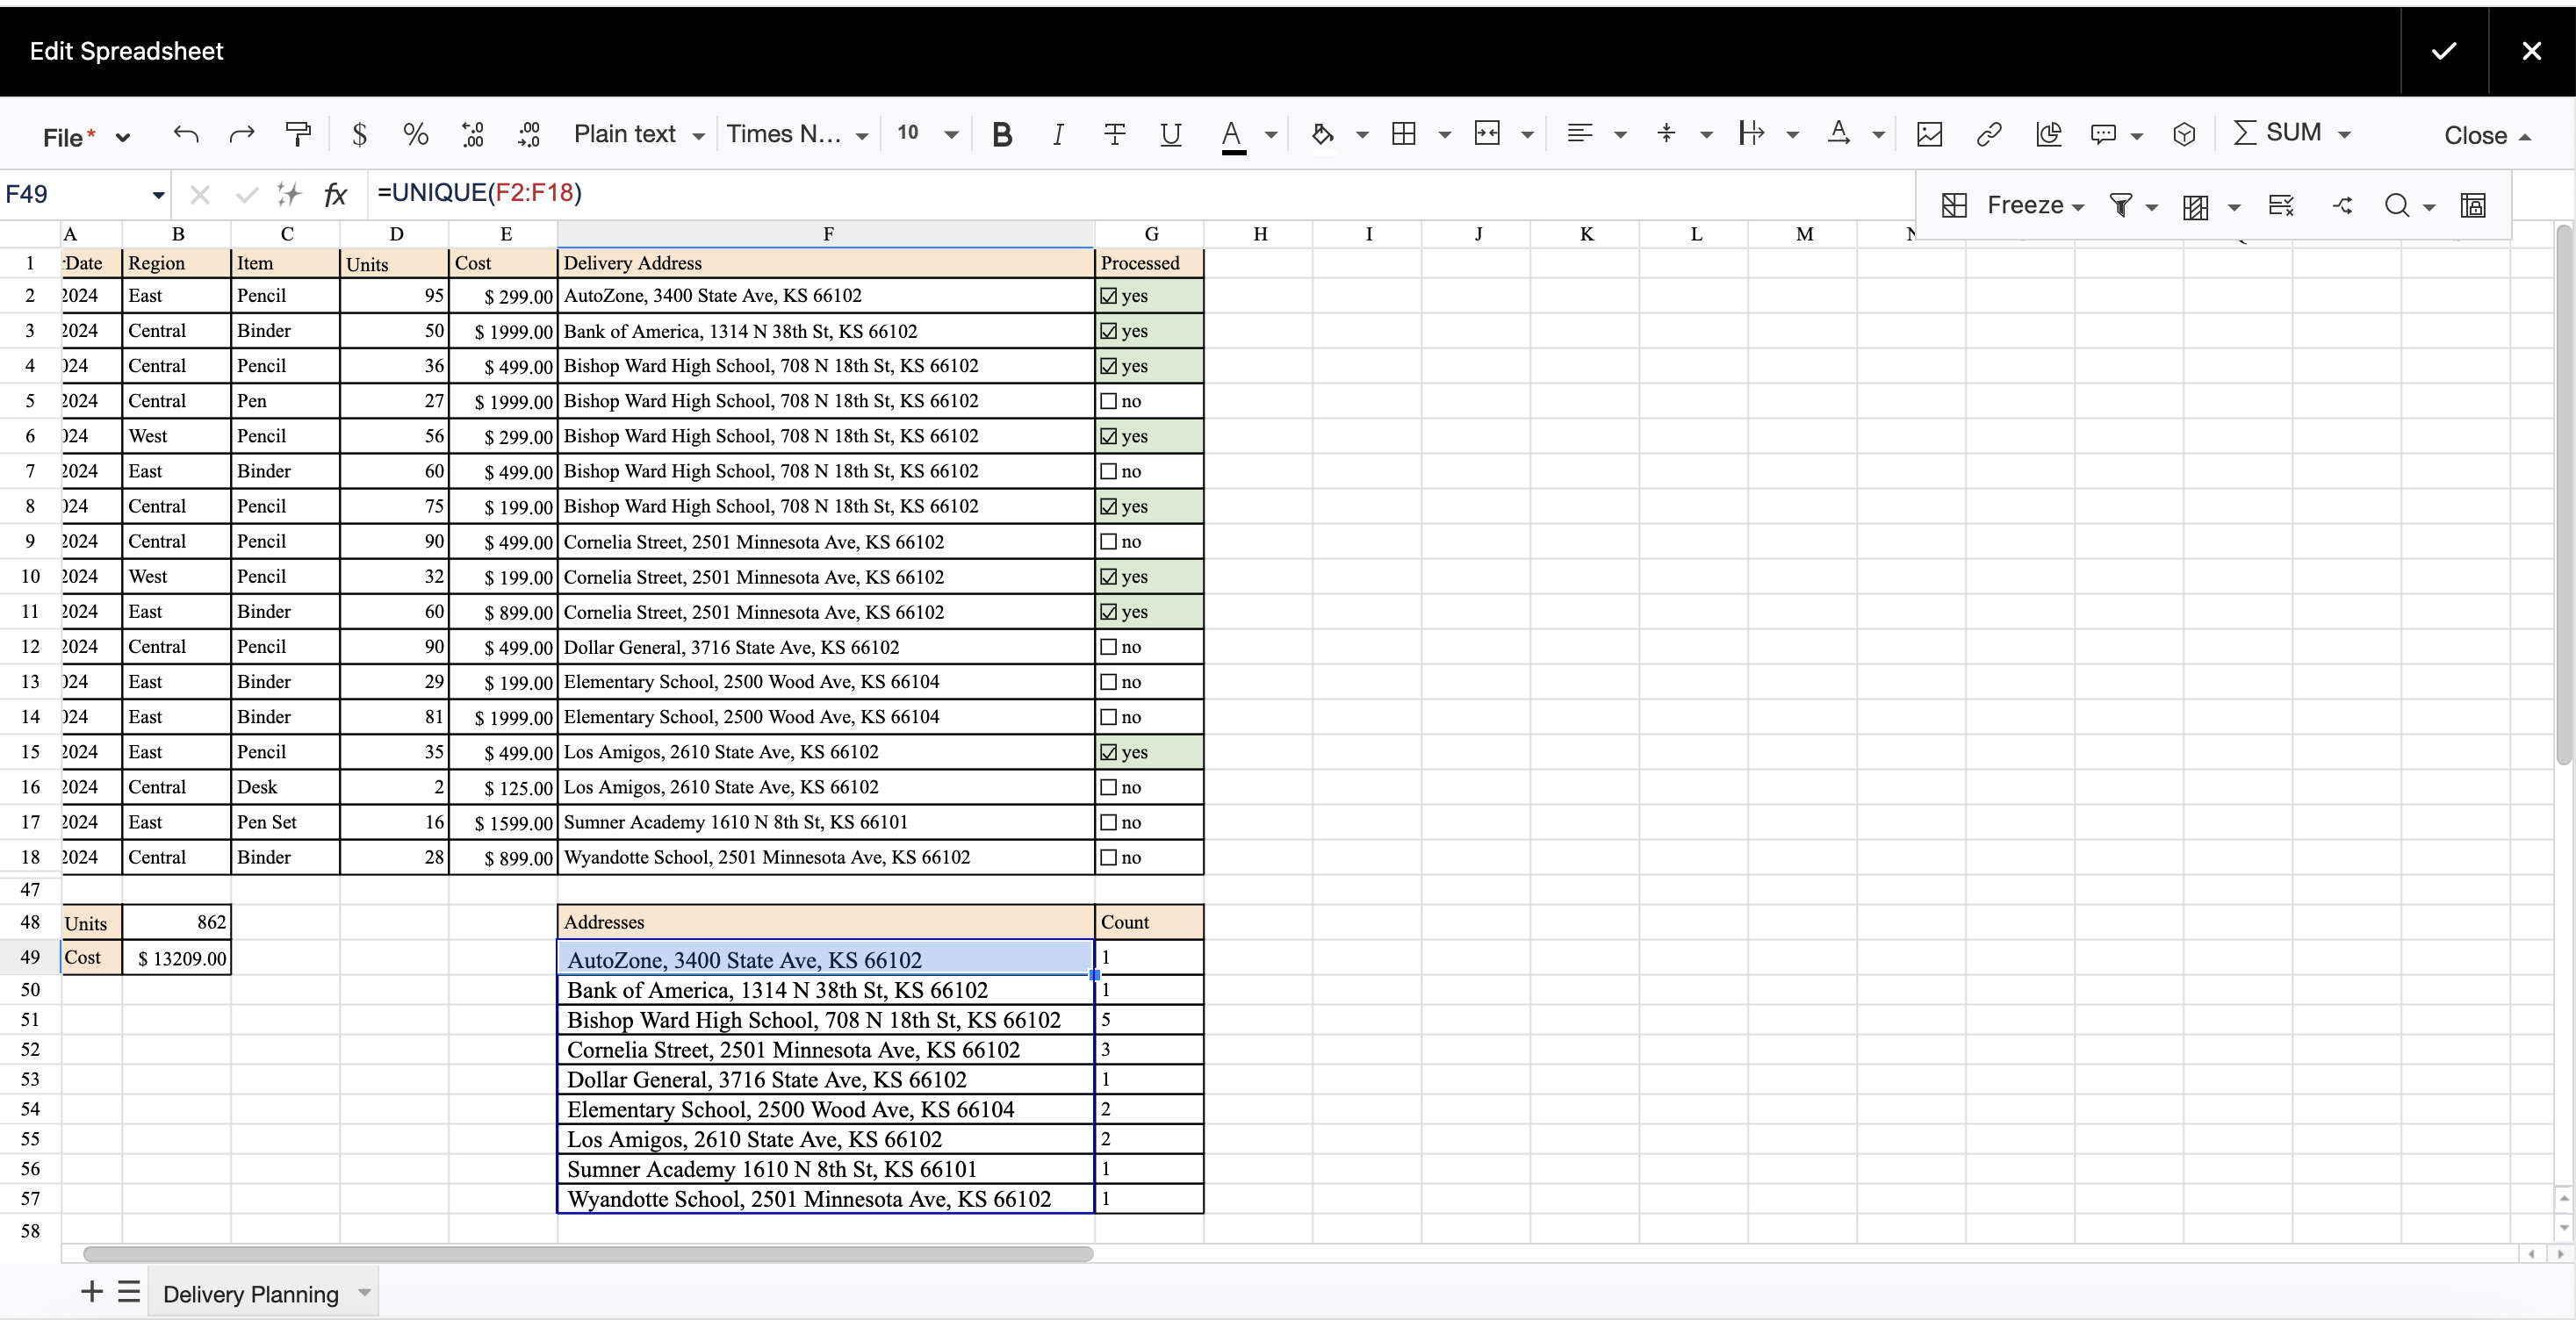
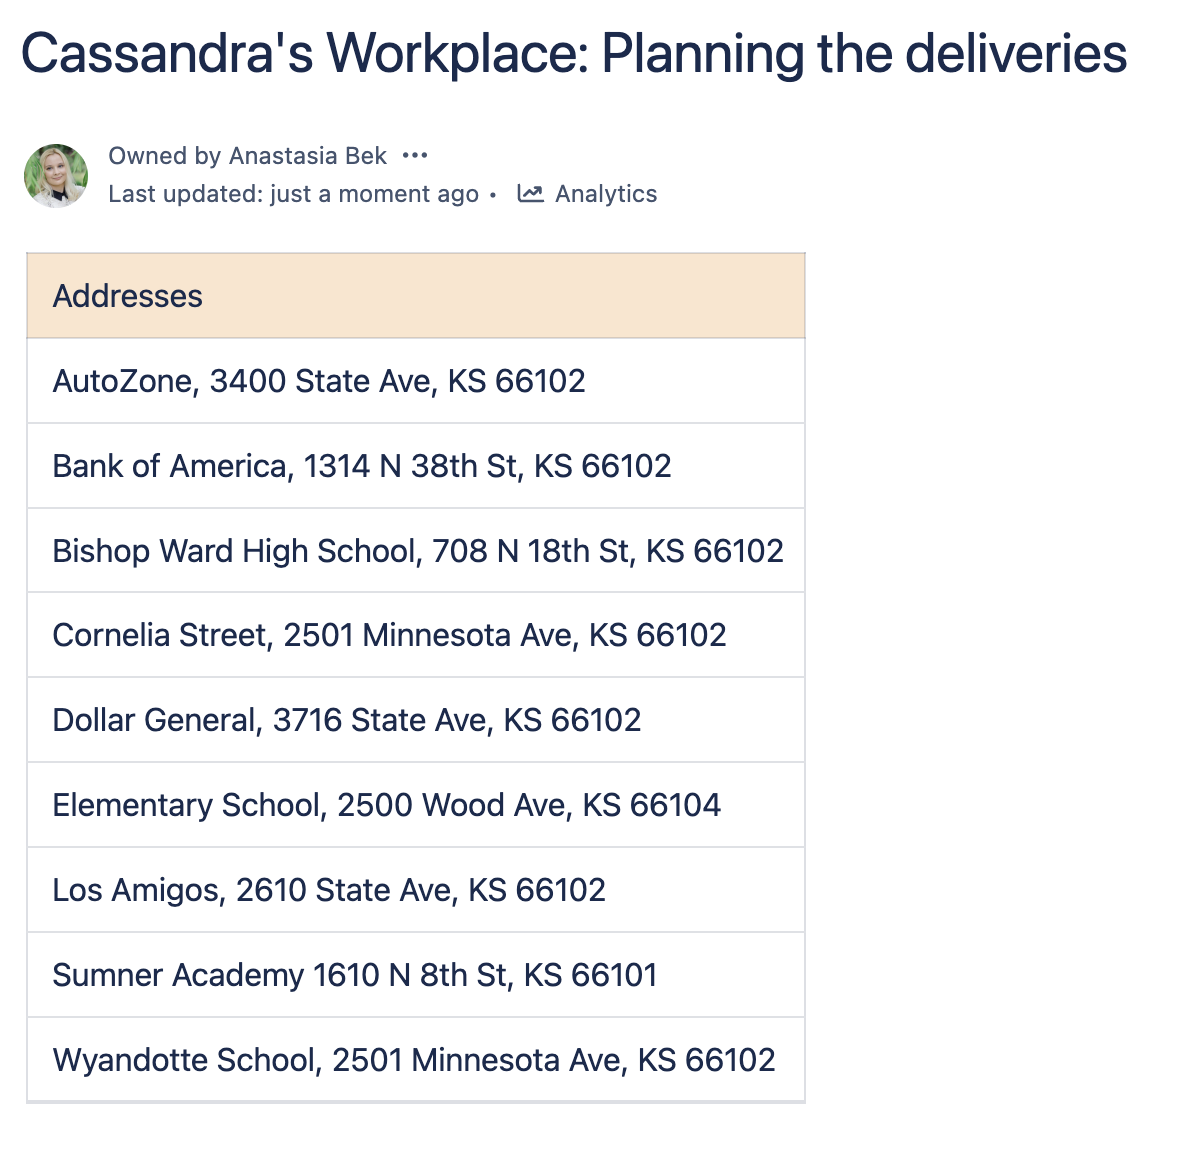
Aimee’s insights are now ready to be shared with the world. Project Manager Cassandra can benefit both from the data and the Table Filter, Charts & Spreadsheets for Confluence app . The app has additional macros that allow you to reuse spreadsheet data and repurpose necessary content. In Cassandra’s case, this is a clean list of unique addresses awaiting deliveries.
To add the macro, go to the edit mode. Type /Table Spreadsheet or click the Plus button on the top control panel, and select the macro.
Then utilize and reuse necessary spreadsheet content (if there’s only one spreadsheet on the page or only one sheet in the spreadsheet, content is selected automatically):
- Specify the name of the page where the Table Spreadsheet is located.
- Select the specific spreadsheet attachment.
- Select the specific sheet in your spreadsheet to reuse content from.
- Specify the range in the sheet to repurpose it (you can also select the range in the spreadsheet displayed in the right section of the Table Spreadsheet macro browser).
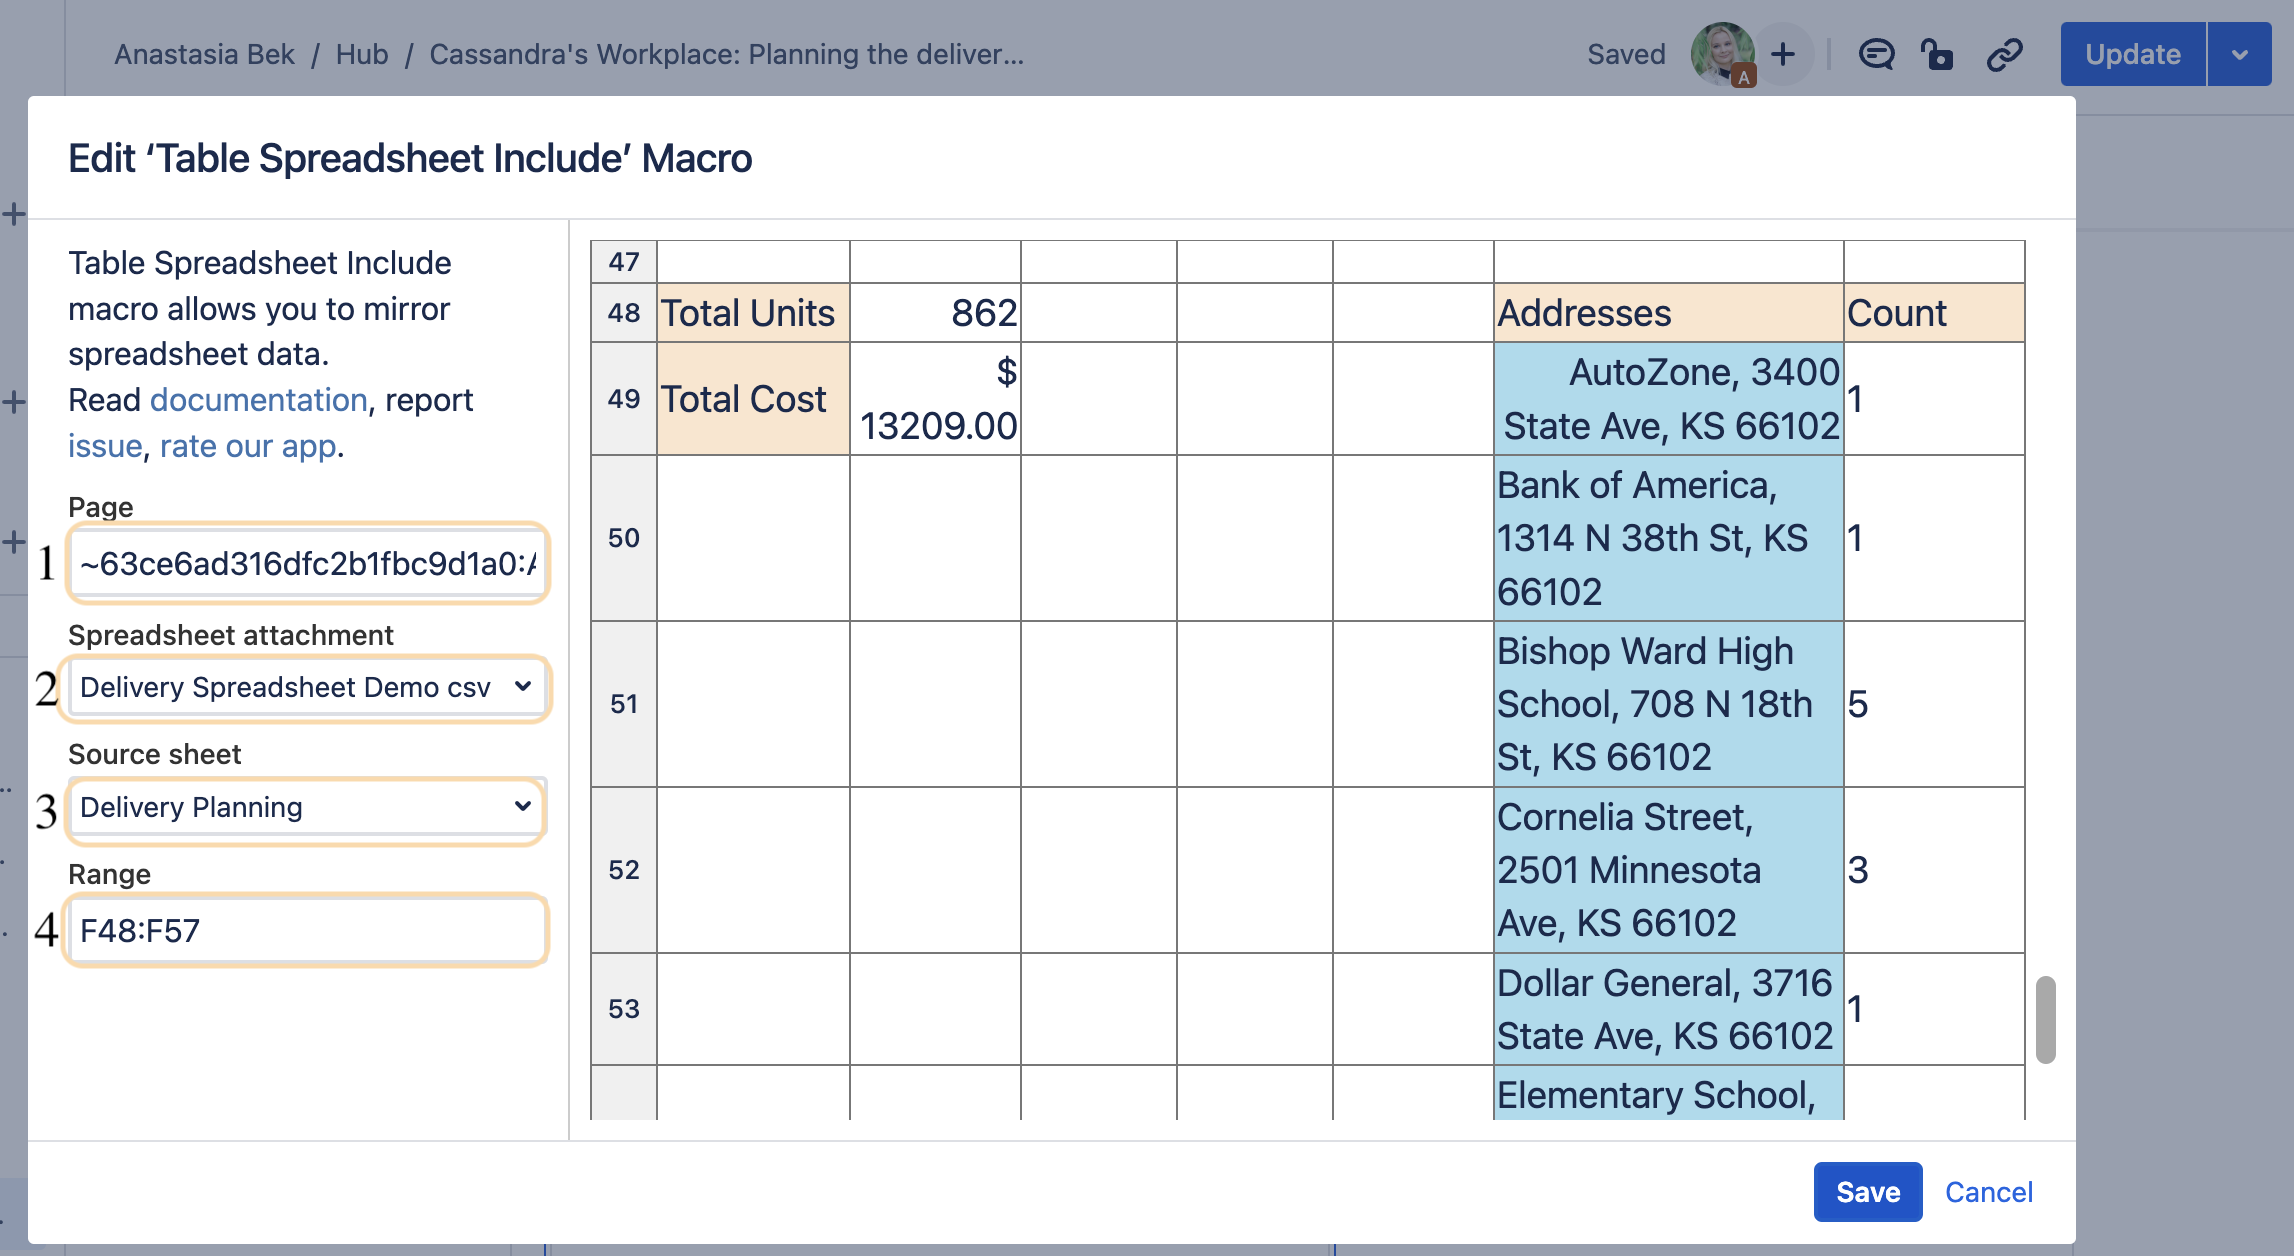
After you insert the macro on the page, the cell range is reused on a new page from another Confluence page.
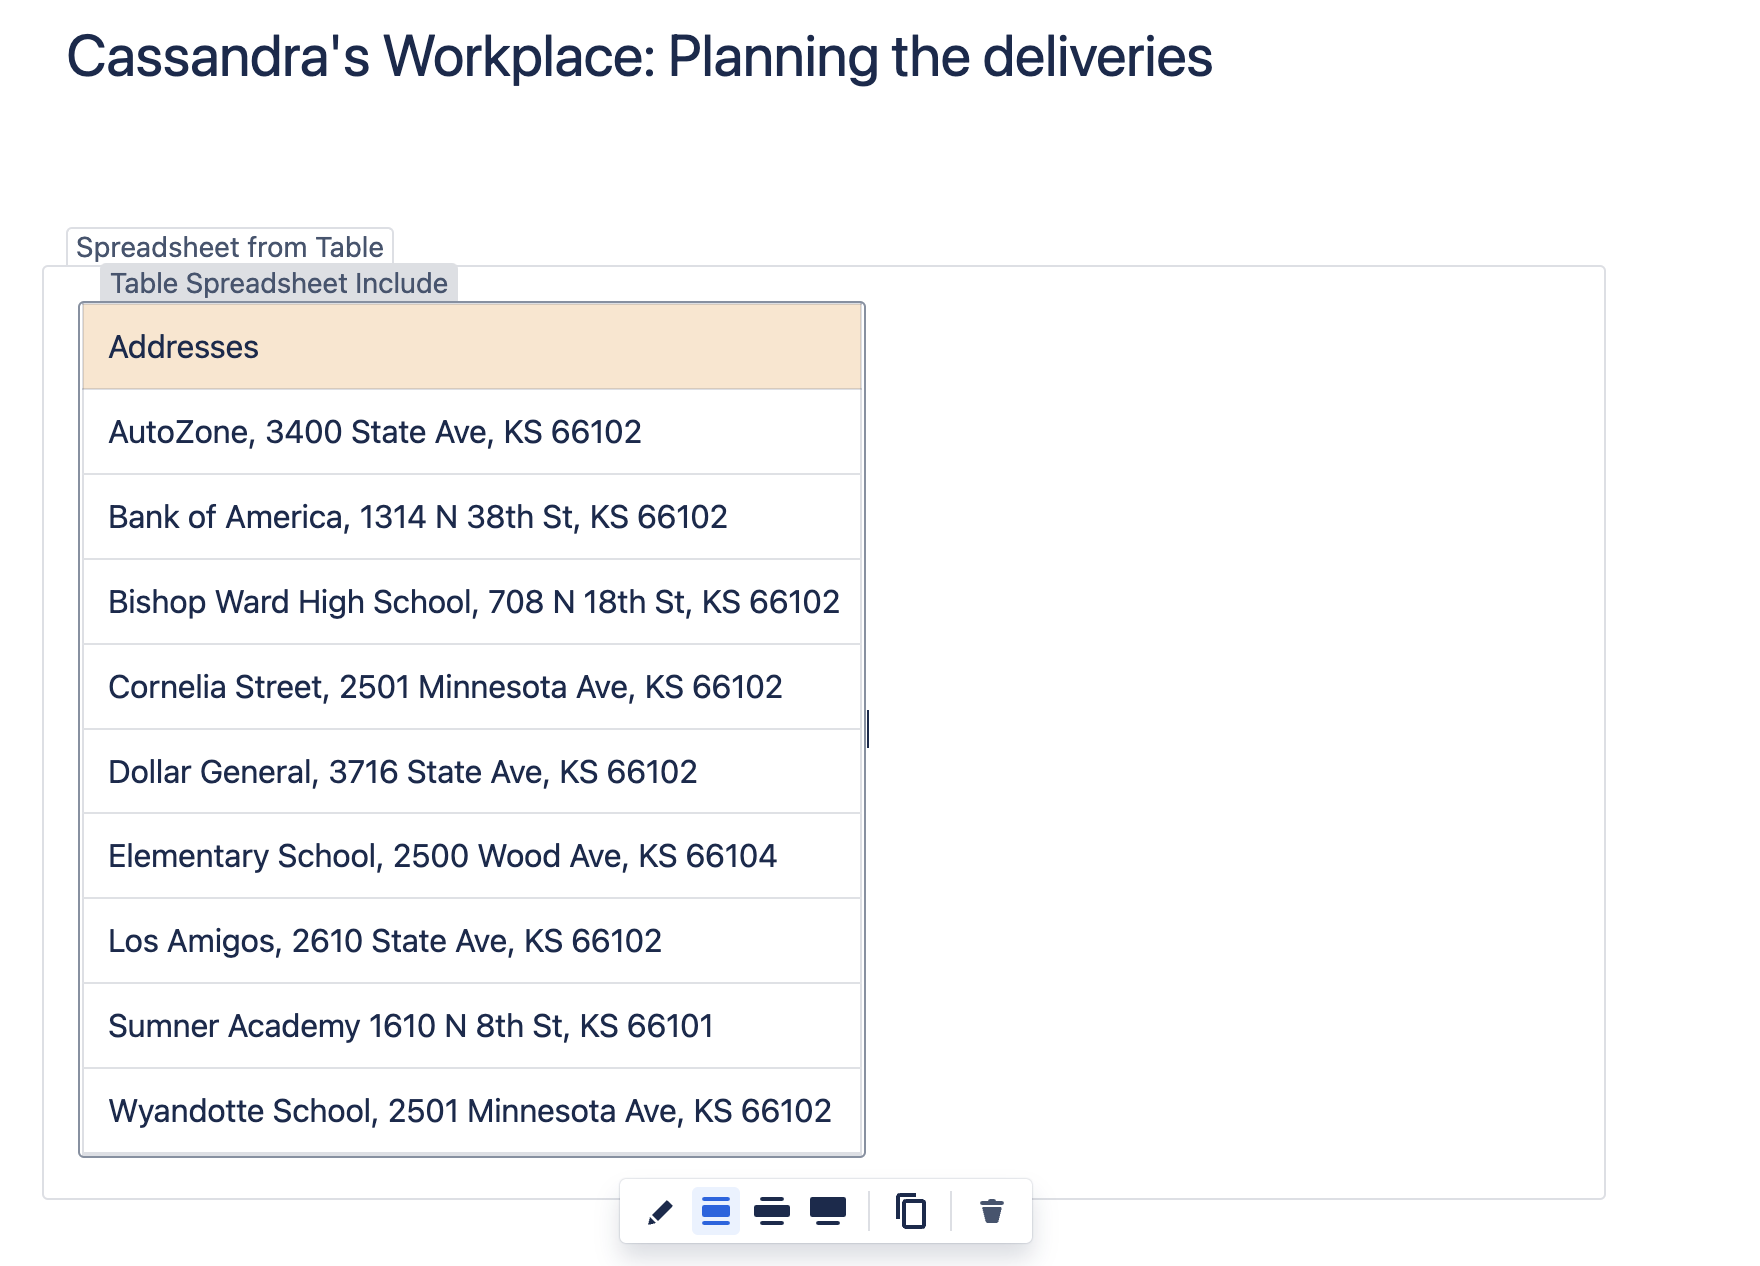
How to use Spreadsheet from Table macro
Spreadsheet from Table is available starting with version 1.3.4-AC and OFF by default.
The app should be updated to enable the macro by the instance Admin via the Confluence Administration
To add the macro, go to the edit mode. Type /Table Spreadsheet or click the Plus button on the top control panel, and select the macro. Then, add your content inside the macro and save the page.
This macro retains the entire toolset of the macro Aimee previously used for the analysis. The content is dynamic, so it will update every time you change the source table.
After you finish editing the spreadsheet, save the macro and the page. You can edit the spreadsheet in the view mode, just like the Table Spreadsheet macro.
From data analysis to project management, spreadsheets offer many opportunities that apply to many needs and projects. With Table Filter, Charts & Spreadsheets for Confluence app you’re able to enjoy spreadsheet functionalities directly in Confluence.
Feel free to contact us if you have any questions or suggestions regarding the Table Spreadsheet macro. Try Table Filter, Charts & Spreadsheets for Confluence app on Atlassian Marketplace to see the app in action.


