Awesome Graphs for Bitbucket: Exclude Files from Lines of Code Statistics

Awesome Graphs for Bitbucket is an app visualizing statistics of Git repositories in terms of commits, pull requests, and lines of code. The Contributors graph, and the Code Frequency graph show how many lines of code were added and deleted in the repository in general and by each developer.
Sometimes lines of code statistics doesn’t represent correctly the actual effort and value that developers bring to the repository. For example, if a new library was added, it will bring hundreds of new lines while a task itself was easy to do and took half an hour.
To make your data more precise and informative, there’s a feature in Awesome Graphs that allows the exclusion of files from lines of code (LOC) statistics.
Why Exclude Files from LOC Stats
This feature will be helpful for users, who:
- Include source code from third-party libraries, and don’t want to count it towards individual code contributions.
- Want automated code generated files not to be included into LOC statistics.
- Version a lot of configuration in very large xml files, and don’t want to count their updates as additions of thousands of LOC.
- Want to include in LOC statistics only files with selected extensions (i.e. c, cpp, h).
- Want to count in LOC statistics only files from the selected directory (i.e. src).
How it works
Repository administrators can add patterns in a gitignore format telling what files have to be excluded from LOC statistics of a repository.
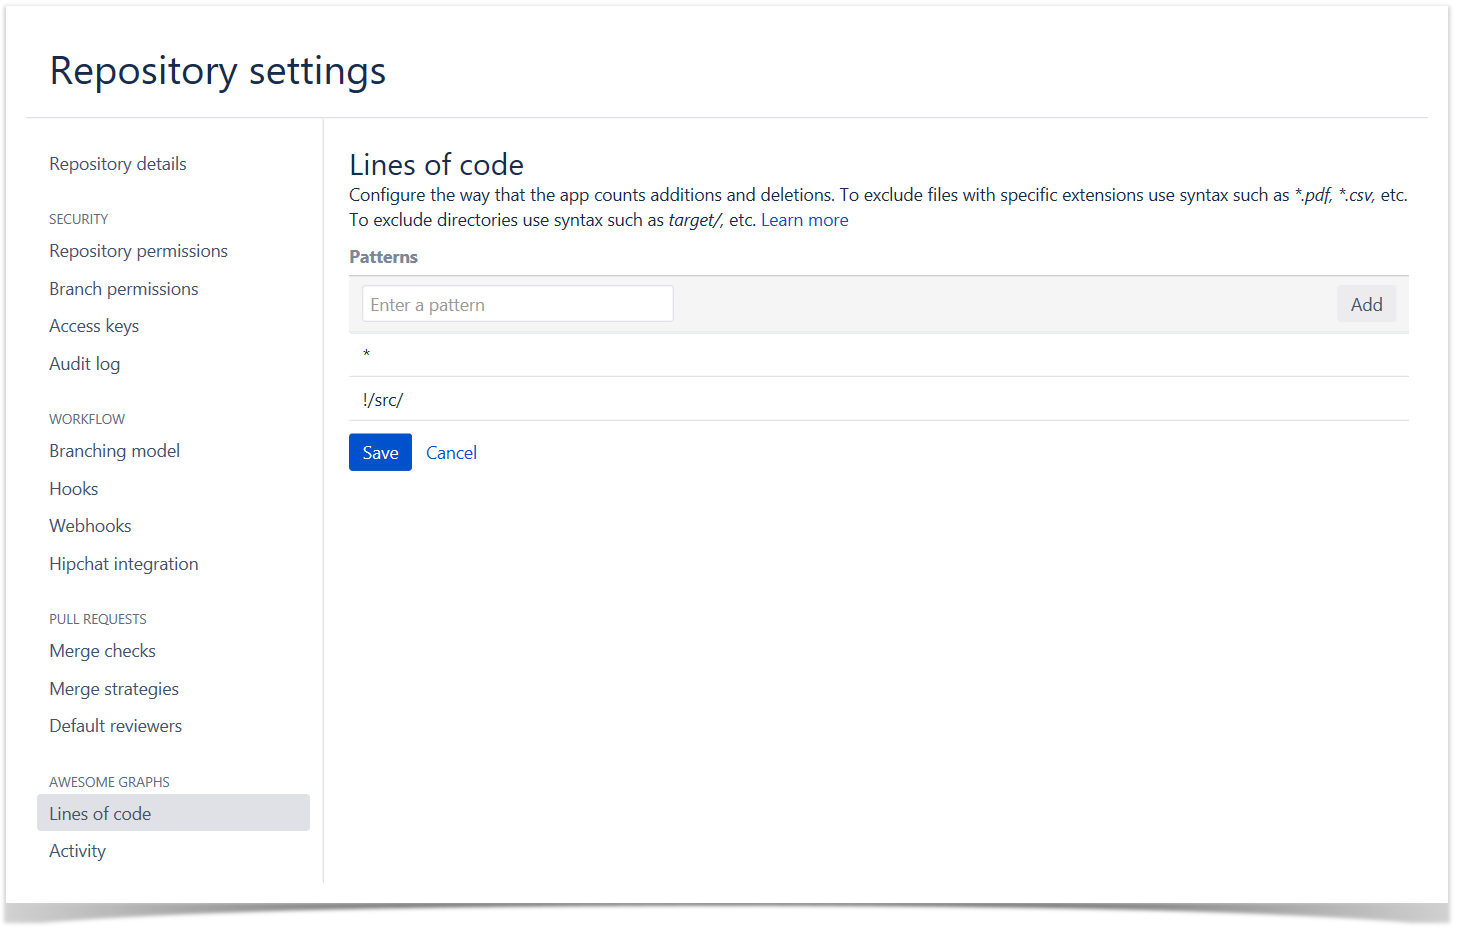
It is possible to exclude:
- particular files
- all files with selected extensions
- all files from selected directories
- everything except files with selected extensions
- everything except files from selected directories
When an administrator adds or modifies patterns, Awesome Graphs re-indexes the repository and displays graphs with new LOC statistics.
Benefits Examples
You can see examples of this feature usage in public repositories.
Statistics for the main directory of a repository
Let’s view the Contributors graph for the jquery repository. It shows additions of LOC in the whole repository.
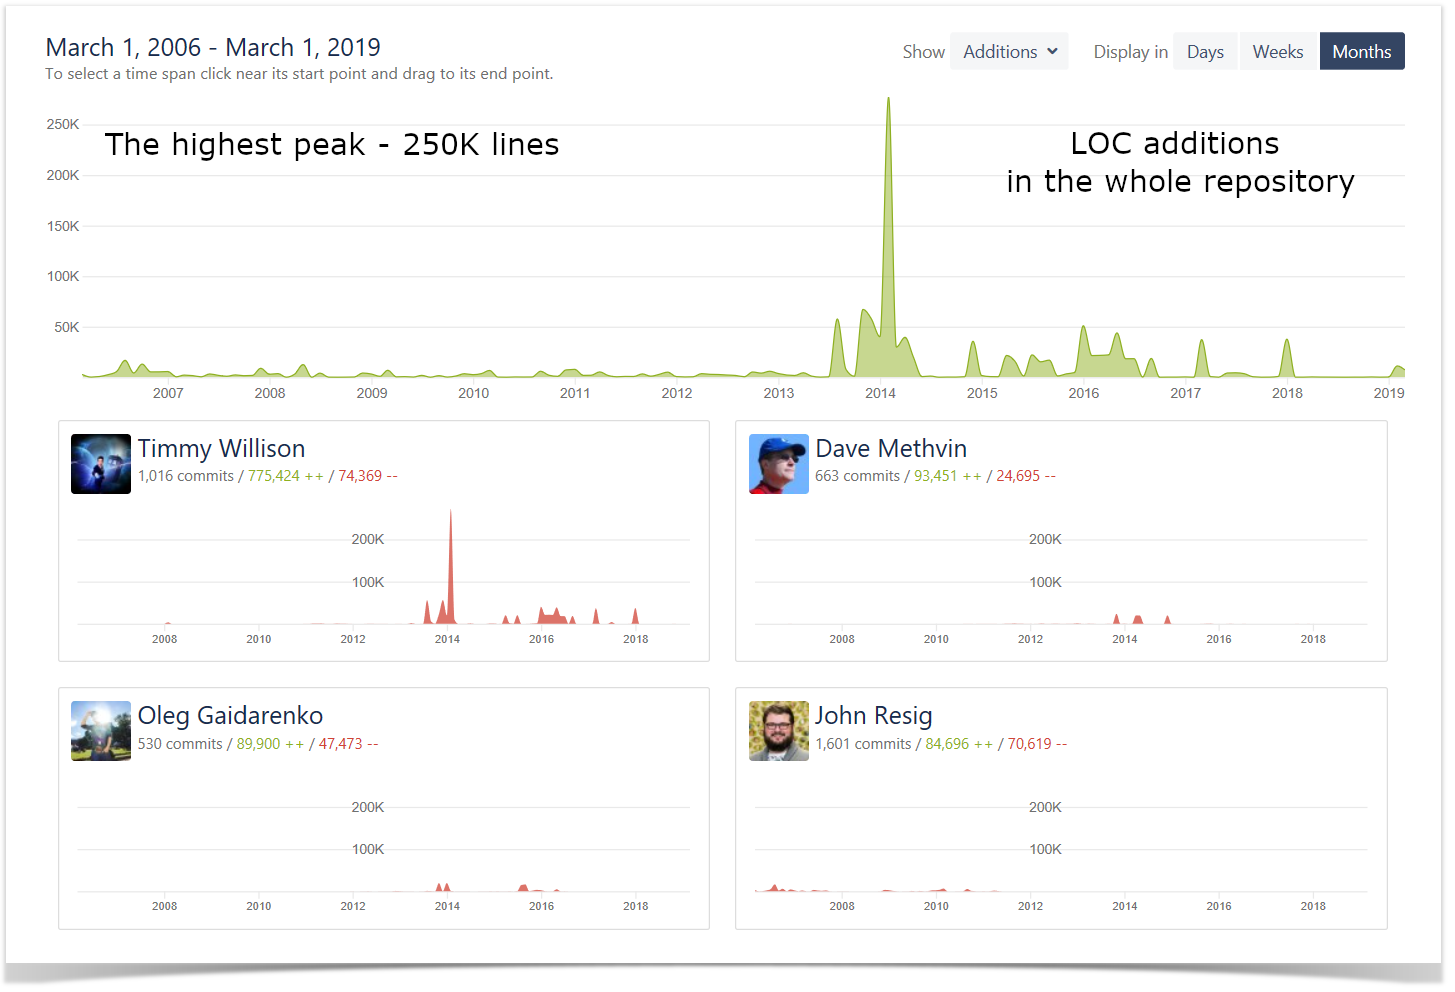
The repository exists since 2006, but according to the graph there was no significant activity there till 2014.
It would be great to make the graph more informative and calculate LOC statistics only for the directory containing the main source code – src. We exclude from statistics all files except files from this directory and get a new graph showing the most important activity happened in the key folder of the repository.
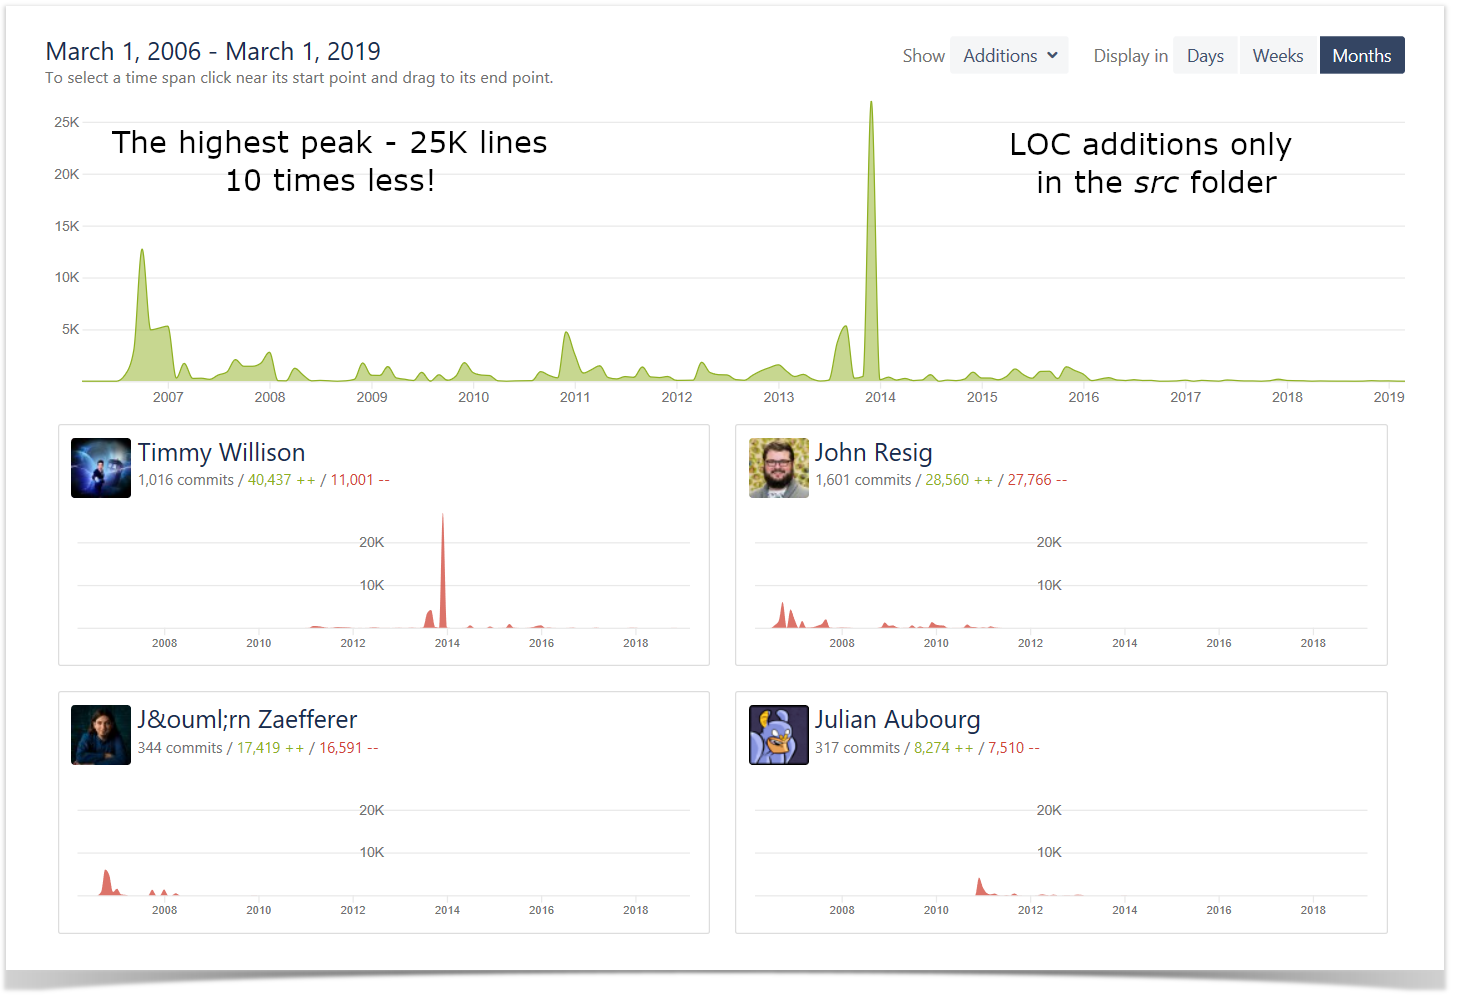
Exclusion of files helped to get new insights:
- There was intensive activity in 2006-2008, 2011, and 2014.
- There was no significant activity after 2016.
- Only two of top four contributors to the repository are also in the top four contributors to main source code.
In the first graph there were peaks of activity showing additions of 50K and even 250K lines of code per week. In the second graph the largest peak shows addition of 25K lines of code, others – about 5K. This data represents the real work of developers more accurately.
Exclusion of third-party libraries from statistics
Let’s view the graph for the kubernetes repository.
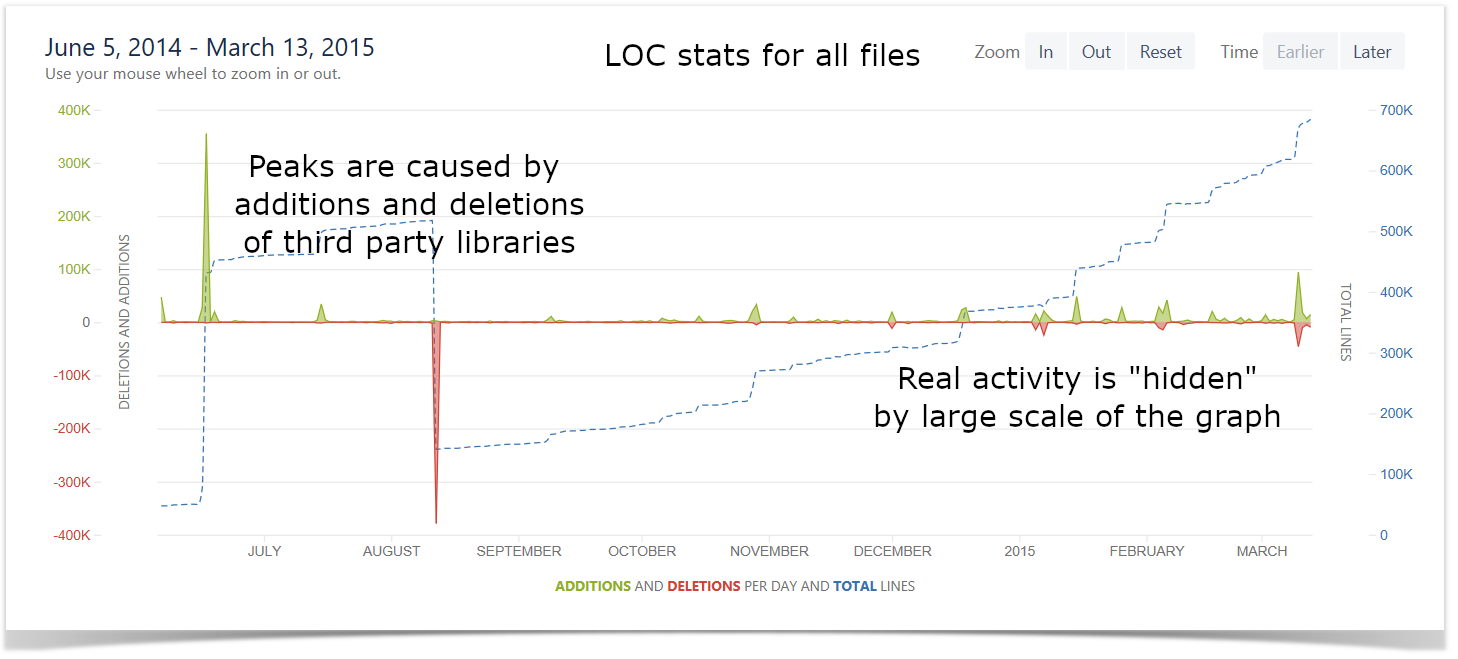
There are two peaks of activity: addition and deletion of more than 300K lines of code. They represent not actual work, but operations with third party libraries. Huge peaks of additions and deletions caused a large scale of Y axis. Due to this all other activity seems to be non-significant.
Let’s exclude from lines of code statistics files from the directory third_party.
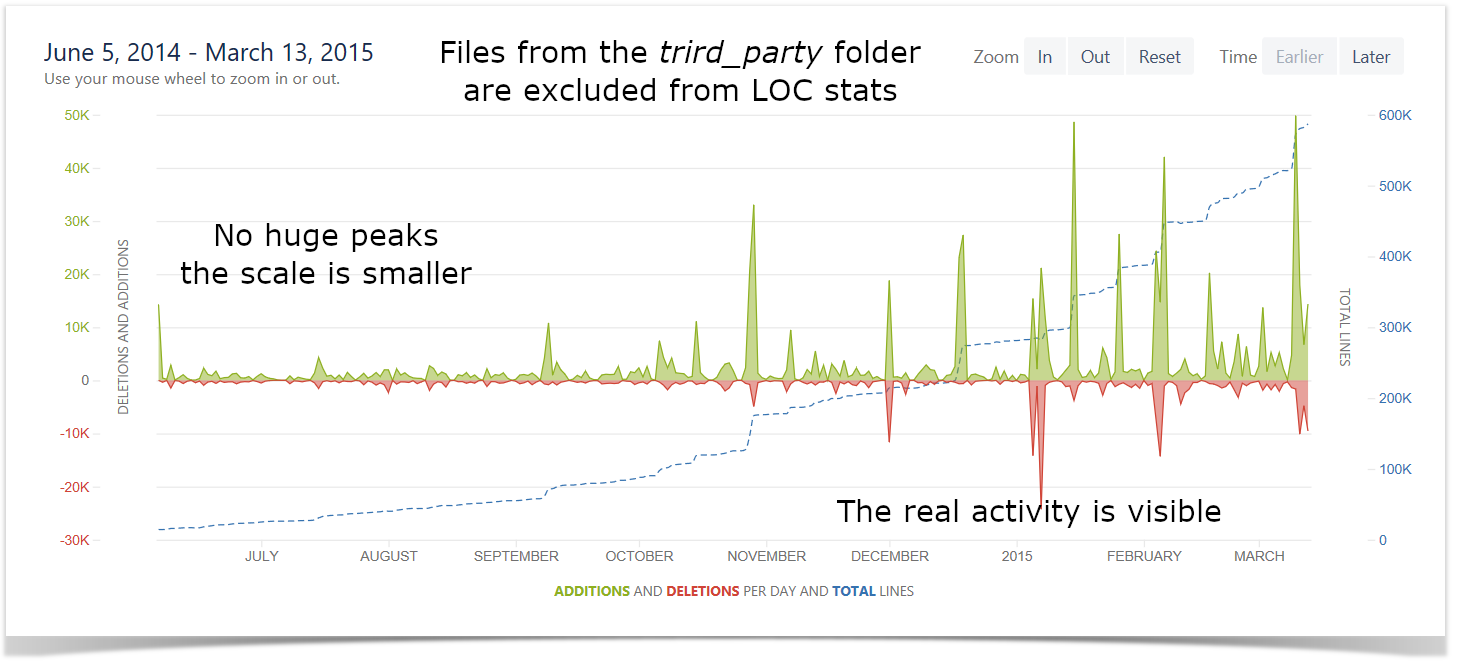
The graph has become more accurate. Peak values disappeared. The scale of Y axis decreased allowing to get a better understanding of the activity in the repository.
Get more informative LOC statistics
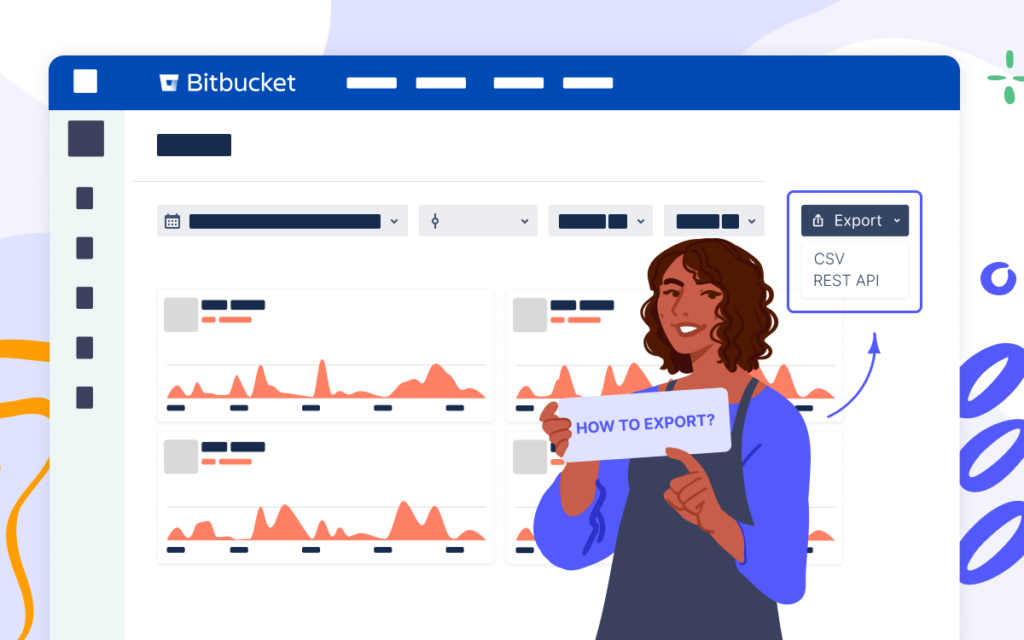
Using Awesome Graphs for Bitbucket, you can enrich your commits, lines of code reporting with the REST API the app provides. For example, you can easily count each pull request size to decide whether it needs to be decreased. Read more about it in our blog post.
Try the app for free discover more benefits and unleash the potential of your teams.