


An Efficient Way to Edit Pages with Large Tables in Confluence

Atlassian Confluence is a well-known team collaboration platform in the world of IT. It provides efficient tools for content authoring, its further sharing and updating by all team members from any place in the world.
Now everybody can contribute to the existing database of digital information, refresh the obsolete knowledge base articles or produce new documentation for the existing products or services.
Being a global platform tailored to multiple audiences and objectives, Confluence provides sufficient capabilities for creating content-rich pages, managing structure of tables, and updating data values in them. But, the ideal solution never exists, and so Confluence has several issues with editing large pages and processing table data, such as filtration or aggregation.
In this blog post, we will feature a pretty quick and easy way to work with large tables on Confluence pages with the two add-ons of ours, as follows:
- InPlace Editor – this add-on allows you to edit the long pages as independent sections separated by headings of specific levels.
- Table Filter and Charts – this business intelligence solution allows you to filter table data of any complexity, aggregate it in the form of multidimensional pivot tables, and generate the vivid dynamic charts on the basis of raw or processed table results.
Creating the Page Structure
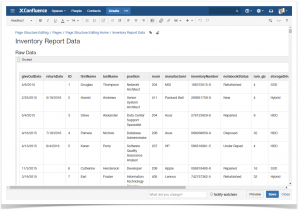
First of all, let’s create a new page and place here a large table that contains around one thousand rows with the inventory data. It consumes too much space on the page and creates additional inconvenience if you try to generate multiple charts on its basis. You will have to place a copy of this table every time into a new macro, so this will drastically increase the page size and affect the editor performance. Additionally, it will be a problem if you have to update one or more values. So, in this case you will need to add the same changes in each copy of the table.
To increase the efficiency, we place the table within the Excerpt macro. This will allow us to refer to this excerpt on another page where we are going to generate several reports.
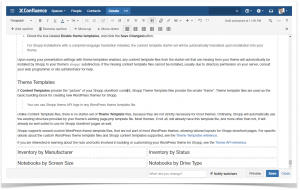
So, we go to the target page where we will place several charts on the basis of this table data. These headings will indicate the kind of reports we are generating and will help InPlace Editor to edit the page by parts.
The final page structure looks like:
We save the page. Now it’s turn to use InPlace Editor for editing page parts. Of course, you can use the native editor, scroll the page and experience response issues on the page with a lot of text.
Editing Page Section
The page we save looks similar to the one displayed:
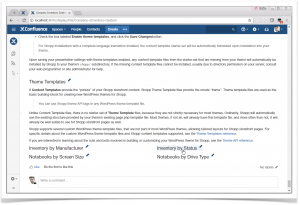
As you may have noticed, the headings are now highlighted when you hover over them and the Pencil icon is displayed. This is InPlace Editor.
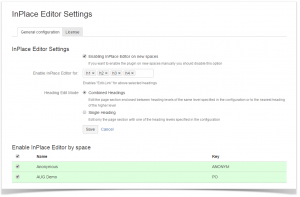
The overall configuration of InPlace Editor is pretty simple. You can have both global and space-specific configurations. All you need is to select the heading levels that open the InPlace editor, and you’re done!
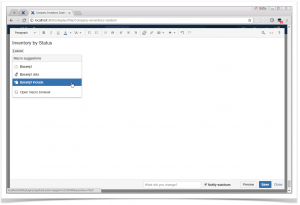
Let’s click some page heading and see what we get!
We open the pop-up editor with the section we need instead of the entire page. InPlace Editor preserves all the standard features of the native Confluence editor, and, frankly speaking, it looks like the native editor.
![]()
Pro tip:
Learn more about using Spreadsheets in Confluence
![]()
Aggregating and Visualizing Data in Confluence
So, we continue work on our page section, and let’s do some magic!
First, let’s add the macro that will output the source table within this page section. If you remember, we placed our table within the Excerpt macro and that was not accidental.
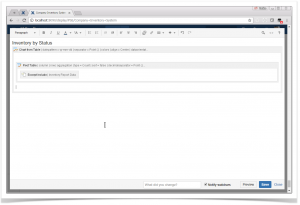
We add the Excerpt Include macro on the page and point it to Excerpt macro stored on the same page,
Now we can add the Pivot Table and the Chart from Table macros that we will use for processing table data.
After all manipulations, we get the following within the page section:
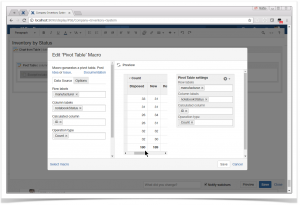
Let’s configure the Pivot Table macro that will aggregate the inventory data against the manufacturers. You just click this macro body and then select Edit.
In the settings of the Pivot Table macro, we select the manufacturer column in the Row labels dropdown box. Then we aggregate our pivot table against the statuses by selecting the notebookStatus column in the Column labels dropdown box.
After saving the macro, we can finally adjust the chart settings, as follows:
- select the column with values;
- select the chart type as ‘Stacked Column’.
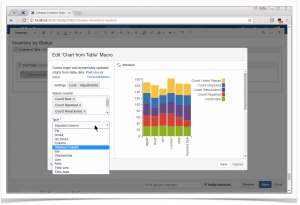
Once done, we can save the page section.
Let’s add some more charts on the page, with the help of the Pivot Table and Chart from Table macros. After all operations, we get the following page.
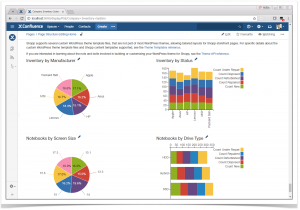
Convenience in Simplicity
The best thing about this is that you can edit the section with each chart independently without a necessity to load the entire page into your editor. This can greatly save your time and bring more response when editing small parts of page.
You can combine the capabilities of InPlace Editor and Table Filer and Charts add-on while working on Confluence pages. This gives you more freedom in editing separate page sections and creating pivot tables or data-explaining charts.

![]()
![]()


