How to Build PR Review Time Report from Bitbucket Data in Confluence

Tracking pull request review time plays a central role in identifying bottlenecks and improving the code review process. In this article, we’ll explore how to use the Awesome Graphs for Bitbucket app to extract data on pull request cycle times from Bitbucket Data Center and create a PR review time report in Confluence using the Table Filter, Charts & Spreadsheets app.
In this article, we consider PR review time as one of the phases of the pull request cycle time and define it as the period from when the first non-author comment is left until the pull request is approved by all reviewers.
Export PR review time from Bitbucket Data Center to CSV
Awesome Graphs for Bitbucket Data Center offers two options for getting a CSV file with detailed pull request data: from Bitbucket UI and REST API resources. This article will show how to export review time via the REST API resources. To get data directly from Bitbucket, refer to our documentation.
Using Awesome Graphs REST API, you can retrieve pull requests for a specific user, repository, project, or from the whole Bitbucket instance. While exporting to CSV, the resulting file will contain the following information:
- pull request creation and last updated date
- author’s name and username
- repository and project name
- PR state and ID
- reviewers’ names and usernames
- PR cycle time and its four phases, measured in seconds: time to open, pickup time, review time, time to resolve
Further on, we’ll show how to export this data via Awesome Graphs REST API for a particular project. Other requests follow the same principles to help you obtain the data on user, repository, or global levels.
Export cycle time via Awesome Graphs REST API
This curl request will generate a CSV file containing a list of pull requests and their review times for a specific project:
curl -X GET -u username:password "https://%bitbucket-host%/rest/awesome-graphs-api/latest/projects/{projectKey}/pull-requests/export/csv"
By default, it will retrieve data for the last 30 days. With sinceDate and untilDate parameters, you can set a timeframe for exported data up to one year. You can also use a state parameter to filter the response and get data on only open, merged, or declined pull requests. Read more about possible parameters in our documentation.
After running the request, you will get the review times of each pull request and can build a code review time report in any tool you like. We’ll show you how to build this report in Confluence.
How to build a code review time report in Confluence
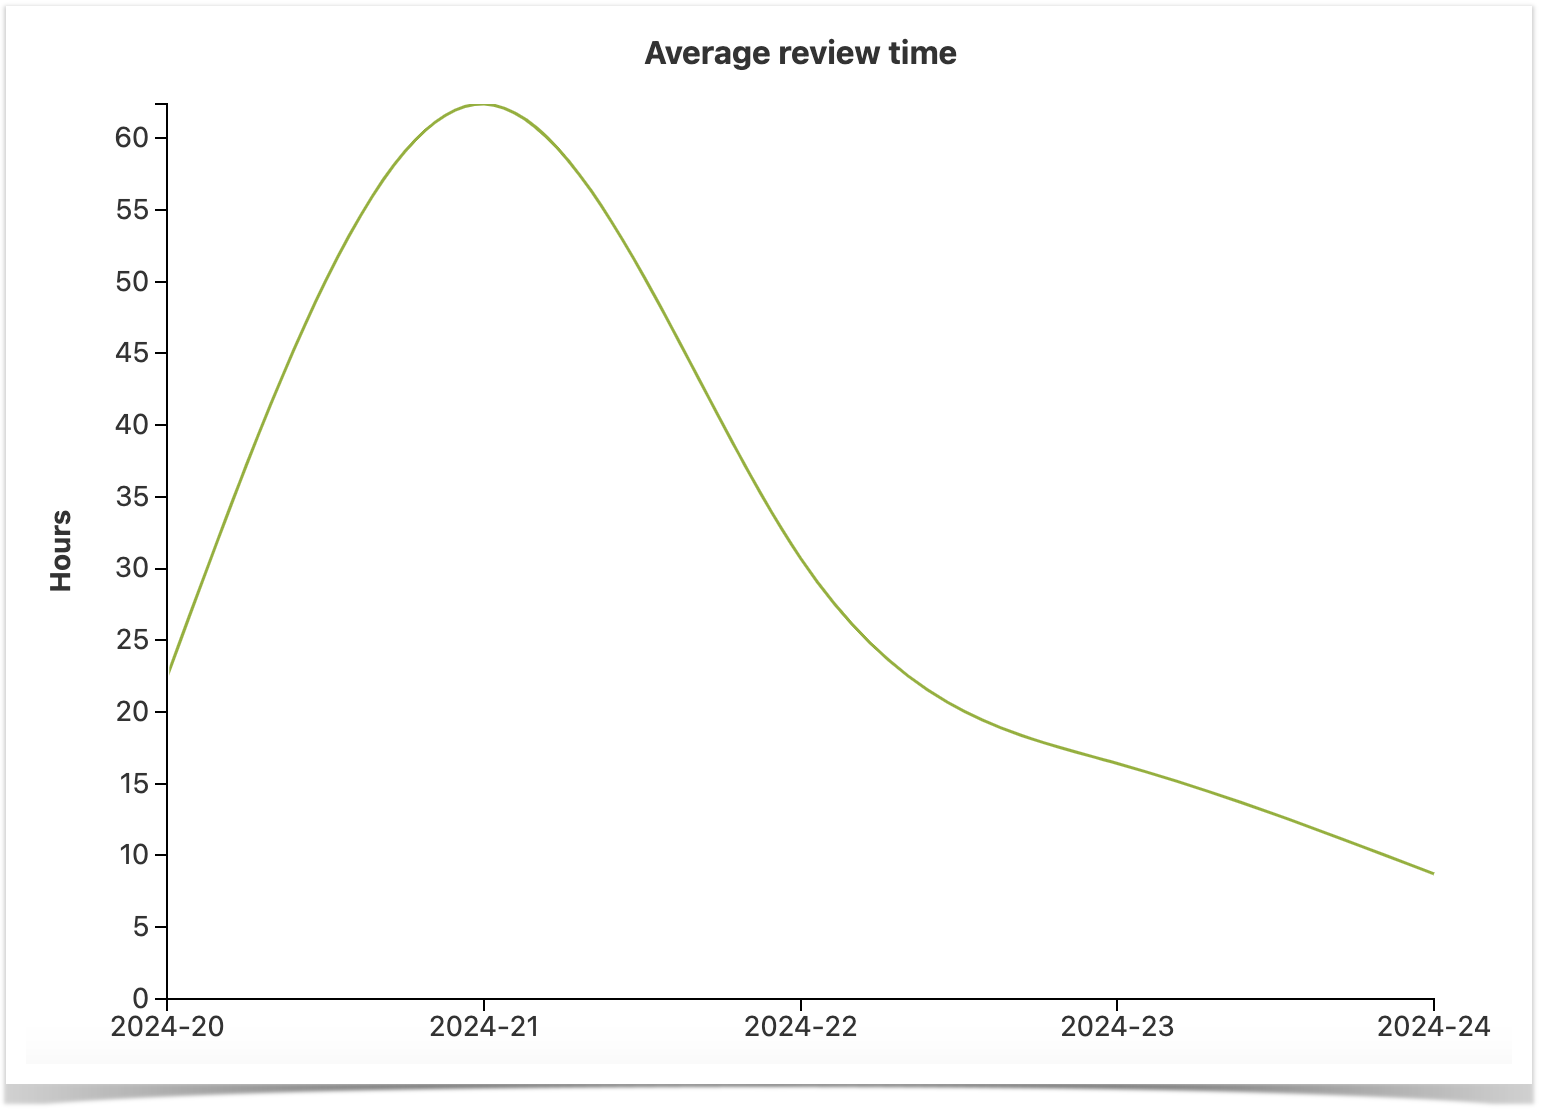
A code review time report in Confluence can be built with the help of the Table Filter, Charts & Spreadsheets app. We will now show how to use the app to create a graph displaying the average merged pull request review time grouped by week.
An example of the report you will get after following our guide:
To build it, we will use the following macros: Table from CSV, Table Transformer, and Chart from Table.
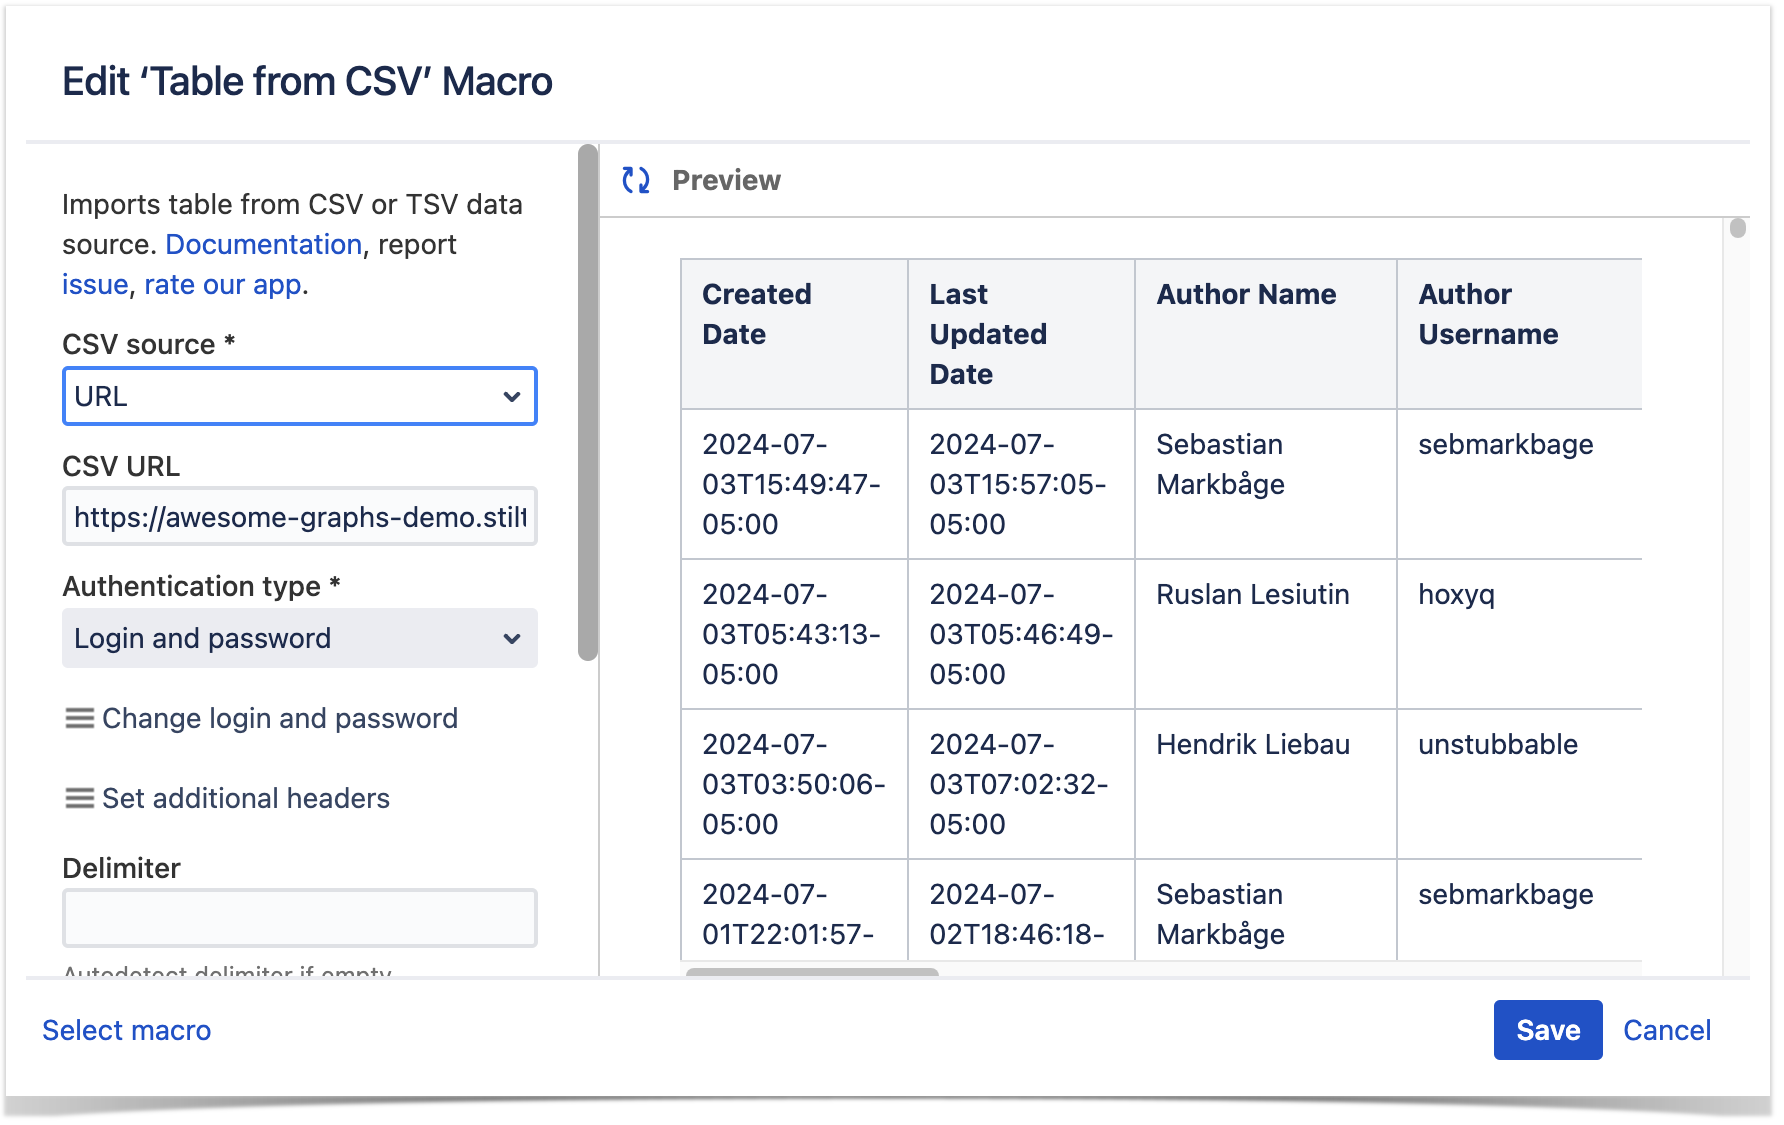
Adding the Table from CSV macro
Using the Table from CSV macro, we’ll export pull request data from Bitbucket into Confluence following these steps:
- Add a new macro to the Confluence page in the edit mode by typing { and searching for Table from CSV.
- Configure the macro:
- Choose the URL option as a CSV source and enter the URL link from the Awesome Graphs REST API resource. Here is an example of a URL to get data on the project level:
https://%bitbucket-host%/rest/awesome-graphs-api/latest/projects/{projectKey}/pull-requests/export/csv
-
- In the Authentification type, enter your Bitbucket login and password.
- Save the changes.
Inserting the Table Transformer macro
With the Table Transformer macro, we’ll group pull request data by week and calculate the average review time for each week. Here is how:
- Add a new macro by typing { and searching for Table Transformer.
- Wrap the Table from CSV macro inside the Table Transformer macro.
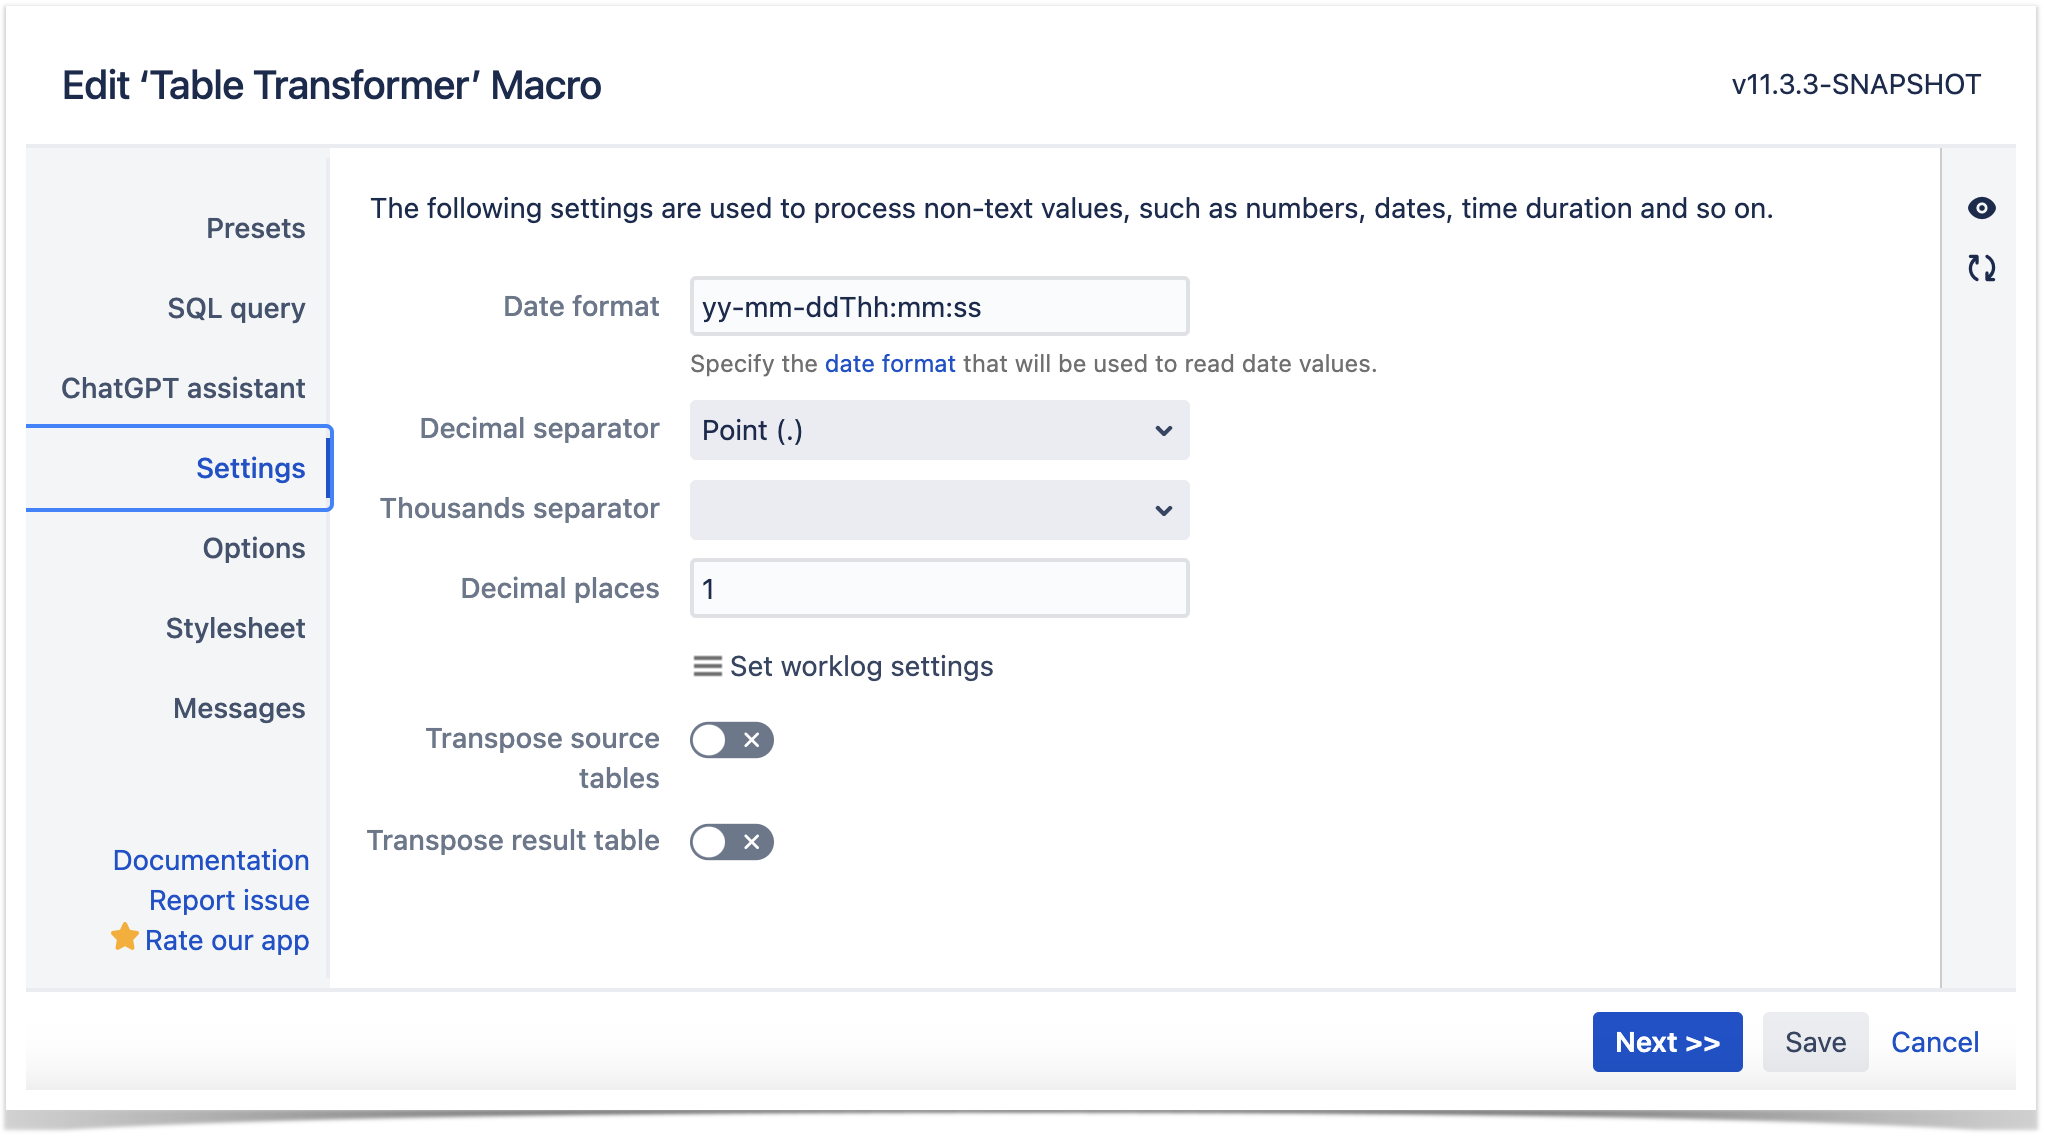
- Configure the Table Transformer macro to group data by week and calculate the average review time:
- Use the following SQL query in the SQL query tab to make all calculations:
SELECT
 'Created Date',
 AVG('Review Time') / 3600 as 'Review Time'
FROM (
  SELECT *, FORMATDATE(T1.'Created Date'::Date, "yy-w") 'Created Date' FROM T1)
  GROUP BY 'Created Date'
-
- In the Settings tab, change the Date format to yy-mm-ddThh:mm:ss and Save the changes.
Building a PR review time graph with the Chart from Table Macro
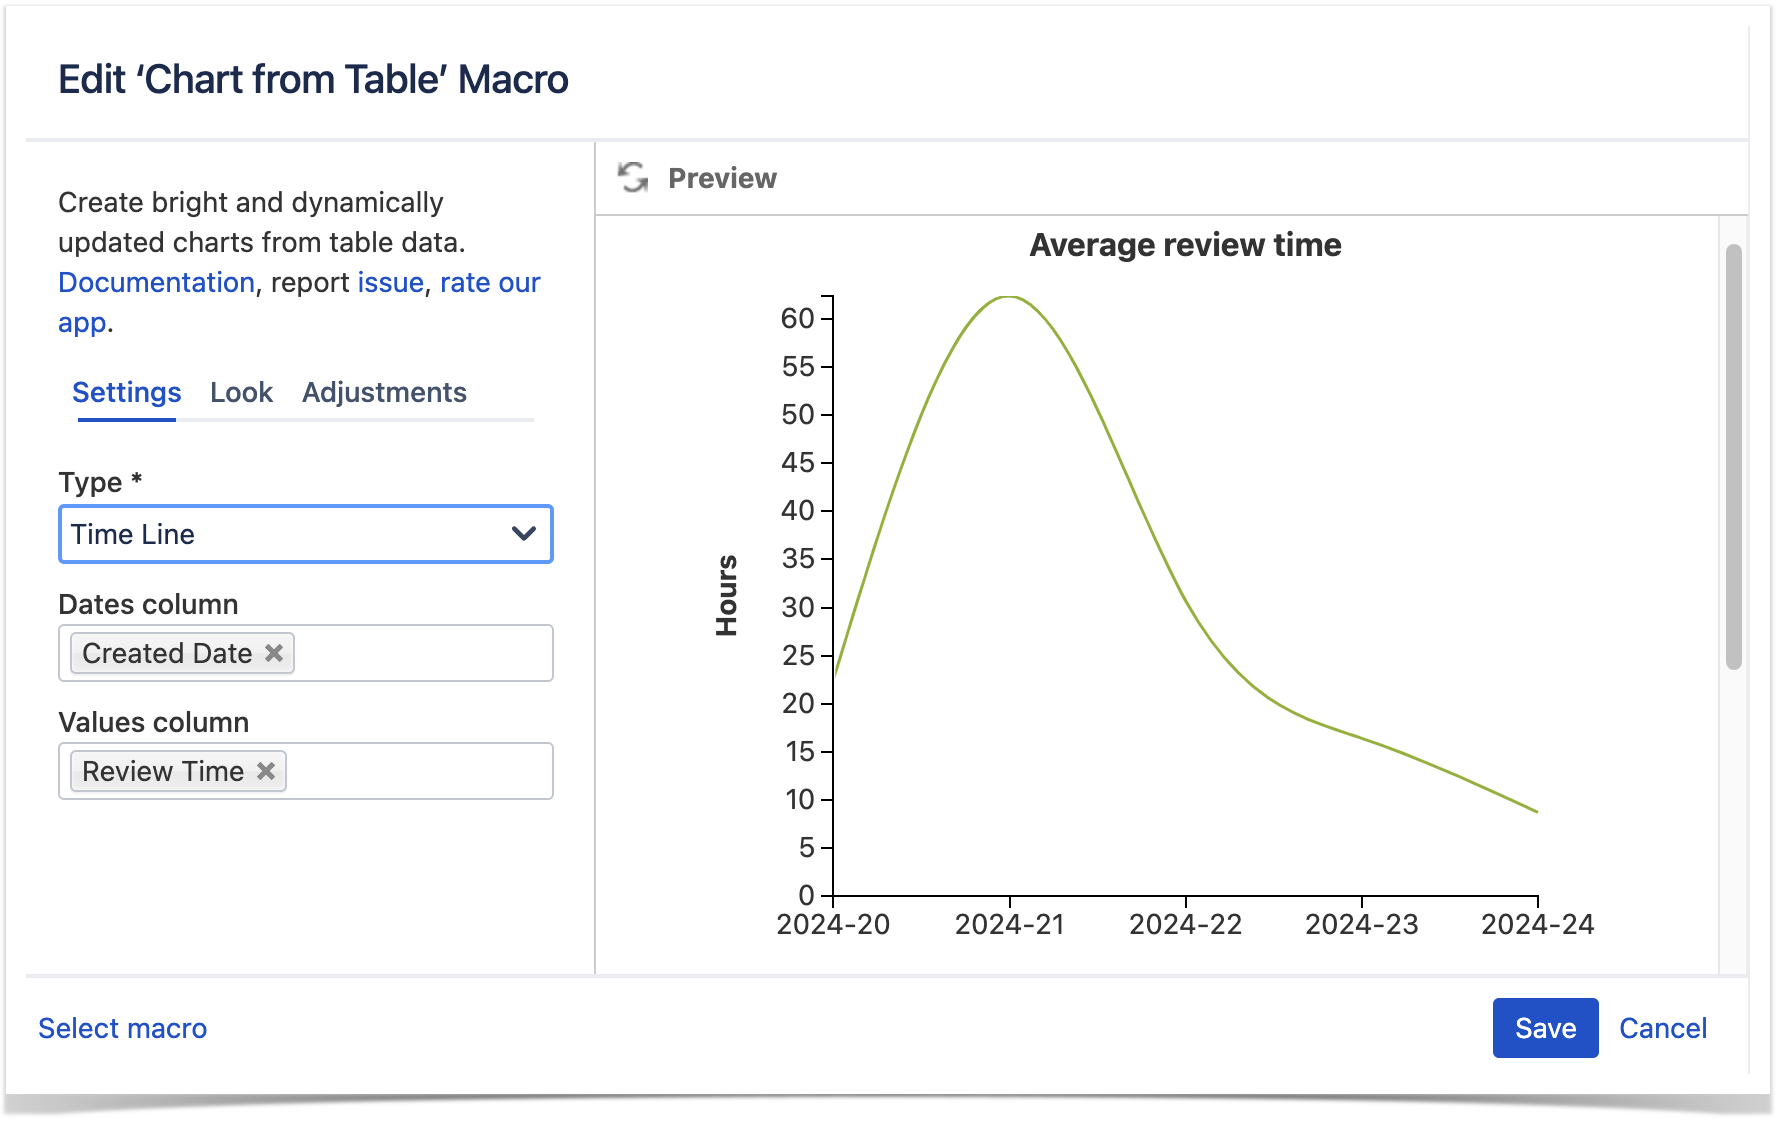
The Chart from Table macro will help us to build an average code review time report from grouped data.
- Insert a new macro by typing
{and searching forChart from Table. - Wrap the Table Transformer macro inside the Chart from Table macro.
- Configure the Chart from Table macro:
- Settings:
- Chart Type: Time Line
- Date Column: Created Date
- Values Column: Review Time
- Adjustments:
- Date format: yy-w
- Scale X step: 7
- Interpolation: Natural cubic
- Look: Configure any additional settings like chart title, labels, etc.
- Settings:
- Save the changes and publish the page to see the report.
Following these steps, you can easily build a PR review time report in Confluence using data extracted from Bitbucket. This report will provide valuable insights into your team’s code review process, helping you identify areas for improvement. The combination of Awesome Graphs for Bitbucket and Table Filter, Charts & Spreadsheets for Confluence makes this process straightforward and highly customizable to fit your specific needs.
For teams looking for engineering reporting solutions in Bitbucket Cloud, we recommend these articles:


