How to Get Bitbucket Statistics for Commits and Pull Requests

A data-driven mindset is key to eliminating bottlenecks and improving delivery time. This is why tracking Bitbucket statistics is crucial for development teams that are looking to streamline their processes. While exact metrics can look different to each team, one challenge remains consistent: there is no fast and easy way to track engineering statistics in Bitbucket Data Center. However, on-prem solutions, like the Awesome Graphs for Bitbucket app, make it possible. This article will explore how to easily set up and track engineering metrics of your choice: both out-of-the-box reports and custom REST API solutions included!
Awesome Graphs for Bitbucket is a data-providing and reporting app for Bitbucket that transforms invisible developer activities into insightful graphs and reports in one click. If your team uses Bitbucket Cloud, check out this article on REST API statistics in Awesome Graphs Cloud.
Out-of-the-box Bitbucket statistics
If you are looking for a quick solution, we recommend using out-of-the-box reports provided by tools like Awesome Graphs. This option allows you to review target metrics in just a few clicks without compromising data and insight quality. Let’s take a look at some reports offered by the Awesome Graphs app and the use cases they cover.
Activity statistics
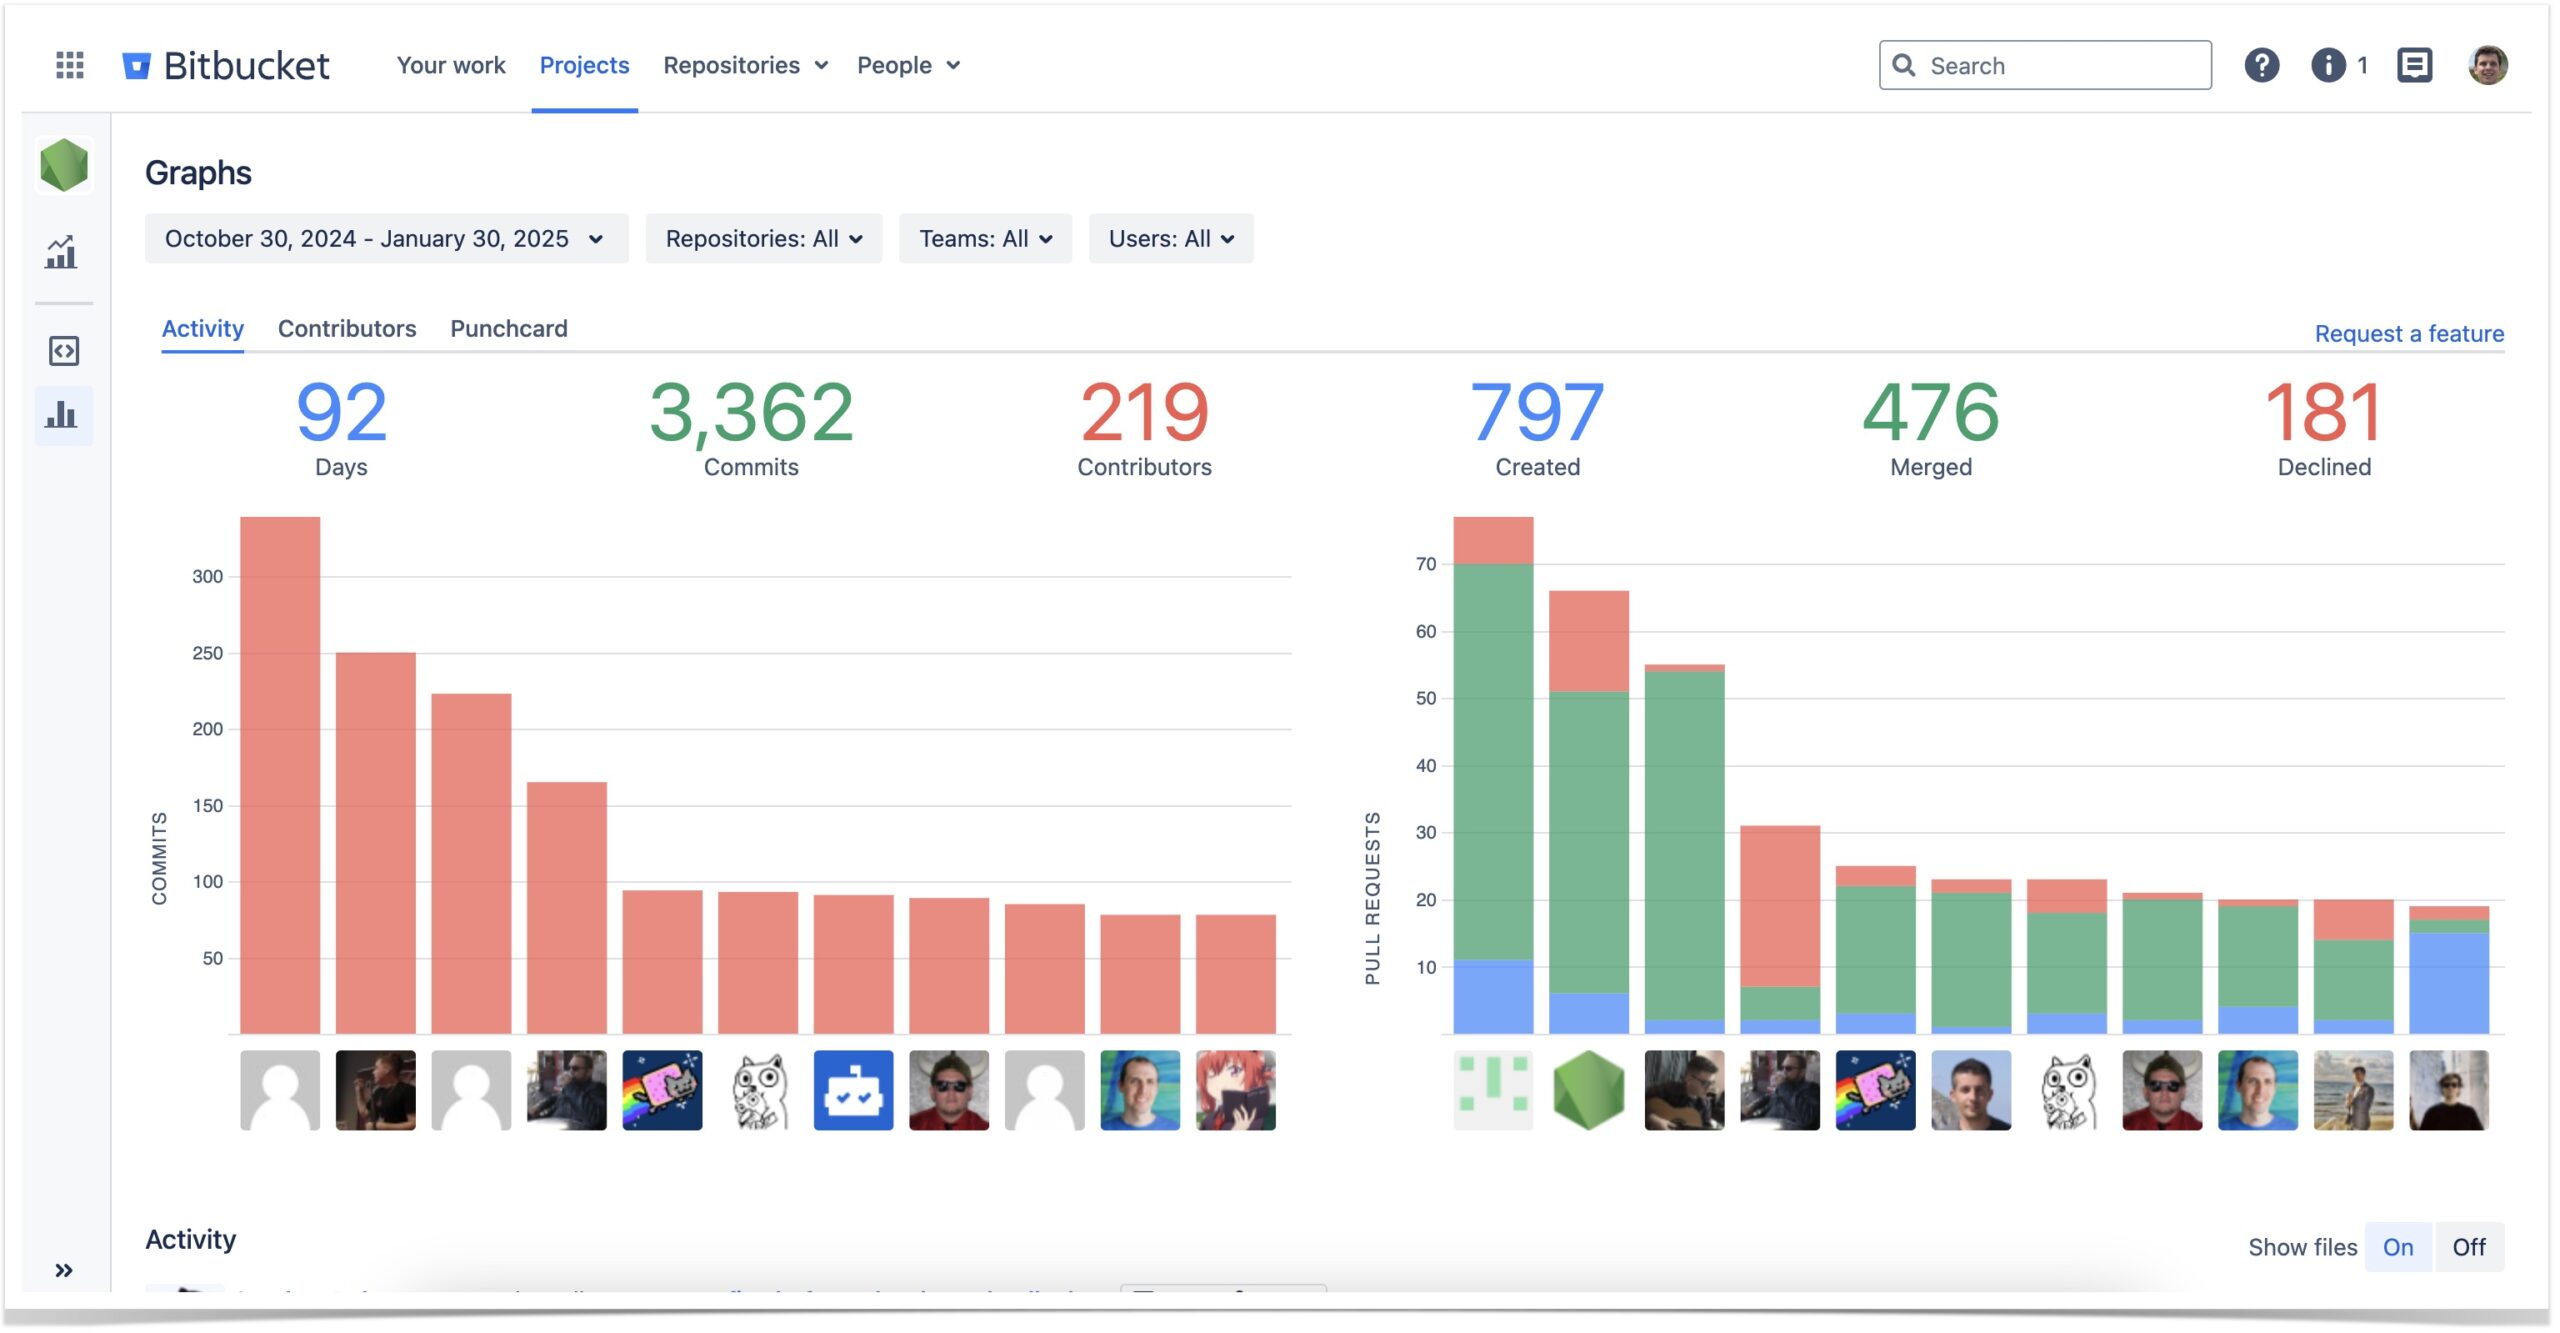
For teams looking to get a general overview of developer contributions, the Activity graph can bring a lot of value.
The Activity graph showcases the input of top contributors to your project or repository and visualizes both commit and pull request data. Pull request bars are color-coded into sections corresponding to the state of pull requests: merged, declined, and open. But arguably, one of the most notable features of the Activity graph is a useful infographic at the top of each chart. With just one click, you can evaluate the number of commits and pull requests created over a selected time span in your project. At the same time, you can review the proportion of pull requests that were merged or declined.
Individual Bitbucket statistics
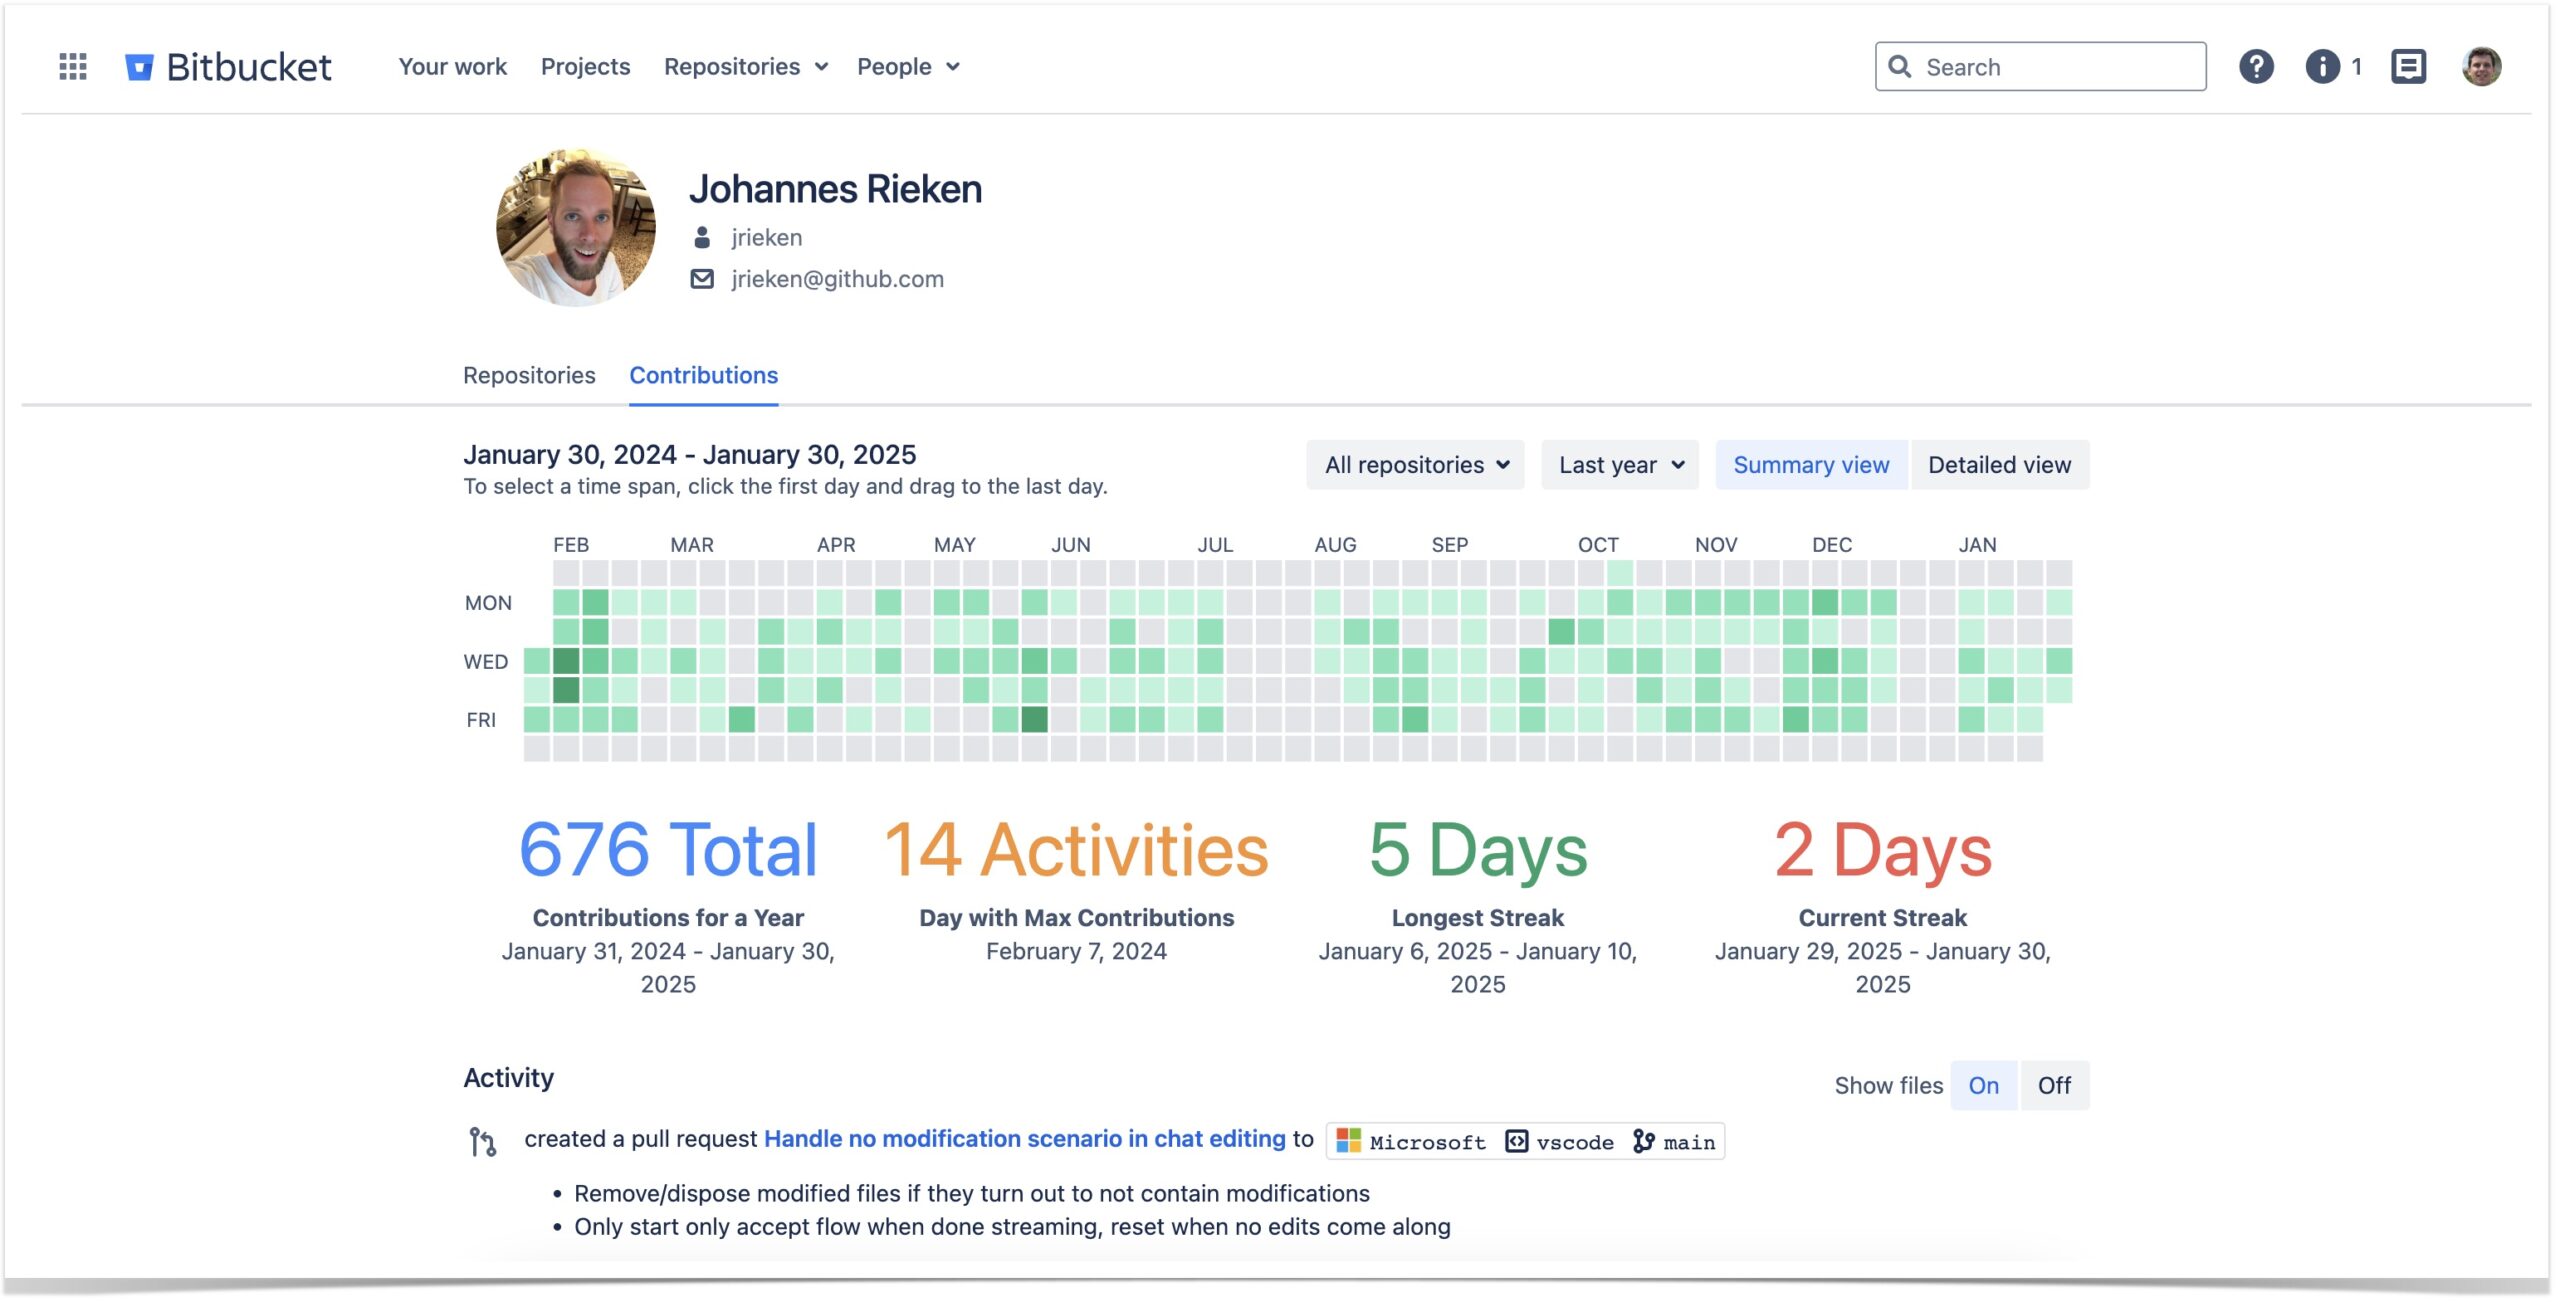
For quick insight on individual activity patterns, consider using the Contributions calendar. It conveniently offers a global contributions heatmap for a particular developer and provides useful statistics such as:
- the total number of contributions
- the maximum level of daily activity
- the longest activity streak,
- the current streak.
You can select a target time span and even switch to the Detailed view to review and compare the contributor’s activity in different repositories.
Cycle time statistics
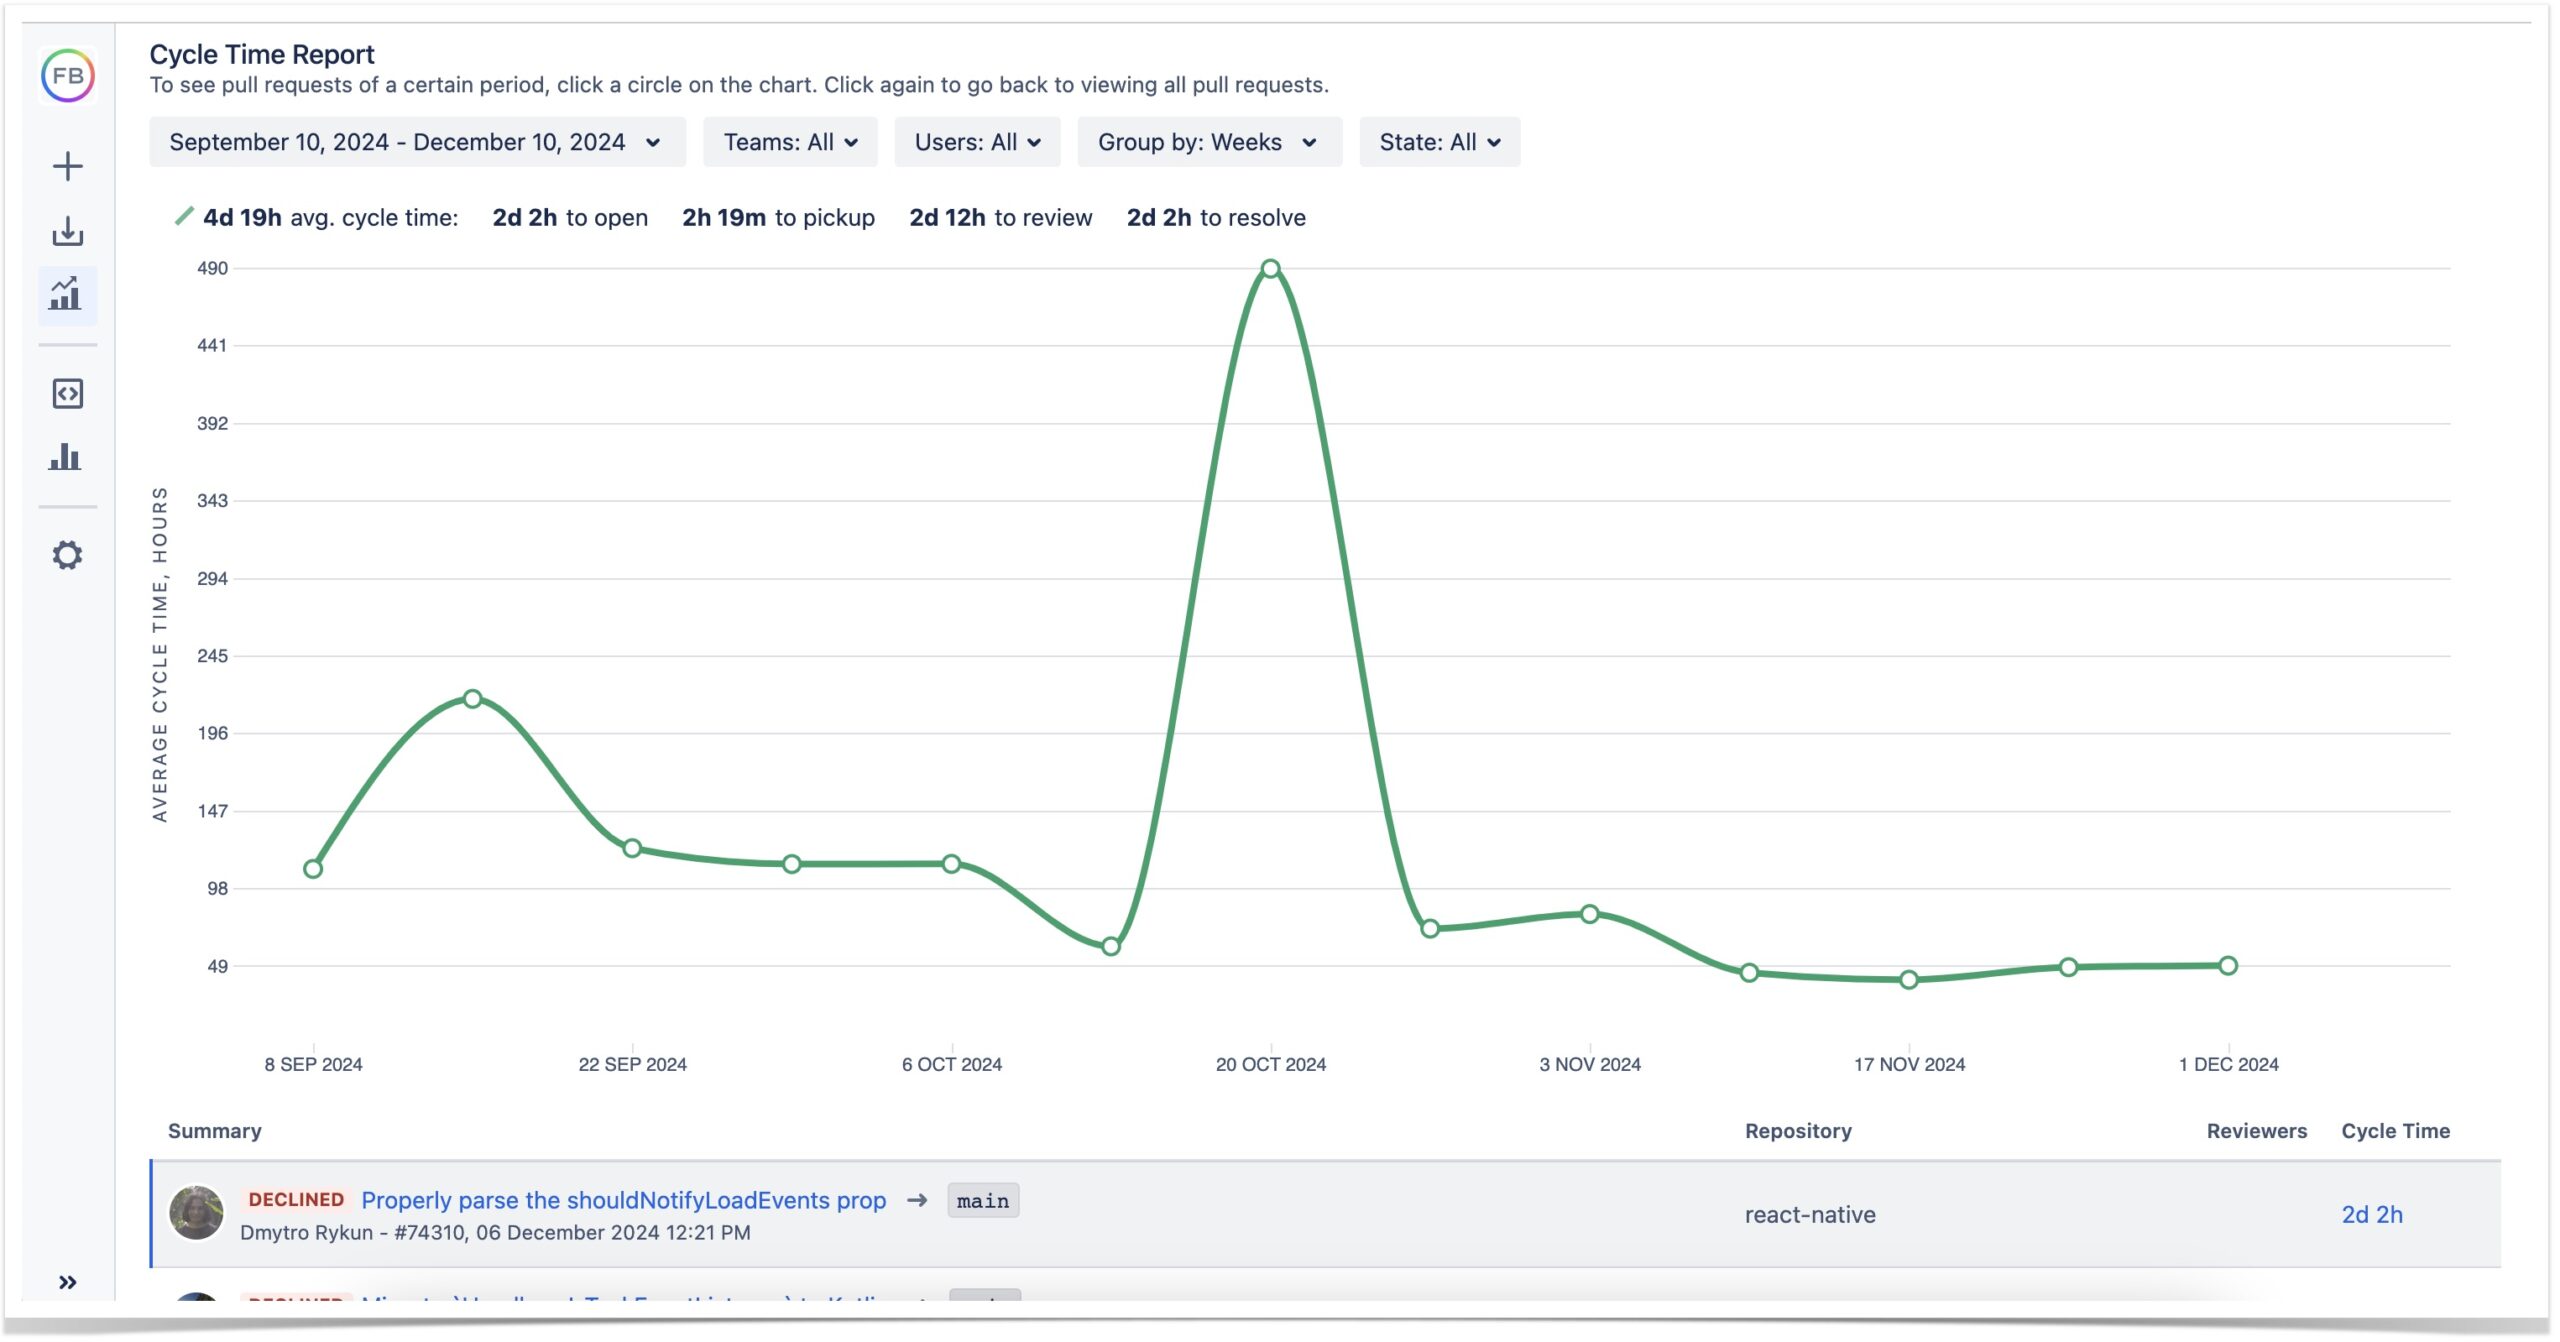
Teams looking to boost their code review process may find cycle time metrics particularly useful. Using Cycle Time Report, it is possible to track cycle time trends and review statistics for each cycle time phase.
To learn more about cycle time, check out our ultimate guide to cycle time in Bitbucket.
REST API Bitbucket statistics
If your team’s needs require a more custom reporting approach, we recommend implementing REST API resources for custom Bitbucket statistics. While this option requires some initial setup, the process can still be easy and straightforward with the right solution.
Commits
If you are looking for a way to automate commit statistics, consider the capabilities of Awesome Graphs REST API. For example, using this simple curl command, it is possible to fetch commit statistics for a particular user:
curl -X GET -u username:password "https://%bitbucket-host%/rest/awesome-graphs-api/latest/users/{userSlug}/commits/statistics"
The output will include the information on added and deleted lines of code as well as the total number of commits and will look like this:
{
  "linesOfCode": {
    "added": 2061114,
    "deleted": 1917168
  },
  "commits": 7262
}
Pull Requests
REST API will also come in handy to automate pull request statistics. For instance, to retrieve aggregated PR data on a project level, try the following curl command:
curl -X GET -u username:password "https://%bitbucket-host%/rest/awesome-graphs-api/latest/projects/{projectKey}/pull-requests/statistics"
Note how the output will include not only the total number of pull requests with a breakdown of their states but also cycle time statistics:
{
  "pullRequests": 16,
  "state": {
    "declined": 5,
    "merged": 7,
    "open": 4
  },
  "cycleTime": {
    "total": {
      "average": 78775,
      "median": 86400,
      "p75": 86400,
      "p95": 94800,
      "p99": 114960
    },
    "timeToResolve": {
      "average": 855,
      "median": 750,
      "p75": 850,
      "p95": 2325,
      "p99": 2865
    },
    "timeToOpen": {
      "average": 9262,
      "median": 10100,
      "p75": 10250,
      "p95": 11550,
      "p99": 11910
    },
    "pickupTime": {
      "average": 1818,
      "median": 800,
      "p75": 2500,
      "p95": 5500,
      "p99": 6700
    },
    "reviewTime": {
      "average": 3546,
      "median": 900,
      "p75": 4250,
      "p95": 12000,
      "p99": 14400
    }
  }
}
If you would like to learn more about data export, check out this detailed guide on REST API and CSV export resources available with the Awesome Graphs app.
How to get engineering statistics in your Bitbucket
To gain access to Bitbucket statistics, install the Awesome Graphs app and enjoy out-of-the-box reporting and data export in your workflow. And there is no need to hurry: take your time to make a decision by activating your 30-day trial and explore everything that the app has to offer at your own pace.
If you would like to learn more about the different out-of-the-box reports available, refer to our article on how to find pull request and commit reports in your Bitbucket.


