How to Reuse Project Related Spreadsheet Data in Confluence

You have to deal with a lot of data as a project manager. Spreadsheets like Excel, Google Sheets, or the Table Spreadsheet macro in Confluence work wonders in this case, as they are customizable, easy to use, and equipped with powerful features like pre-defined formulas and conditional formatting. But when you gather every project-related detail into a spreadsheet, it may become difficult to understand for anyone but you.
If you need to share specific details with others but can’t waste your time navigating the person through data, you can share a range of data from your spreadsheet using the Table Spreadsheet Include macro. And if you update the spreadsheet, the data you shared will change accordingly. In this blog post, we’ll walk you through the process of creating a spreadsheet excerpt in Confluence step by step and show you how to apply the macro to project related spreadsheet data.
How to create an excerpt from Table Spreadsheet
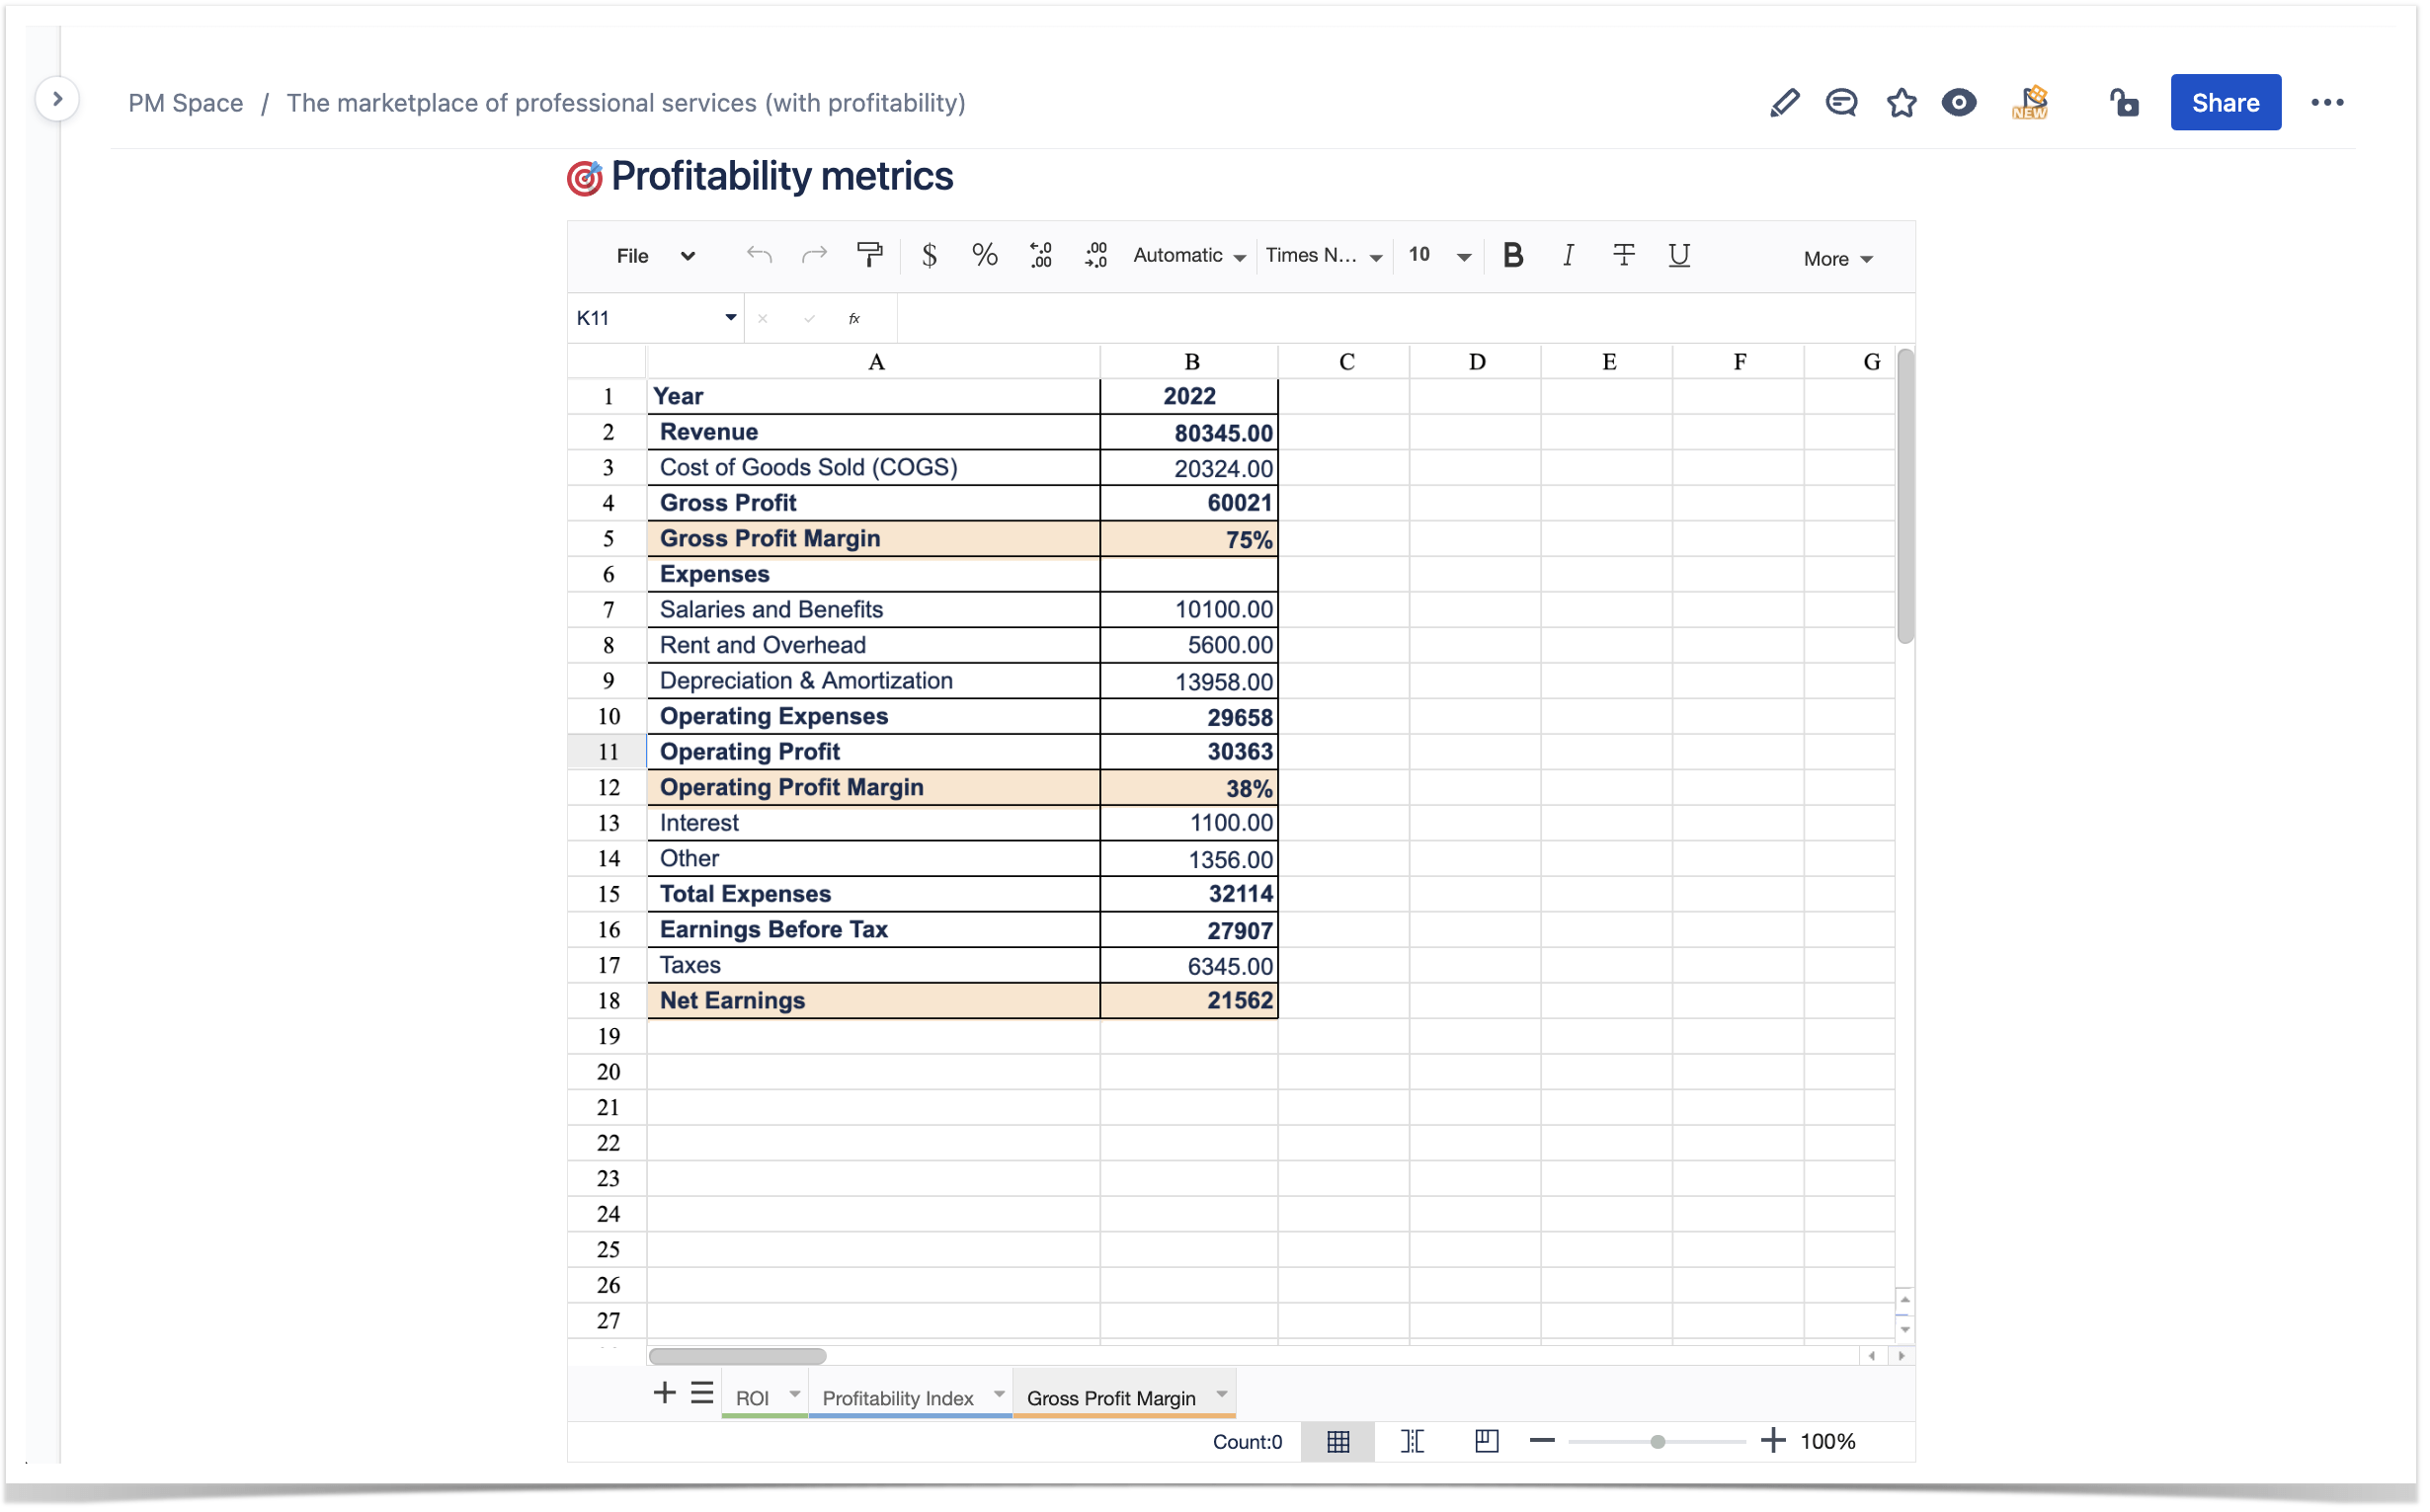
Confluence spreadsheets are available in the Table Filter and Charts app. Use the Table Spreadsheet macro to embed a spreadsheet onto a Confluence page and fill it with project-related data. After adding all the details and customizing the table, you can share some parts on other pages.
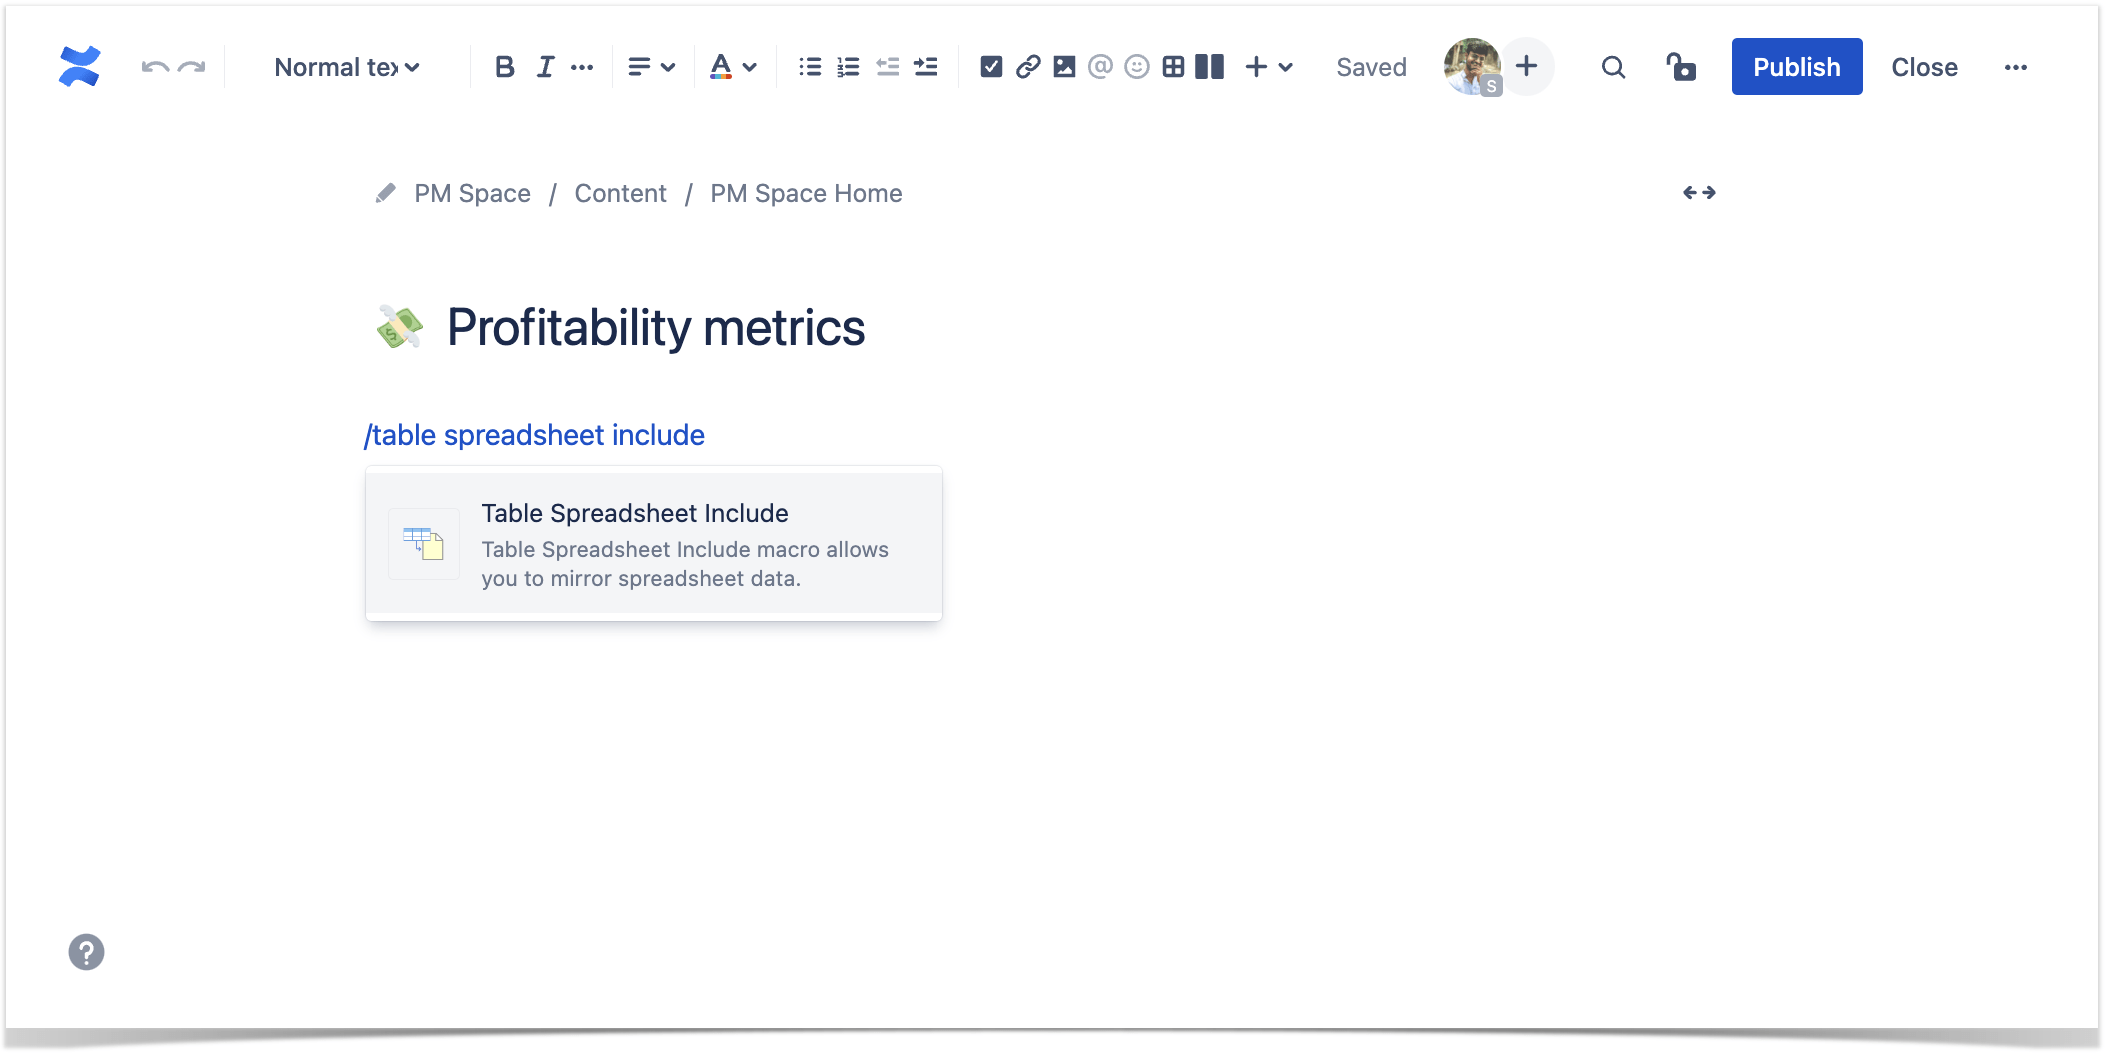
Open the page where you want to place some insights and go to the edit mode. Add the Table Spreadsheet Include macro.
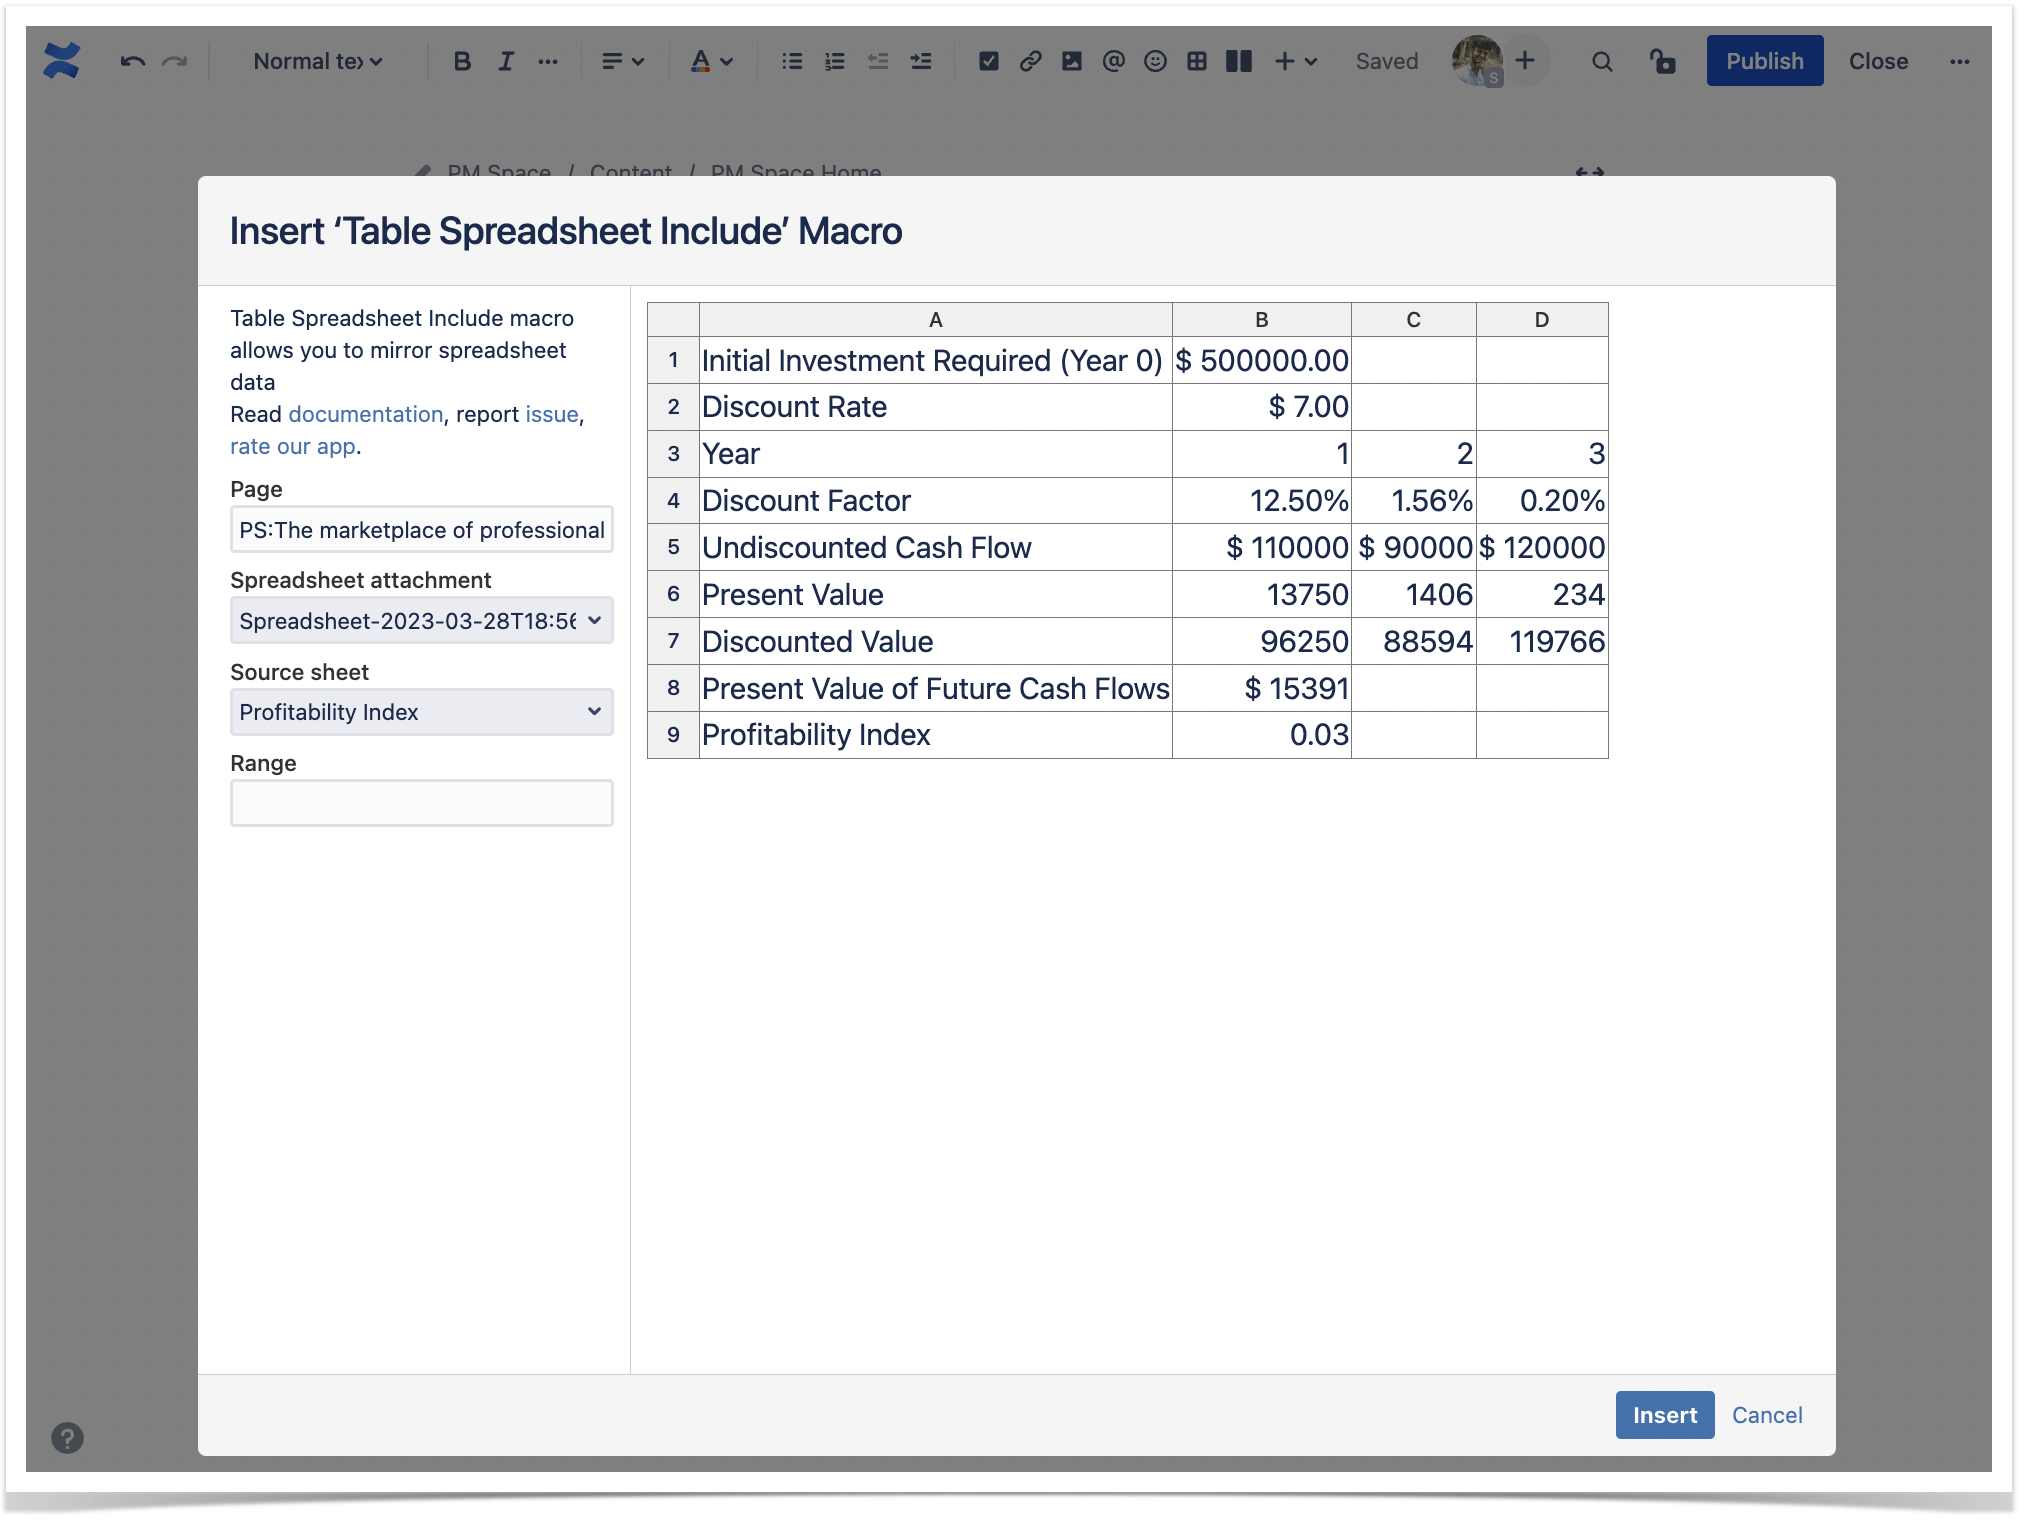
Now, fill in the macro settings:
- name of the page with the spreadsheet
- the exact spreadsheet, in case there are multiple spreadsheets on the page
- the exact sheet, in case there are multiple sheets in your spreadsheet
- data range or a single cell you would like to display on this page
Save the macro and the page to see the results.
Use case
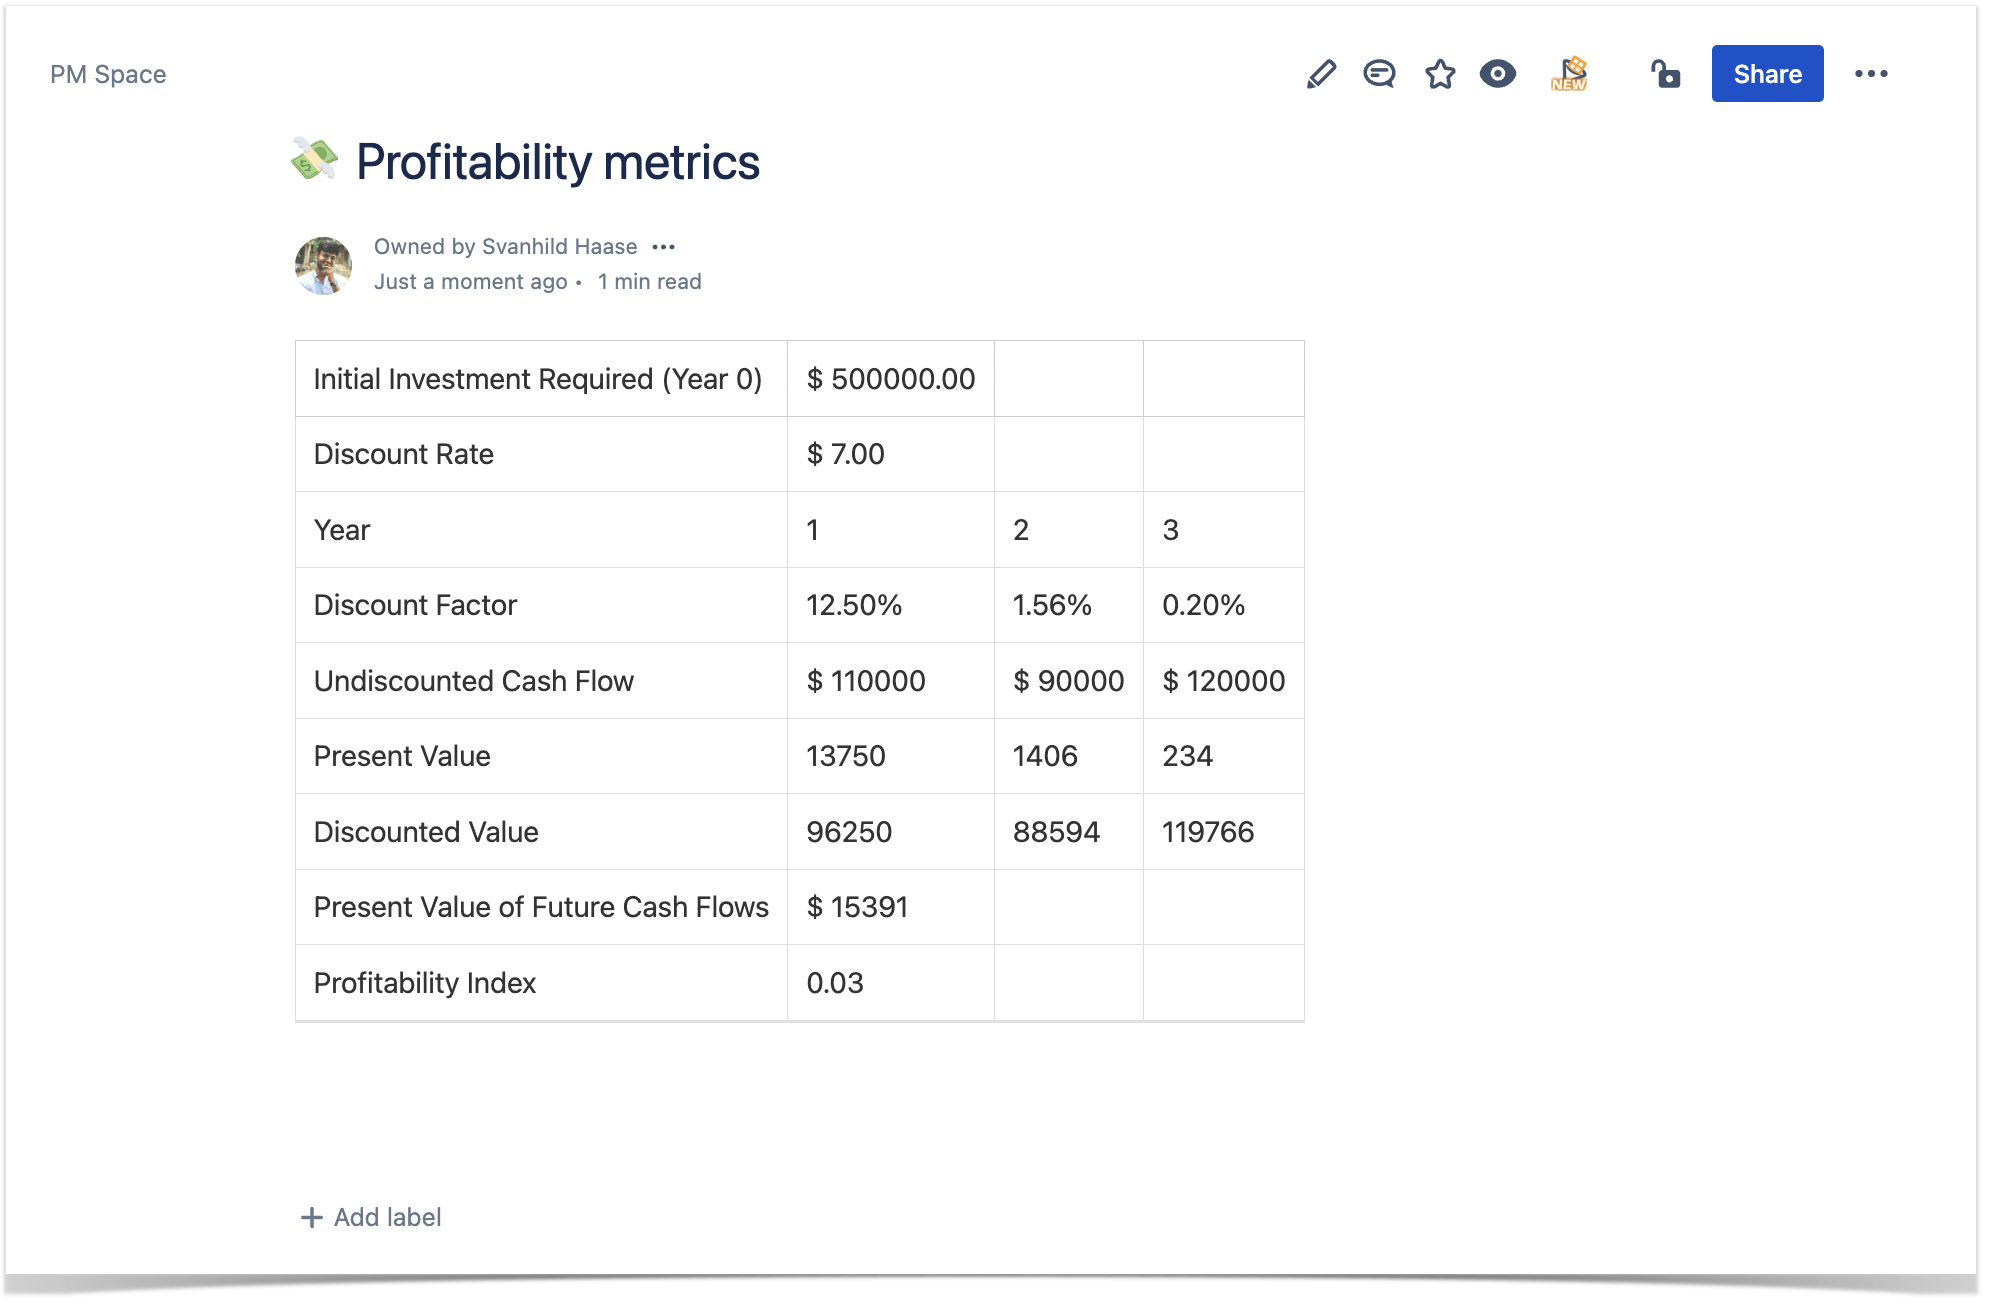
People generally use spreadsheets for calculations since built-in formulas make it easy to automate. As a project manager, you may calculate various metrics, such as profitability index or ROI, and then want to attach the result to project details.
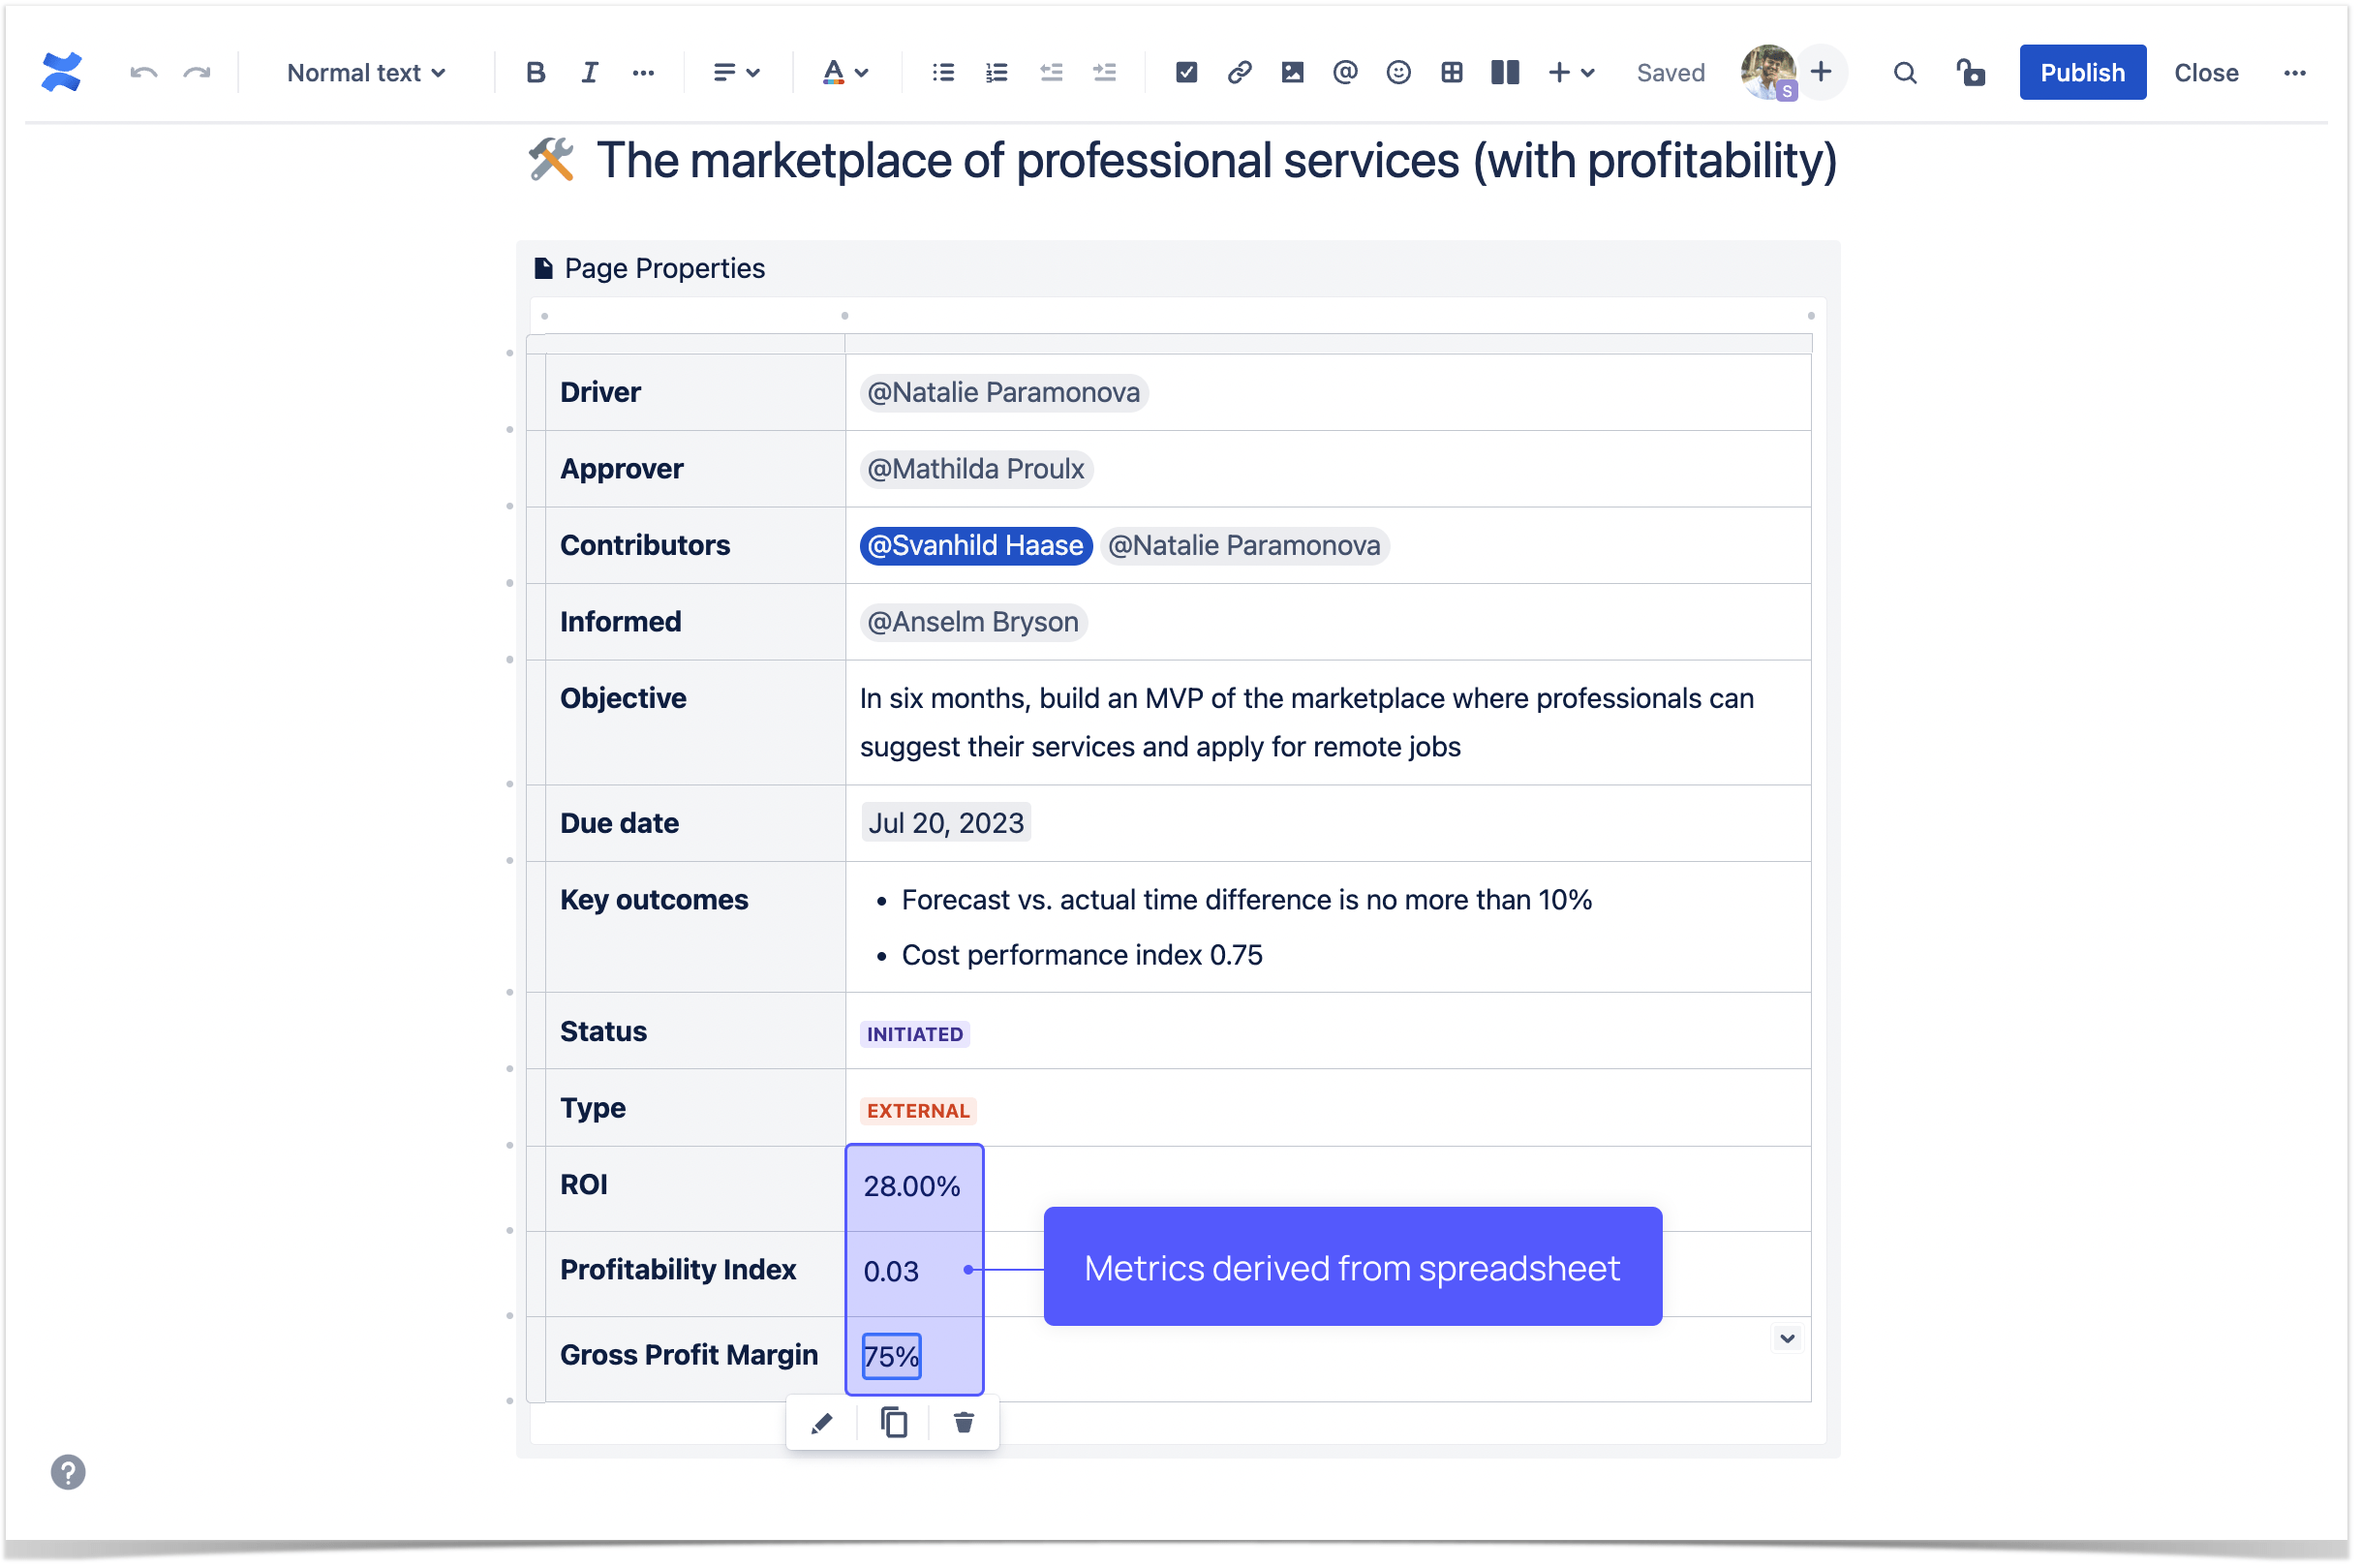
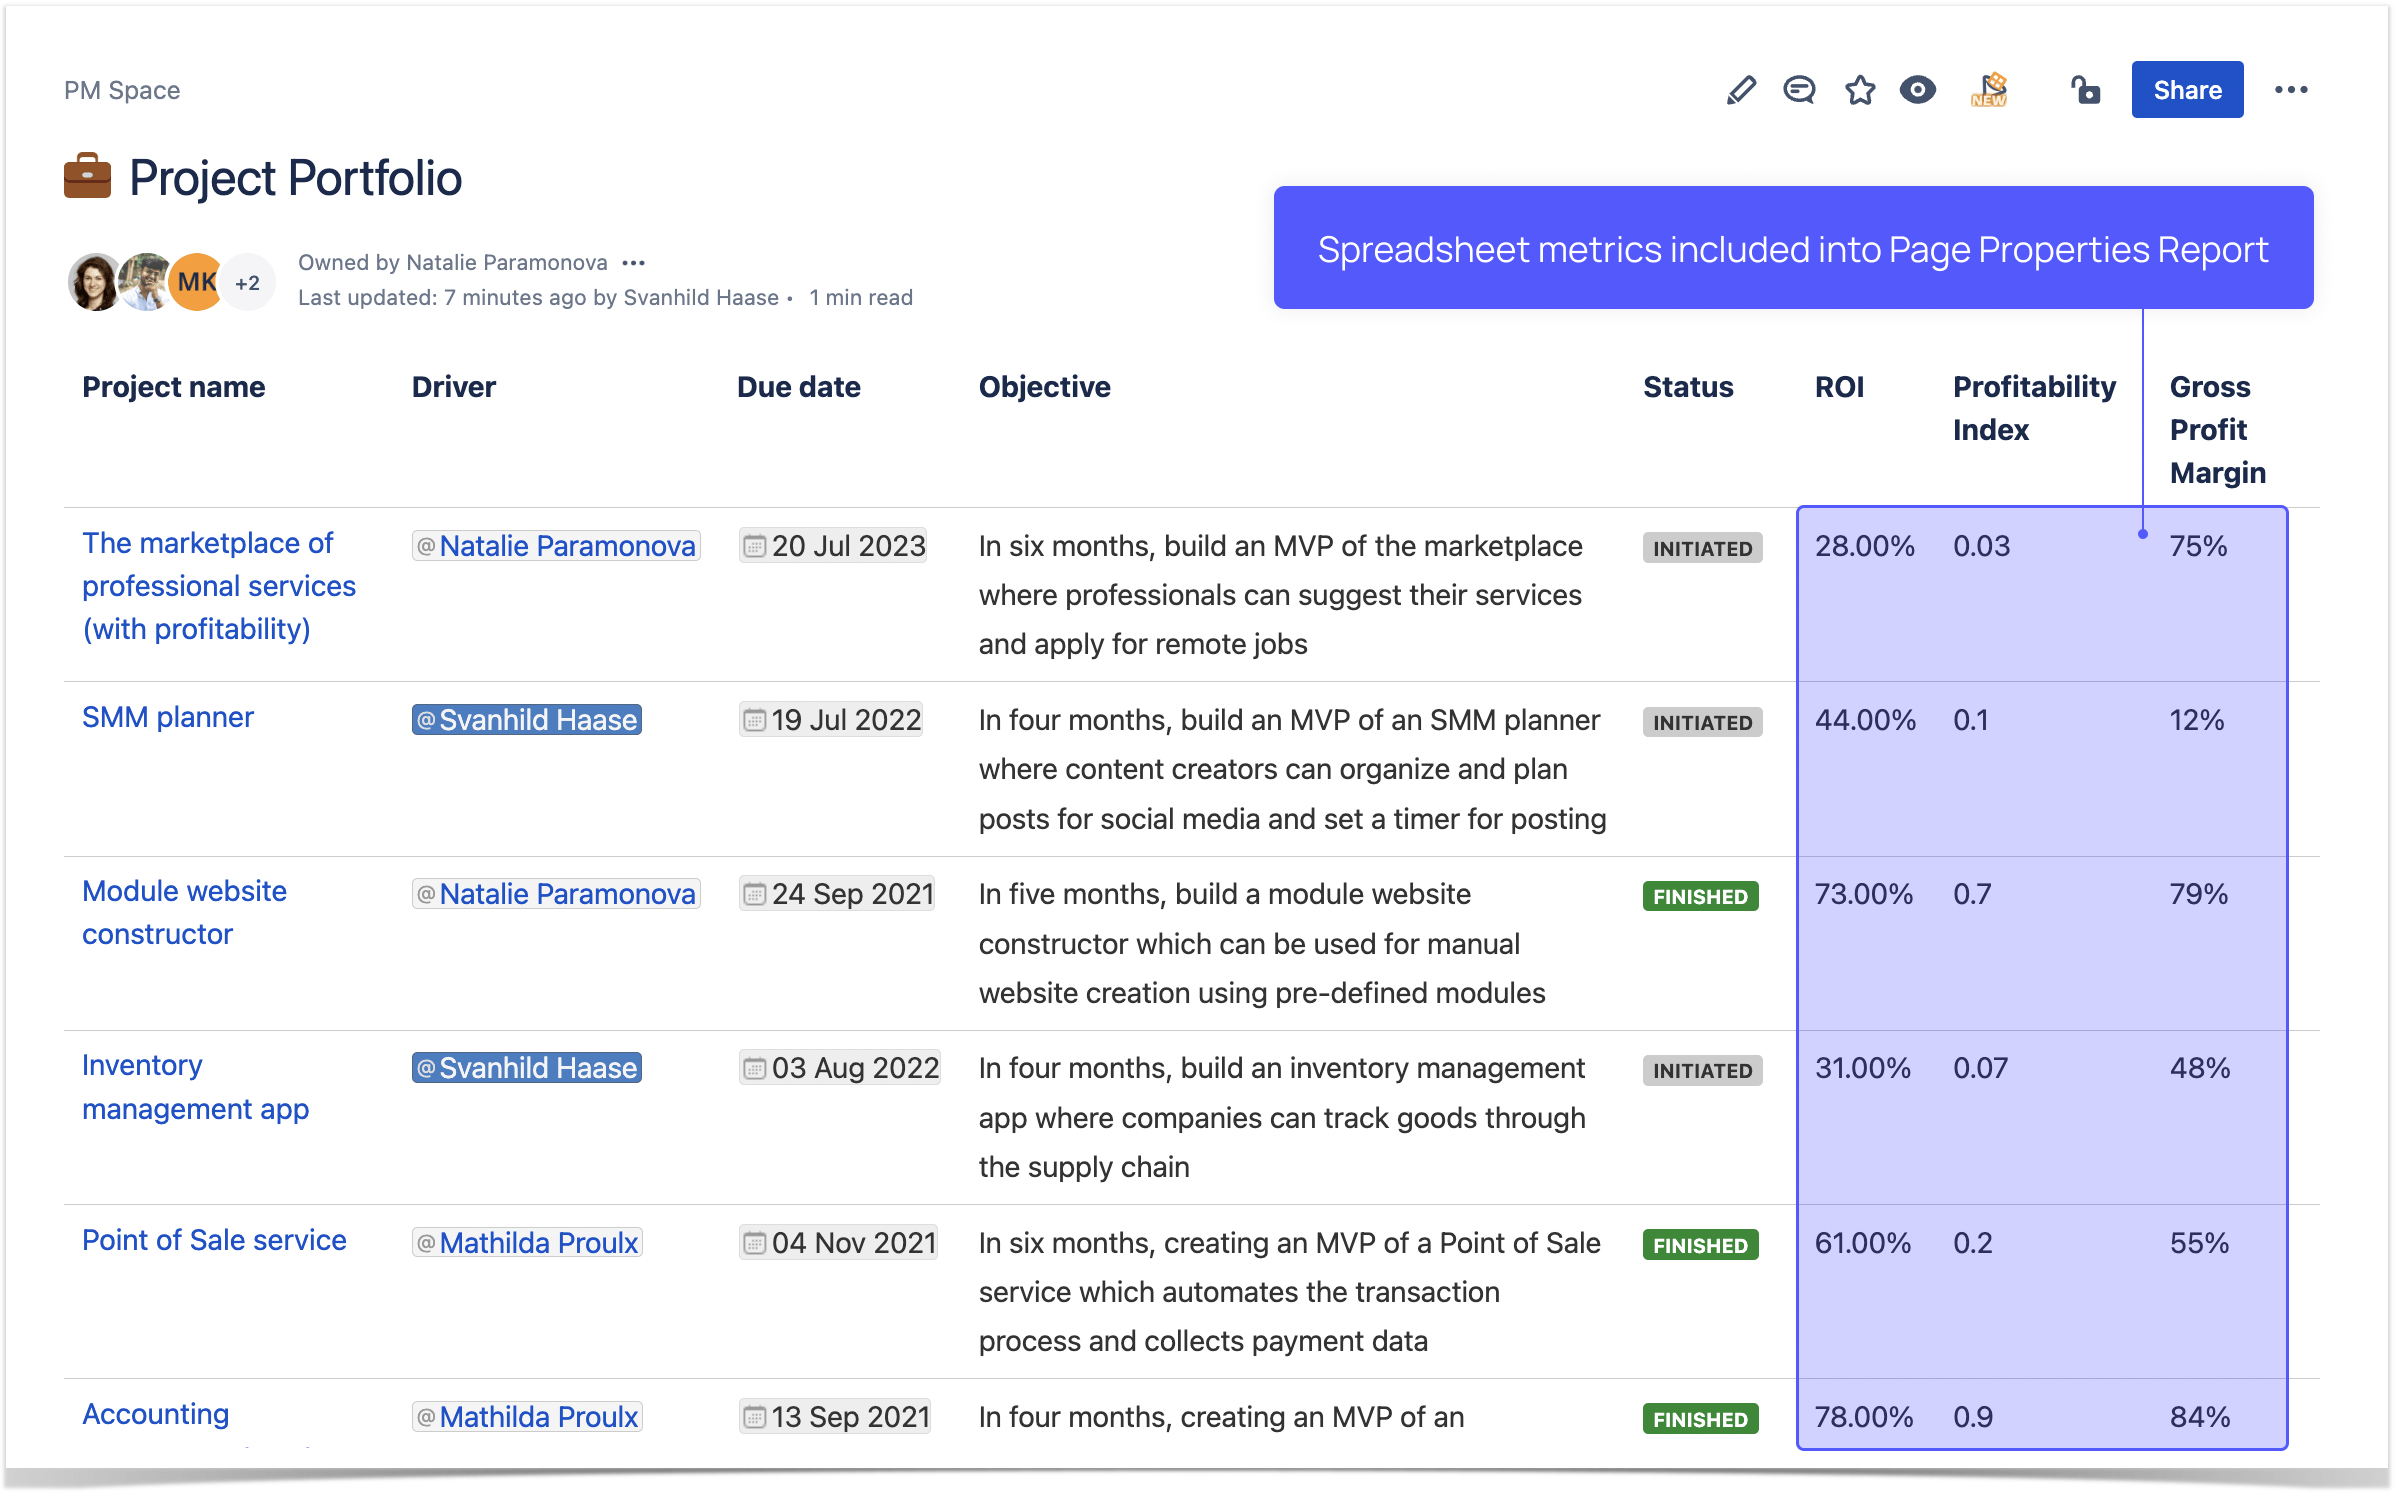
In our case, each project has a summary that is further used to create an overall overview of the workflow with the help of the Page Properties Report macro. But project-related calculations may be stored in a spreadsheet on a different page.
We reuse calculated metrics from the spreadsheet shown previously in the project overview. To include the results into the table, we select a specific cell with Table Spreadsheet Include. While the final result looks just like a regular table, in the edit mode you can still change the data pulled out from the spreadsheet.
Want to try the features provided by the Table Filter and Charts for Confluence app? Follow the instructions below.

![]()