Project Development in Confluence Explained Simply

Maria Palagina from Tinkoff wrote this blog post and published it on a Russian collaborative blog about IT. Our team read it and just loved how Maria described the way she works with Confluence labels, templates, and macros, including the Page Properties macro. We also want to thank Maria for featuring our app. We translated this blog post into English to share it with our readers.
Hi everyone!
My name is Masha, and I work as a quality assurance engineer at the Tinkoff group of companies. QA work involves a lot of communication with different people from different teams, and I was also a manager and lecturer in educational programs, so my communication experience was as rich as possible. And at some point, I blew up: I realized that I couldn’t, absolutely couldn’t stand filling the hellish amounts of unreadable tables and documents anymore.
I’m sure that each of you pictured what I am talking about and is now covered with cold sweat:
- lists of last names with no alphabetical order,
- tables with hundreds of columns that have a broken layout,
- tables with thousands of table rows, when you brush-burn you finger with mouse scrolling because you need to view the heading,
- lots of pages with unnumbered instructions,
- hundreds of letters we forward each other, I mean the letters with information we need to analyze and put in the same unreadable tables.
I had some time to calm down, and after that, I decided to write this blog post. I will tell you how to smoothly (and even easily) maintain non-technical documentation. I hope this blog post goes viral, and the level of pressure in teams that deal with developers will decrease at least a little, and people (myself included) will become a little happier.
The tools
Product documentation is often stored alongside code, and it’s OK. Non-technical documentation is usually stored just anywhere. Often people try to migrate information from different sources to Confluence, and we are no exception. So my blog post will be about this solution.
Confluence is a robust wiki platform. It allows you to work with data and display it the way you want: formatted text, tables, multiple diagrams. It is a very interesting and powerful tool, but if you don’t know the exact recipe, you will get another ton of unreadable documents! But I will show you how to cook it!
Macros
Practically all the magic in Confluence happens with the help of macros. There are a lot of macros, and you can combine them. They can be paid and free; I will show you different macros with the links to their documentation.
The macro interface is as simple as possible. To add a macro, click on the plus sign and select the desired item from the list.
If it is an independent macro, I mean, when it does not require the insertion of something else inside itself, it looks like a block.
If you need to insert something into the macro to make it work, it looks like a frame.
Moreover, you can put as many macros inside the frame as long as this pyramid of macros makes logical sense.
Each macro has a preview; it immediately shows whether you have configured the macro correctly.
Templates
In addition to macros, there is a handy tool that helps you prefill content; it is a template.
You can use templates when you create a page. Just click on the three dots next to the Create button and select the required template.
In this case, all content from this template will be added to the created page.
Anyone can create pages from templates; however, only users with permissions can create and edit these templates. You can add instructions to any template to describe how to manage the page.
The magic of tables
As a techie, I dearly love tables, and I can wrap almost any information inside a table (although it’s not always useful). The tables themselves are clean, structured, scalable, and magical!
But you can ruin even such a great thing as a table. Or you can successfully use it and make it even better. Now I will tell you about that.
Filtration (the paid macro)
You can turn any large table into a more readable and not so large table with the help of filtration. You can use the Table Filter macro for this purpose.
You need to insert a table inside this macro (it can be even the ugliest one, the most important thing is to insert the whole table). You can choose the columns to filter with the help of the dropdown filter, the text filter, the number filter, and the date filter.
Just imagine that all information about job candidates is in the table list. Of course, the list is not sorted because people come in for an interview not in alphabetical order. And you need to understand if you’ve already interviewed the job candidate before. All you need to do is to put this mess inside the Table Filter macro, add the text filter to search for last names, and voila, the information you are looking for is on your screen.
It is worth noting that the filtration of large tables can affect the system performance and page loading time. That is why putting the large table inside the filter is a temporary solution, it is better to have a workflow when people do not need to create large unreadable tables (you will find such an example at the end of this blog post).
Sorting (the paid macro)
Using the magic Table Filter macro, you can also number the rows and set the default sorting by any column. Or you can click any column of the table that is already in the Table Filter macro, and it will filter the table by this column.
For example, you have the same table with job candidates, and you need to check the number of job interviews you performed for a given month — sort by date and be happy.
Pivot table (the paid macro)
Now let’s move to a more interesting case. Imagine that your table is huge, and you need to calculate something with the help of this table. Of course, you can copy it to Excel, calculate what you need, and upload the data back to Confluence. Or you can use the Pivot Table macro and get the result that will be dynamically updated.
For example, you have a table with information about all employees: their locations and job titles. To find out how many people are in each city, you need to choose the row label (Location) and operation type (Count) in the Pivot Table macro.
Of course, you can group data by several criteria at once, you can read about all the features in the documentation.
Charts (the paid macro)
Like I said, not everyone loves tables as much as I do. Unfortunately, the majority of managers do not like them at all. But everyone loves vibrant color charts. The creators of Confluence, of course, knew about it (probably they also have bosses who love reports and charts). That is why you can use the magic Chart from Table macro. You need to insert the pivot table from the previous paragraph into this macro, and voila, your boring gray data is beautifully visualized.
Of course, this macro also has settings. You can find the link to the documentation of any macro in the edit mode of this macro.
Ease of aggregation
The information from the previous paragraphs probably was not news for you. But now you know how to use macros, and I can move on to a more interesting part of the article.
Labels
It’s terrible when people store information on one unstructured page or in a large table. And it’s even worse when parts of this information are not only unreadable but also scattered all over your Confluence. Fortunately, you can collect the scattered data in one place. To do this, use the labels (like tags everyone knows from social networks).
You can add as many labels as you need to any page. If you click on a label, you will be redirected to the aggregation page with the links to all information with this label, as well as with a set of related labels. The related labels are the labels you often find on the same page.
Page Properties (the free macro)
To structure information, you can add another great macro to the page that is Page Properties. You need to insert a two-column table into the macro; the first one lists your key, and the second will contain the value for each key. Moreover, you can hide the macro from the page to read the content without interruptions, but at the same time, the page will still have the necessary keys.
Pay attention to the ID. It is easy to set it to add different property groups to different pages (or even different property groups to one page).
Reports
You can create reports with the help of labels. For example, the Content Report Table Macro collects all pages with a specific set of labels.
But you can create a more interesting report with the help of the Page Properties Report Macro. It also collects all pages with a specific set of labels, but it not only displays a list of them but compiles a table (do you catch my drift with the beginning of the blog post?), where columns are the keys to the page properties.
You get a pivot table based on information from different sources. It’s nice that it has such handy functions as adaptive layout and sorting by any column. Also, you can configure this reporting table inside a macro.
When you configure your report, you can remove some columns, set the default state, or the number of displayed records. You can also set the page property ID to see only the information you need.
For example, you have a lot of pages with information about employees; these pages have a set of properties about each person: their level, location, dates they joined the team, and so on. These properties have the ID = employee_inf. There is also another set of properties on the same page that collects information about each person, as a part of the team: their roles, teams, and so on. These properties have the ID = team_inf. When creating the report, you can display only information about one ID or two at once depending on your needs.
The beauty of this approach is that everyone can collect the insightful table they need; this table will not duplicate data and will be updated automatically when the main page is updated. For example, a team lead doesn’t care when developers got a job, but the team lead needs information about what role each of them plays in the team. The team lead will create a report about the team. And the accountant doesn’t care who performs what role, but the job titles are relevant. The accountant will create a report on the job titles. In this case, the source of information will not be duplicated or transferred.
The final process
Instruction
So, now we can beautifully structure and efficiently aggregate information in Confluence using macros. But in a perfect world, you need to make sure that new information is immediately structured and added to the aggregation mechanisms we’ve already used.
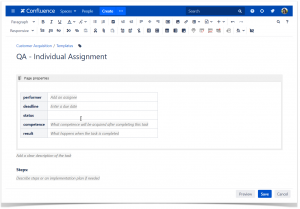
In this case, a bundle of macros and templates can help you. To make people create new pages in the required format, you can use the Create from Template Macro; it adds a button to the page. When you click it, you create a new page from the required template. This is how you make people immediately work the way you need.
In this case, the final process looks like this:
- You create a template for information of a specific type.
- You add labels and page properties to the macro of this template.
- In any Confluence space you choose, you create a parent page with a button that creates a child page from the template when you click it.
- You grant access to the parent page for users who are supposed to generate the required information (according to the desired template, by clicking the button).
- You draw up a report on the page properties with the help of the labels you specified in the template.
- You are enjoying the moment. Now you have the required information presented in a user-friendly way.
Pitfalls
As a quality engineer, I can say without hesitation that there is nothing perfect in the world. Even the divine tables are not perfect. And the above-described process has pitfalls.
- If you decide to change the names or a set of page properties, you will have to update all objects you created, so that their data is correctly pulled into the summary report. It is sad, but, on the other hand, it makes you think through the architecture of your set of information in detail, and it is an exciting task.
- You will have to write a decent amount of instructions on how to fill out tables and use labels. But, on the other hand, you can share this blog post with all the people involved.
How to store non-technical documentation
You can organize the storage of almost any information with the help of the above-described process. The beauty of this approach is that it is universal; when users get used to it, they stop making a mess. Also, the capability to collect various statistics on the fly and draw beautiful diagrams based on it is a significant (but not a free) plus score.
I’ll show you how we maintain information about our team.
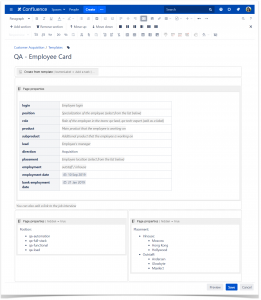
We decided to create an employee card for every team member. This means that we have a template that every new person uses to create this card and maintain all personal information in it.
As you can see, we have a detailed table of properties and instructions on how to maintain this page. Employees add some labels themselves using the instructions; the template contains only the main ones:
- the employee-card label
- the direction-involve label
- the team-qa label
As a result, when all users created cards for themselves, we have a complete table with employee information. We can use this information at various points. Resource managers can draw up general tables for themselves, and team leads can create team tables adding a team label to the selection.
You can see different reports using labels; for example, if you use the qa-upgrade-plan label, you will see all QA development tasks. At the same time, each person maintains critical information and development plan in their employee cards, creating an embedded page from the template of development plans.
Resume
Maintain any documentation and do not let it blur your reputation and drive your users mad!
I do hope that my blog post will be useful for you, and there will be order in documentation all over the world.


