How Researchers Track Developer Productivity in Bitbucket

I am in charge of several people in a development project and Awesome Graphs helps me to see the best tasks assignation, the team performance, and the critical points along the year. In this way, I can make the best decisions to reduce costs and shorten the turnaround time for the solutions. Moreover, it is a way to help boost the competitiveness of my team, track developer productivity, and not be intrusive in their personal work.
Javier López Ruiz, Team Lead, Planificando
In this case study, we’ll uncover how one of our customers uses Awesome Graphs to analyze contribution statistics and track developer productivity in Bitbucket. The company specializes in the research and development of software solutions for optimizing logistics planning and transportation using advanced AI techniques. While Bitbucket meets their primary needs regarding code management, there are no built-in features they can use to monitor developer activity in projects and repositories.
That is why they decided to extend the Bitbucket functionality by installing the Awesome Graphs for Bitbucket app, which brings in multiple graphs and charts and allows the team to achieve their goals.
Commit log
As a commit log, the client uses the activity stream displayed below the Contributions or Activity graphs.
The Contributions tab expands each Bitbucket user’s profile and shows all commits and pull requests made by the user over the past year. So the activity stream under this graph shows all commits and PRs of a particular user, including:
- related files
- links to the associated Jira issues
- commit hashes
- change type lozenges

The Activity graph displays recent developers’ contributions to a particular project or repository and is available on the Graphs page on project or repository levels. The activity stream under this graph shows all recent commits and pull requests of a chosen repository or project.

The client mainly uses the activity stream of the Activity graph:
- on the project level – to see the commit log across all repositories of the project
- on the repository level – to view the list of recent commits across all branches in a particular repository
Commit activity to track developer productivity
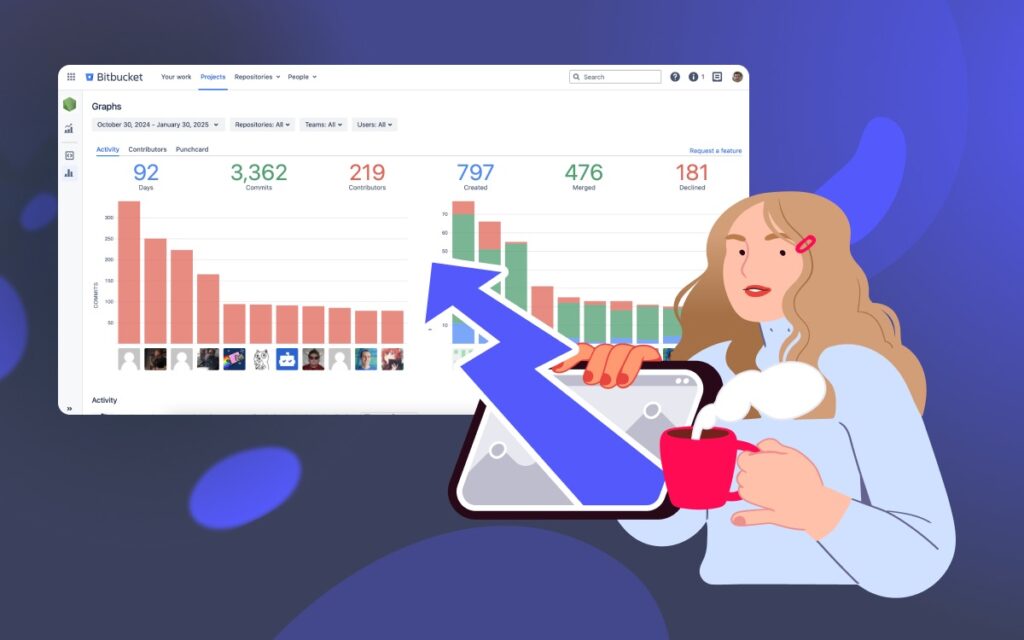
The customer’s team lead finds the Contributors graph especially useful when evaluating the team’s performance. The chart consists of two parts:
- summary graph built based on the total number of commits made in a repository or project over a certain period
- personal graphs of each contributor to a repository or project.

On the project level, the Contributors graph is typically used to review trends regarding each team member’s number of commits. The repository selection drop-down menu allows the team lead to drill down into details and focus on the statistics of a particular project’s repository.

With the help of individual graphs, the team lead tracks developer productivity in Bitbucket and gains the following insights:
- identifies periods when a contributor was most active
- spots the developers with the highest number of contributions as the most active contributors listed at the top
- reviews the number of commits and lines of code (added and deleted) made by a specific contributor over the selected time frame.
Weekly commit frequency
Moreover, the customer monitors the development flow using the Commit Activity Report. It shows:
- bar chart with the number of commits made over the last year grouped by week
- scatter chart with detailed daily commit statistics of the selected week

The team reviews the commit frequency using this report every week. In short, if the number of commits is off, they investigate what happened and how it can be normalized.
Contributor calendar to monitor individual activities in Bitbucket
From time to time the team lead needs to get a summary of each team member’s contribution activity. For that reason, they use the Contributions tab in the Bitbucket user’s profile.
The calendar visualizes the number of contributions (commits and pull requests) a user made daily during the past year in all repositories. They choose the time span they need to analyze and examine the Contributor calendar to see:
- days when a user was most active based on the number of commits and pull requests
- how many contributions a user made on a particular day
- details about the user’s commits and pull requests in the activity stream located below the calendar

When analyzing the past year’s results, they also look at the statistics below the calendar. These include the total number of contributions for the last year, the day with the maximum number of contributions, and the current and the longest strikes.
Conclusion
With the Awesome Graphs for Bitbucket app, our client is getting the contribution statistics data in a summarized and visual form that is easy to analyze and use for decision-making.
Moreover, this solution helps the team stay on track, discover bottlenecks as soon as they arise, and improve work processes based on the insights gained from studying graphs at retrospective.
Check out our other articles to see how you can benefit from using Awesome Graphs for Bitbucket in your work:
- How to See User Activity in Bitbucket Data Center
- How to Find Pull Request Metrics in Bitbucket
- How to Get Custom Reports from Bitbucket Data