Pull Request Analytics: How to Get Pull Request Cycle Time / Lead Time for Bitbucket

In this article, we’ll describe two ways to get pull request Cycle Time / Lead Time for Bitbucket Data Center using the Awesome Graphs for Bitbucket app.
Awesome Graphs is an app that boosts data observability for development data in Bitbucket. It offers an array of ready-to-use analytics and provides data export for tailored automated solutions.
What Pull Request Cycle Time is and why it is important
Pull Request Cycle Time / Lead Time is a powerful metric to look at while evaluating the engineering teams’ productivity. It helps track the development process from the first moment the code was written in a developer’s IDE and up to the time it’s deployed to production.

Please note that we define Cycle Time / Lead Time as the time between the developer’s first commit and the time it’s merged and will refer to it as Cycle Time throughout the article.
The Cycle Time is commonly composed of four metrics:
- Time to open (from the first commit to open)
- Pickup time (from open to the first non-author comment)
- Review time (from the first comment to approval)
- Time to resolve (from approved to merge or decline)
With this information, you can get an unbiased view of the engineering department’s speed and capacity and find the points to drive improvement. It can also be an indicator of business success, as controlling the pull request Cycle Time can increase output and efficiency and deliver products faster.
How to find Cycle Time in Bitbucket
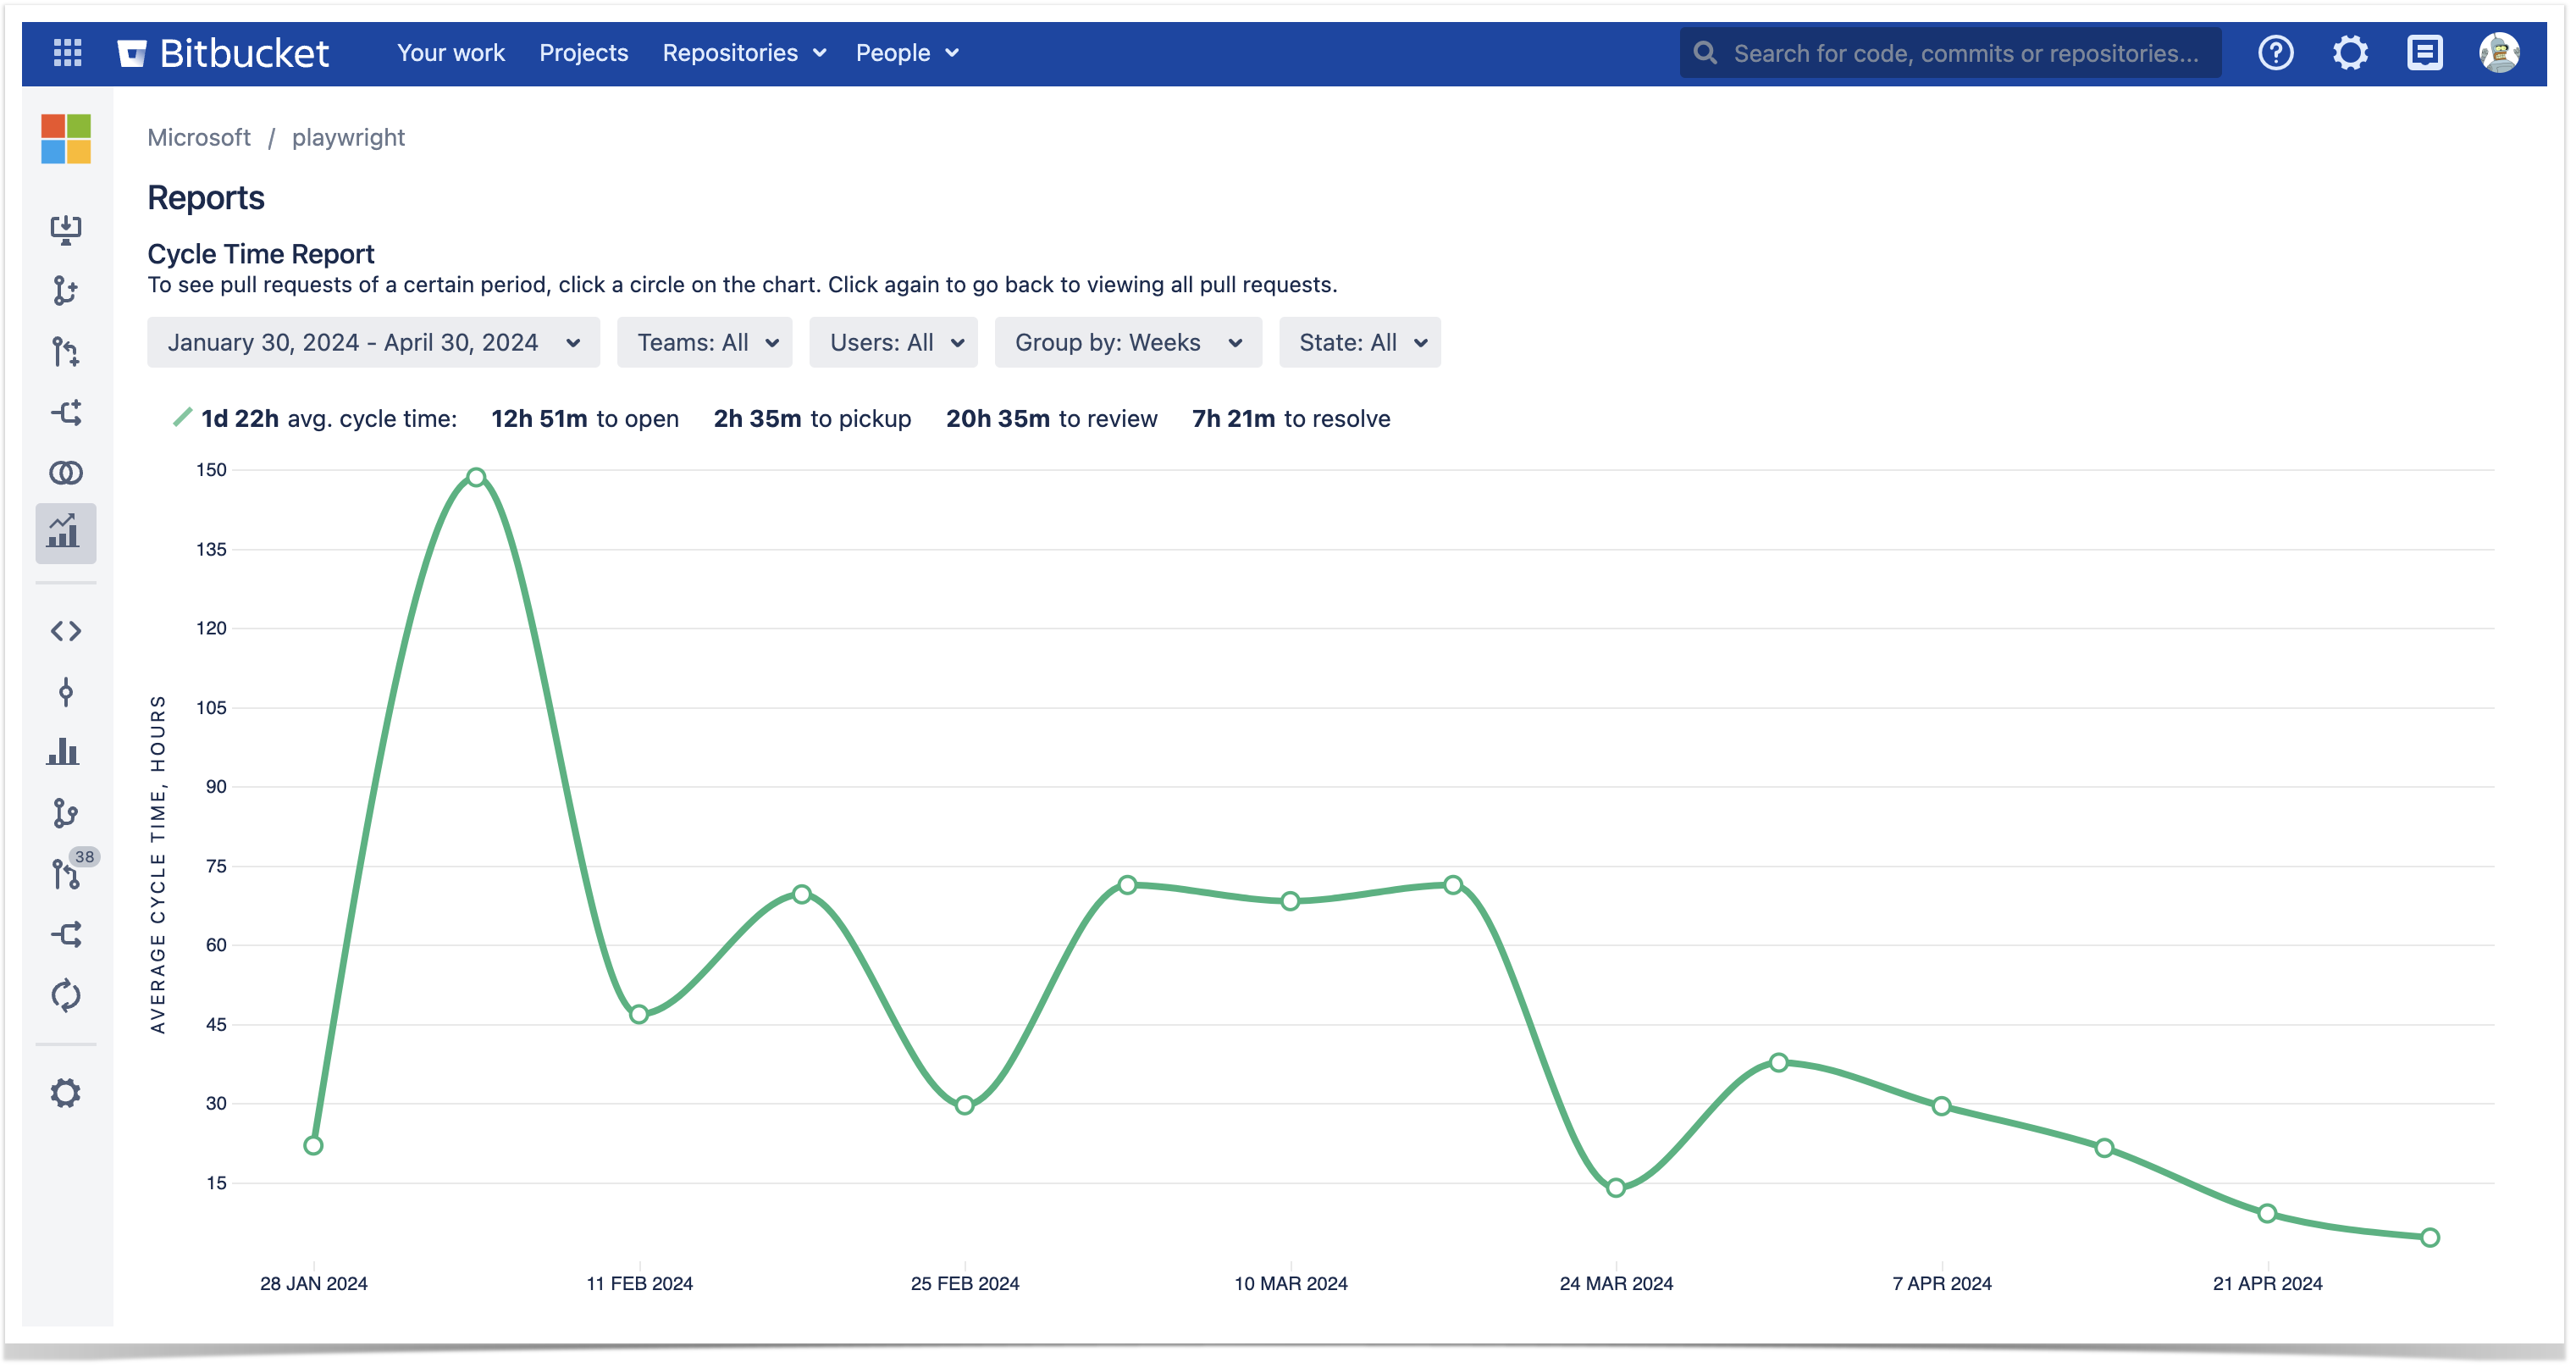
Using Awesome Graphs for Bitbucket, you can track the average Cycle Time of pull requests at the project and repository levels. Additionally, you can find the specific Cycle Time of a single pull request.
For each Bitbucket project and repository, the app displays the average time it takes to resolve pull requests as well as the breakdown of the average time by stage. You can also configure the report to see the average Cycle Time of a particular team or user in a chosen project or repo.
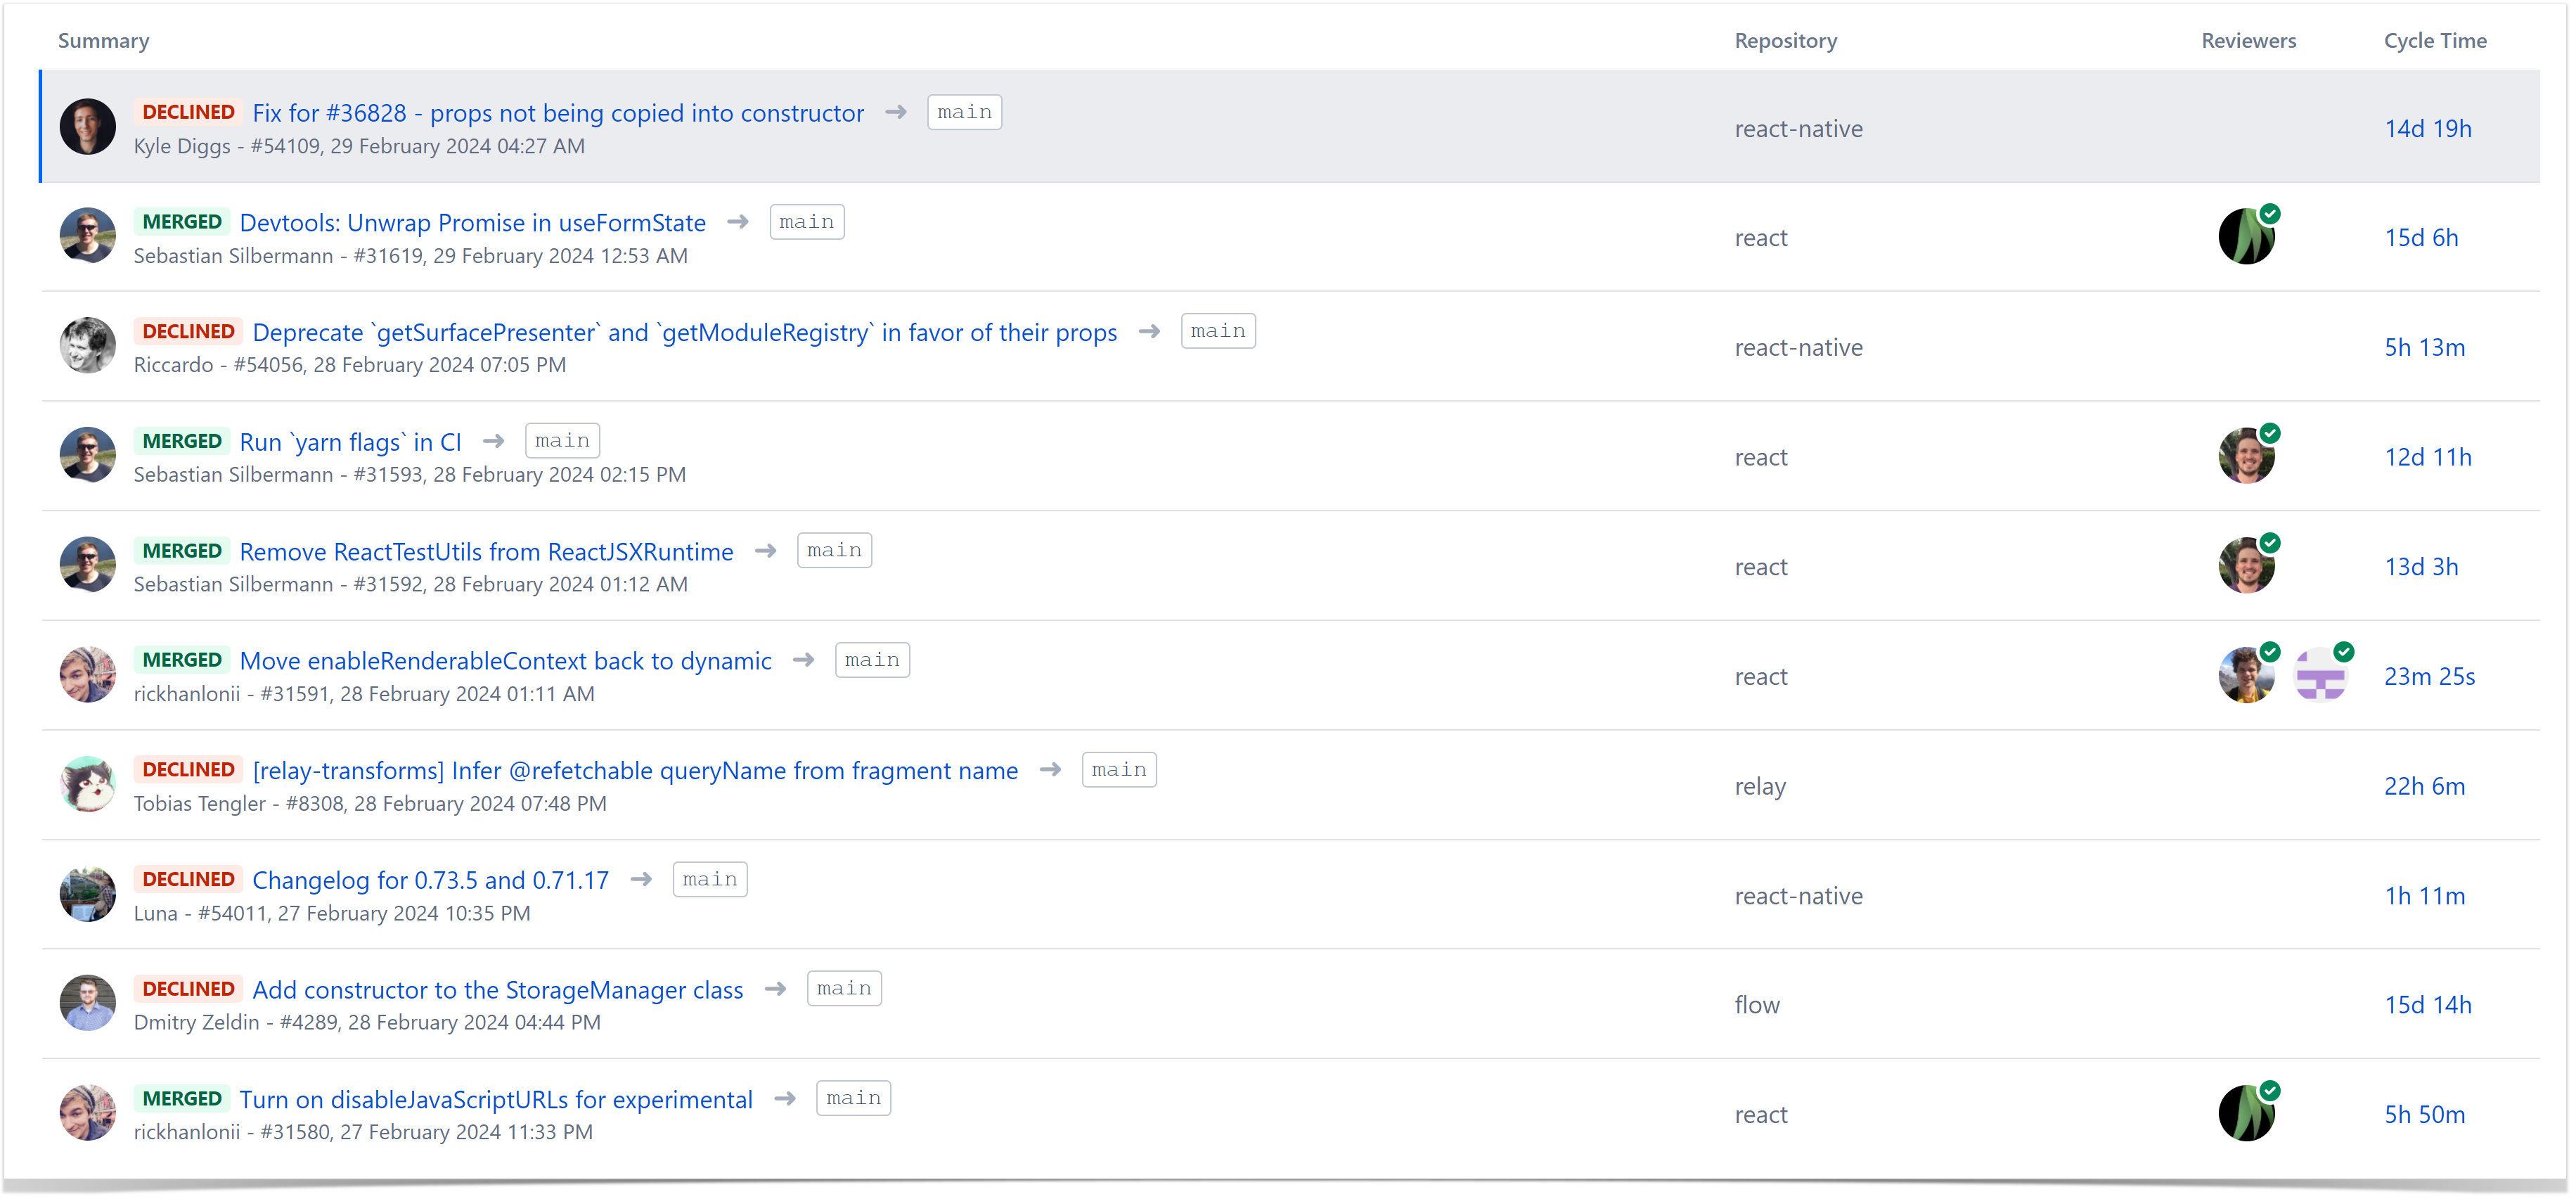
Below the report, you can find the list of all pull requests included in it, along with their Cycle Time.
Clicking on a value in the Cycle Time column against a particular pull request allows you to see the breakdown of the Cycle Time and analyze each metric.
How to export Time to Open, Time to Review, Time to Approve, and Time to Merge metrics
Another way to track Cycle Time is to export pull request data from Bitbucket and build a custom report. You can get all the necessary statistics from the Awesome Graphs for Bitbucket app in two different ways: via REST API and into a CSV file from Bitbucket UI.
Export Cycle Time data from Bitbucket UI
Using Awesome Graphs, you can obtain data directly from Bitbucket. Here is an example of a file you’ll get:
To get this report, go to the People page and select All users from the People dropdown menu in the header.
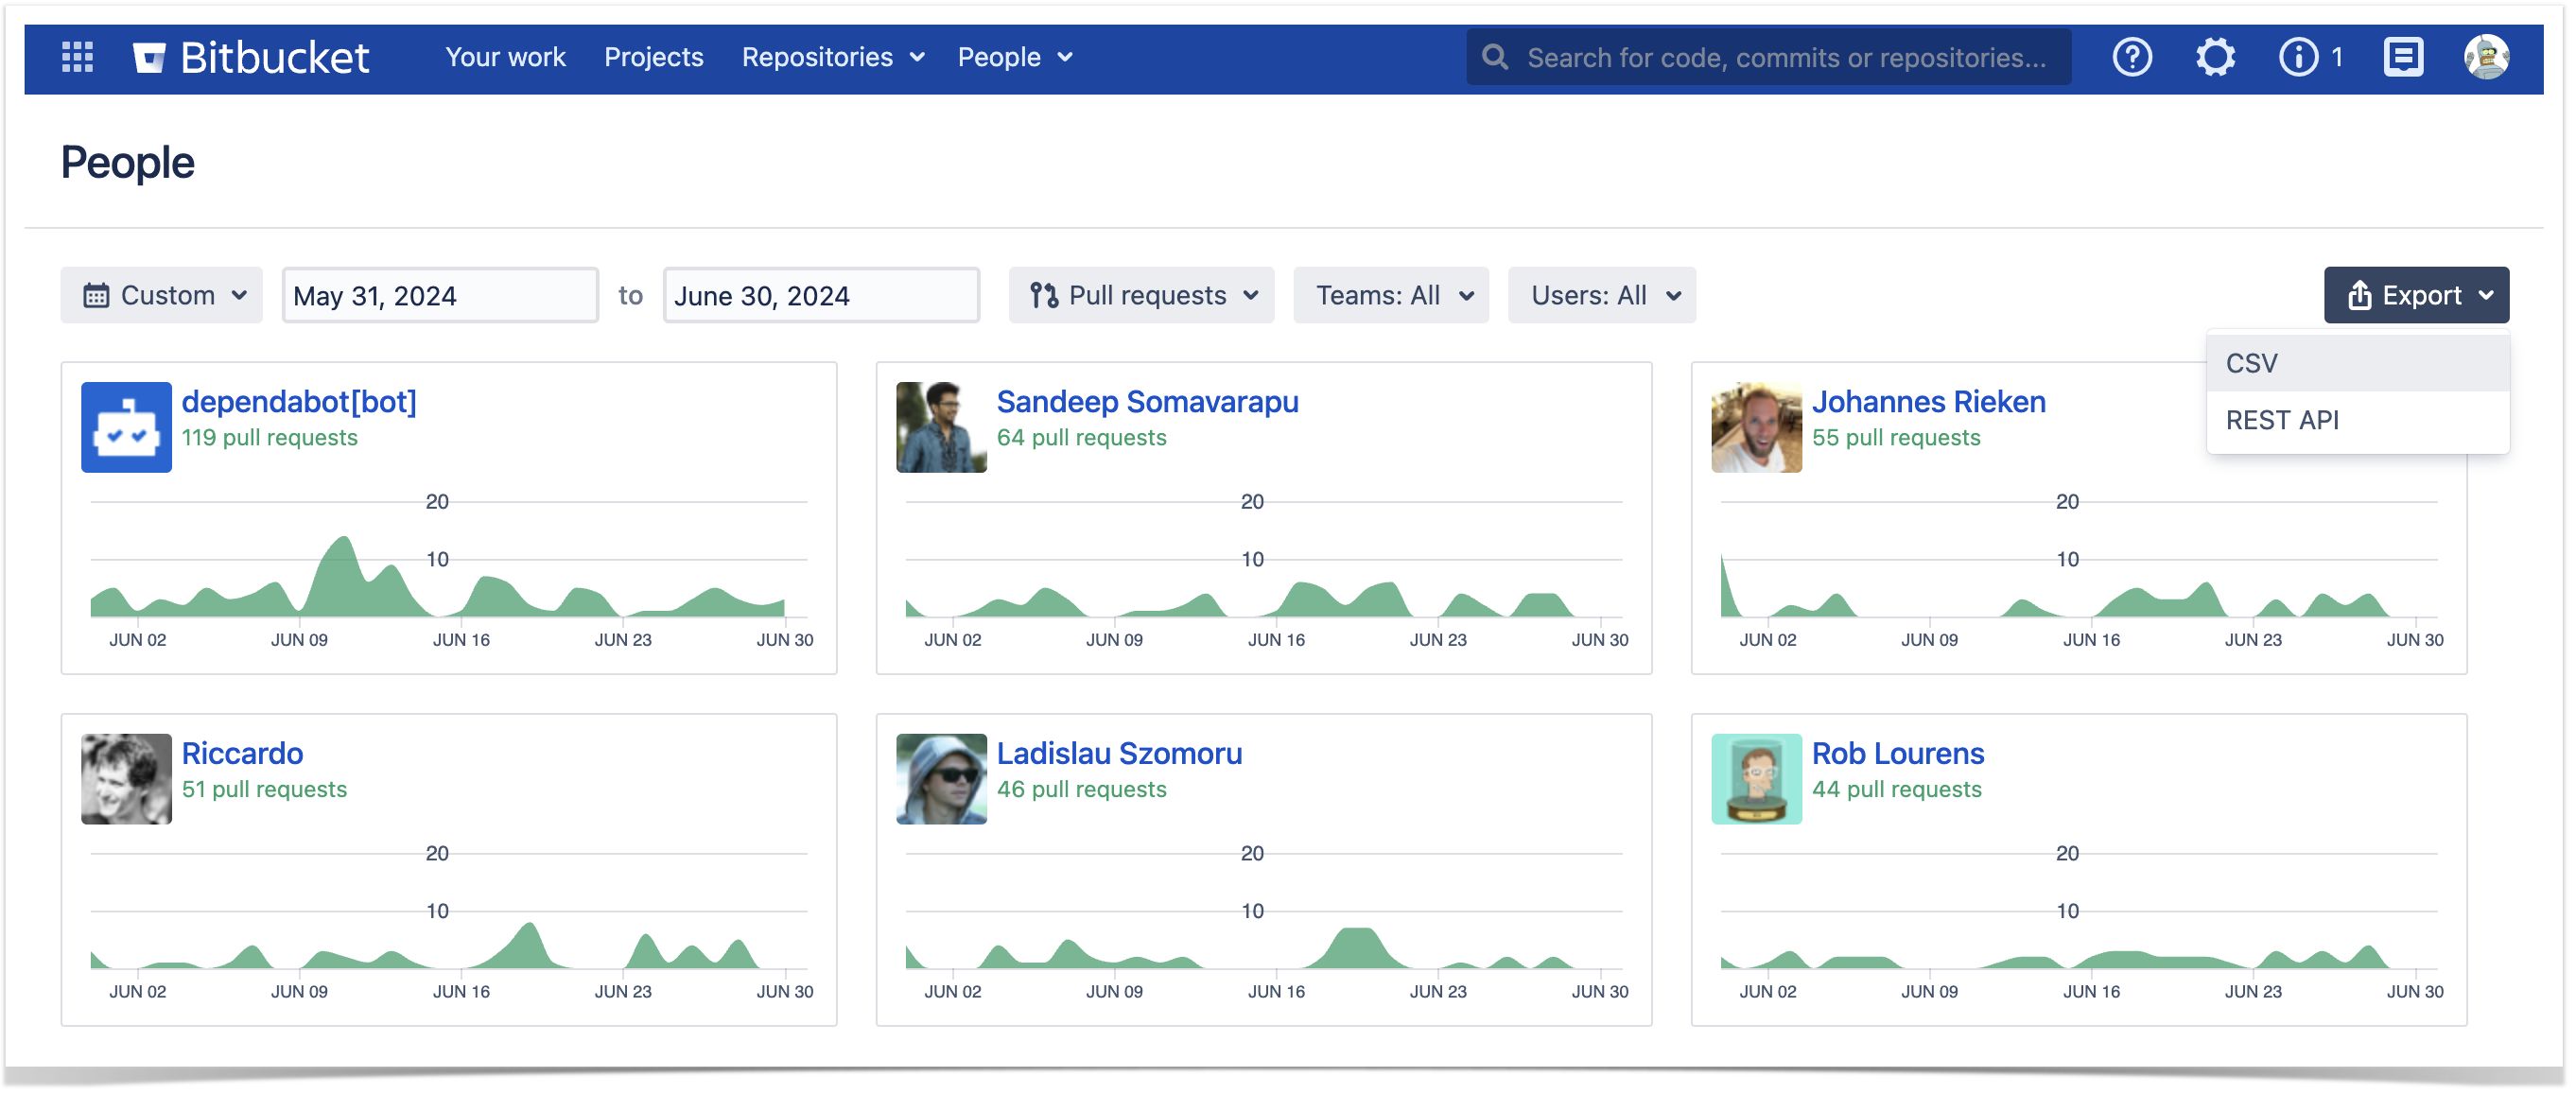
By default, you’ll see an overview of developers’ activity based on the number of commits. To check pull request contributions, select pull requests as the activity type in the configuration. It not only filters the data visible on the GUI but also determines what is exported, ensuring you receive a CSV file containing the needed data. To export pull requests, choose the Export menu at the top-right corner of the page and select CSV.
Get Time to Open, Pickup time, Review time, and Time to resolve via REST API
Another option to get Cycle Time metrics from Bitbucket is to use Awesome Graphs REST API. It allows exporting pull request statistics on user, repository, project, and global levels in JSON format as well as in a preformatted CSV file.
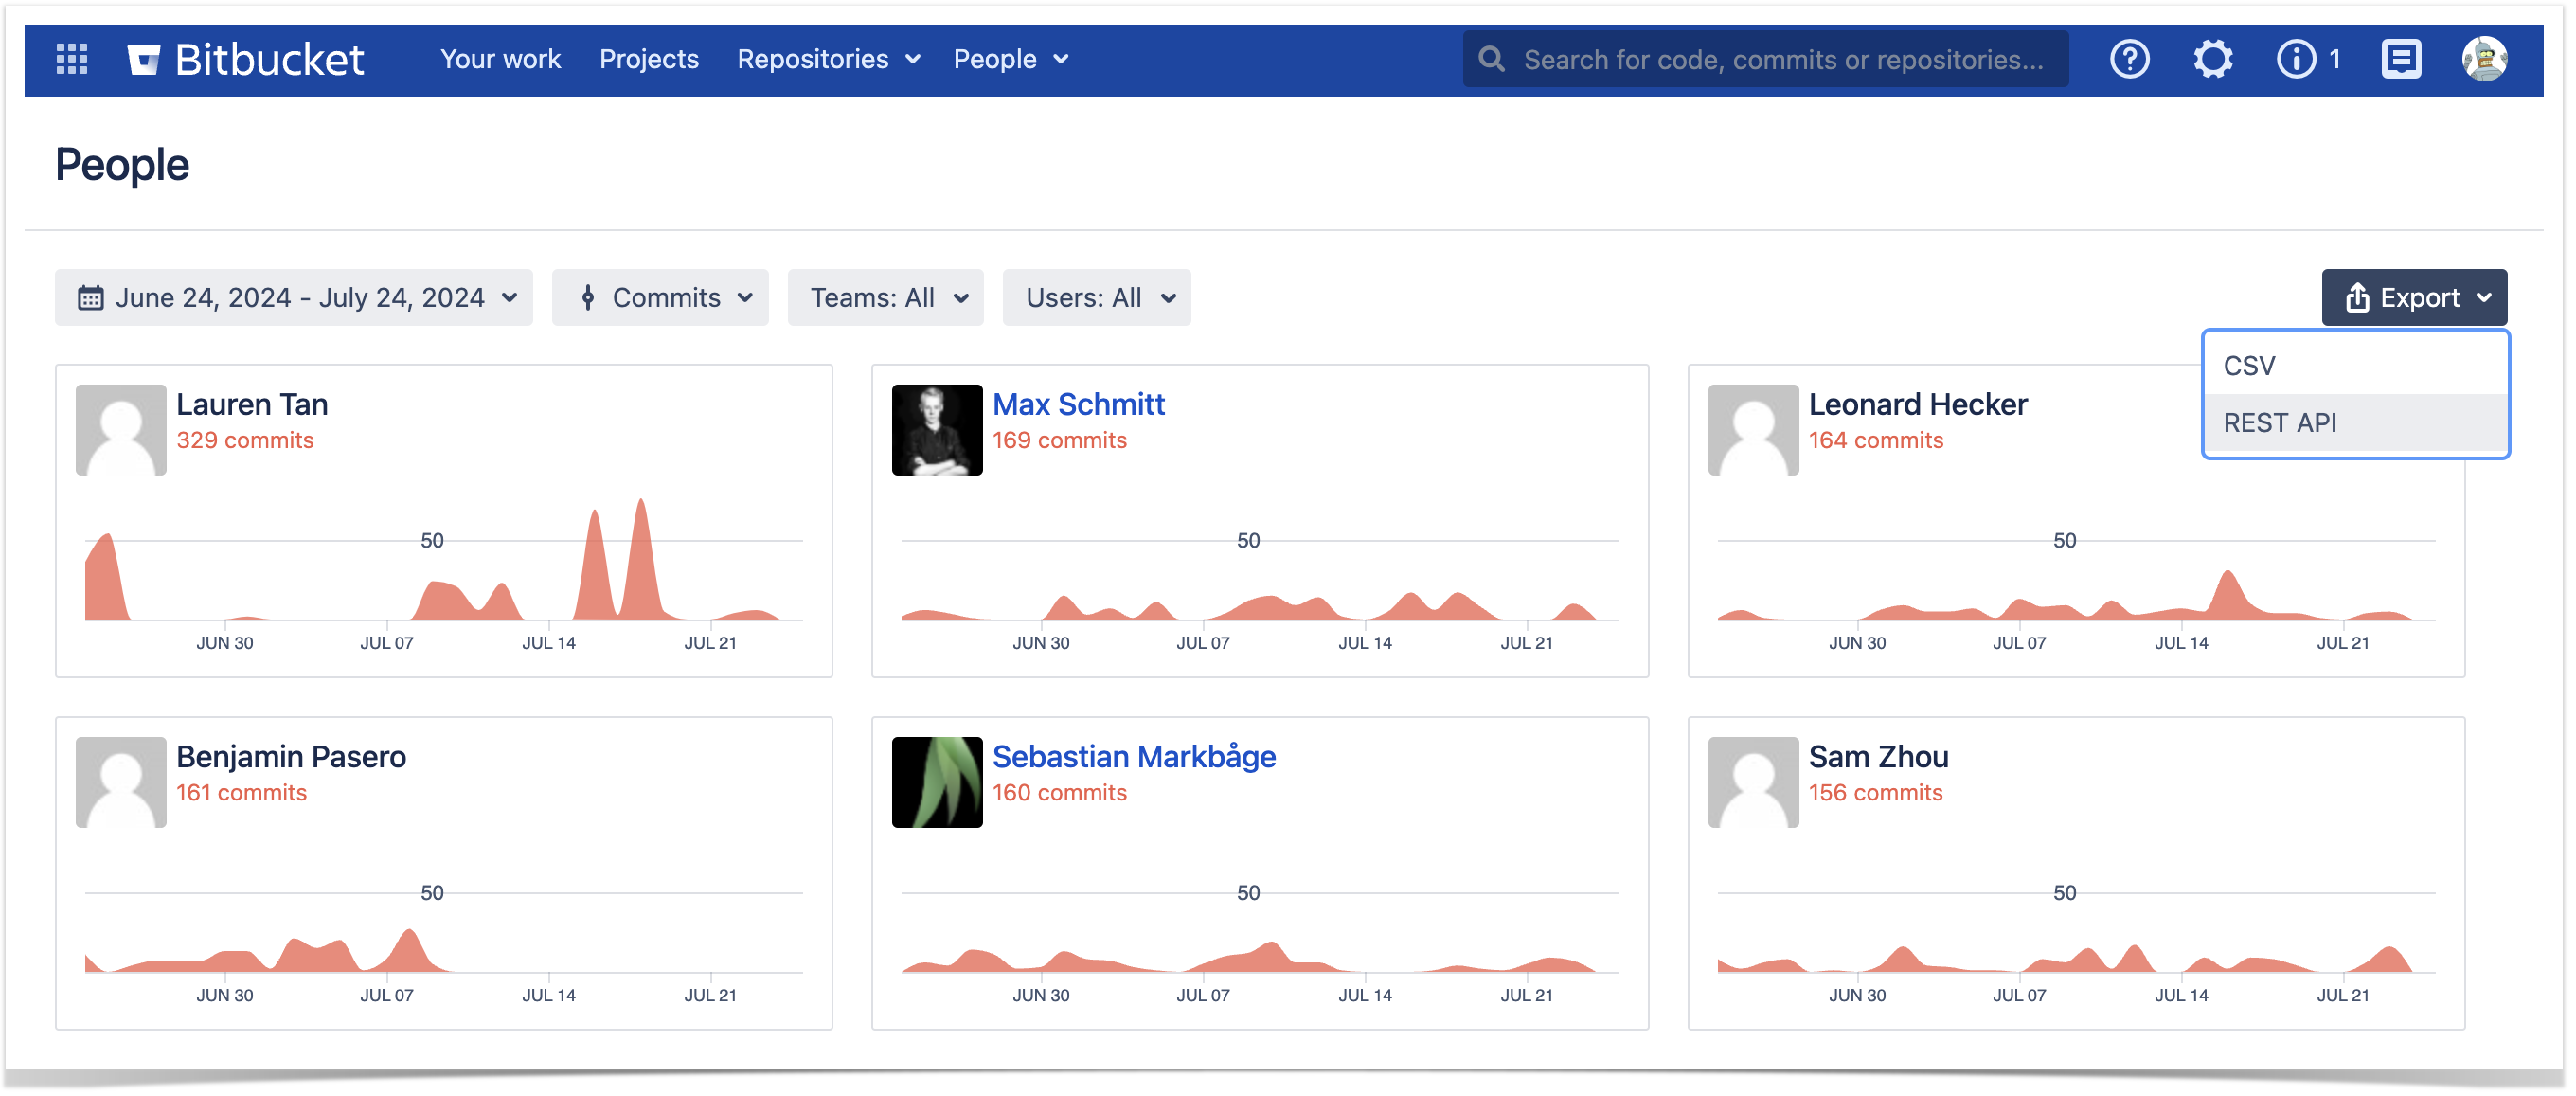
To find all available REST API resources, visit our documentation website or select REST API from the Export menu at the top-right corner of the People page in Bitbucket.
To retrieve Cycle time and its four phases in JSON format, simply add the withCycleTime=true parameter to any Get pull requests resources.
Here is an example of a curl request to export pull requests of a specific repository:
curl -X GET -u username:password "https://%bitbucket-host%/rest/awesome-graphs-api/latest/projects/{projectKey}/repos/{repositorySlug}/pull-requests?withCycleTime=true"
While exporting to a CSV file, you don’t need to add extra parameters to get pull requests Cycle time. An example of a curl request to retrieve data on a user level will be as follows:
curl -X GET -u username:password "https://%bitbucket-host%/rest/awesome-graphs-api/latest/users/{userSlug}/pull-requests/export/csv"
After running the request, the report you’ll get will look the same as the one we showed above, explaining how to export directly from Bitbucket UI. By default, it exports the data for the last 30 days. However, you can set a timeframe for exported data up to one year with sinceDate / untilDate parameters.
How to build a Cycle Time report
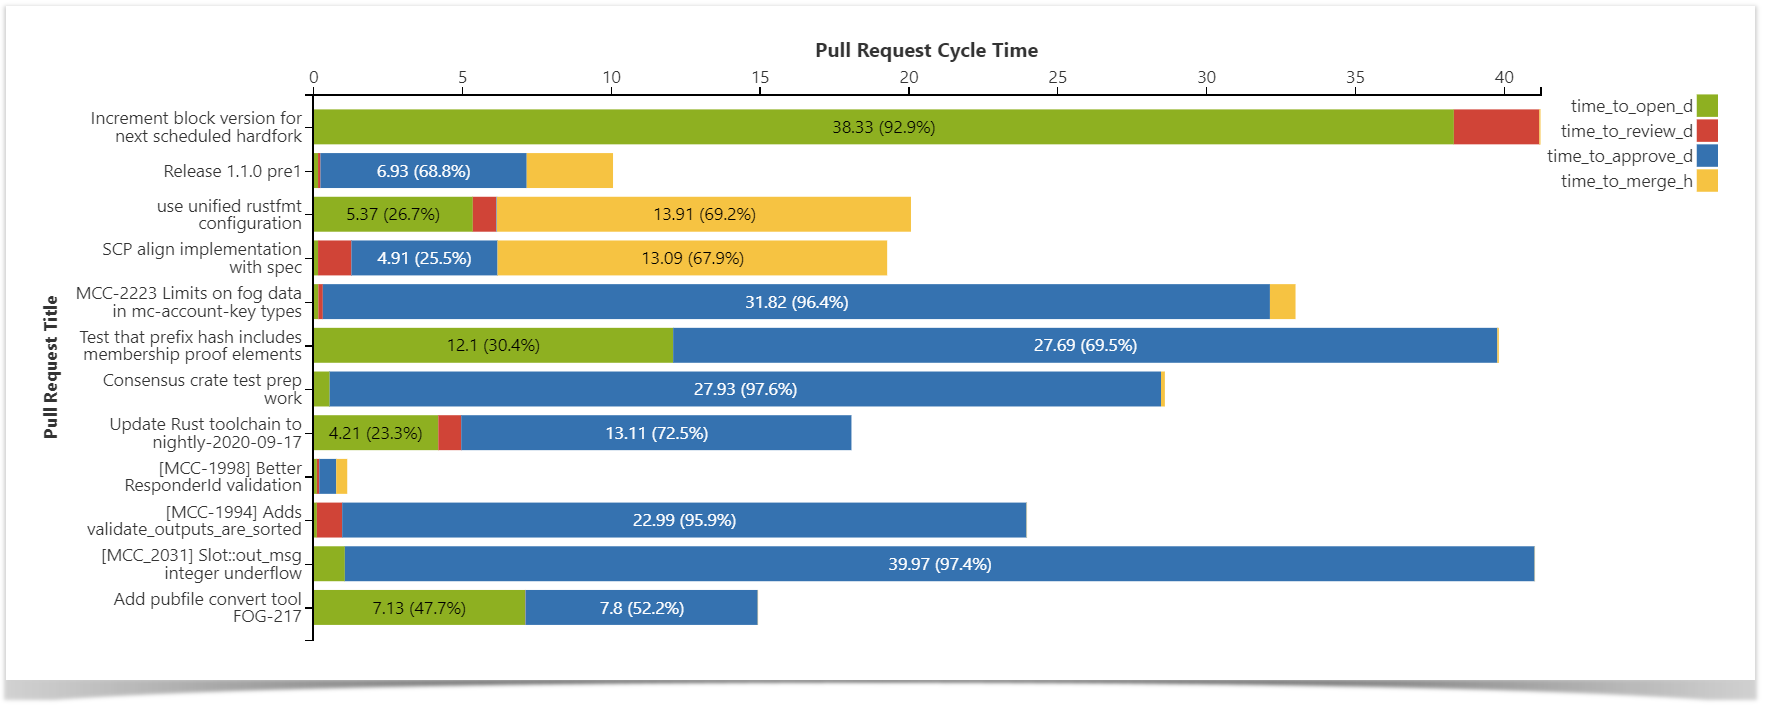
After you generated a CSV file, you can process it in analytics tools such as Tableau, PowerBI, Qlik, Looker, visualize this data on your Confluence pages with the Table Filter, Charts & Spreadsheets for Confluence app, or integrate it in any custom solution of your choice for further analysis.
An example of the data visualized with Table Filter, Charts & Spreadsheets for Confluence.
In this article, you will find more details on how to build a Cycle Time report in Confluence using the Table Filter, Charts & Spreadsheets for Confluence app.
By measuring Cycle Time, you can:
- See objectively whether the development process is getting faster or slower.
- Analyze the correlation of the specific metrics with the overall cycle time.
- Compare the results of the particular teams and users within the organization or across the industry.
With Awesome Graphs for Bitbucket, you can gain more visibility into the development process and facilitate project management. Using the app as a data provider tool will help build tailored reports and address your particular needs.
Feel free to contact us if you’d like to discover whether our app can address your specific needs.


