Table Filter and Charts with Page Properties Report

Atlassian Confluence is a powerful and feature-rich platform for content management. The system and its built-in macros provide a comfortable space for collaboration among different teams. And using third-party apps, you can up the productivity and use Confluence to its full potential.
We start a series of video tutorials that will help you master Confluence and incorporate it into your everyday work.
Our first tutorial shows you the way to generate reports on specific page properties in Confluence. It also teaches you to filter, aggregate, and transform the data after creating the Page Properties report.
Confluence Page Properties and Page Properties Report macros
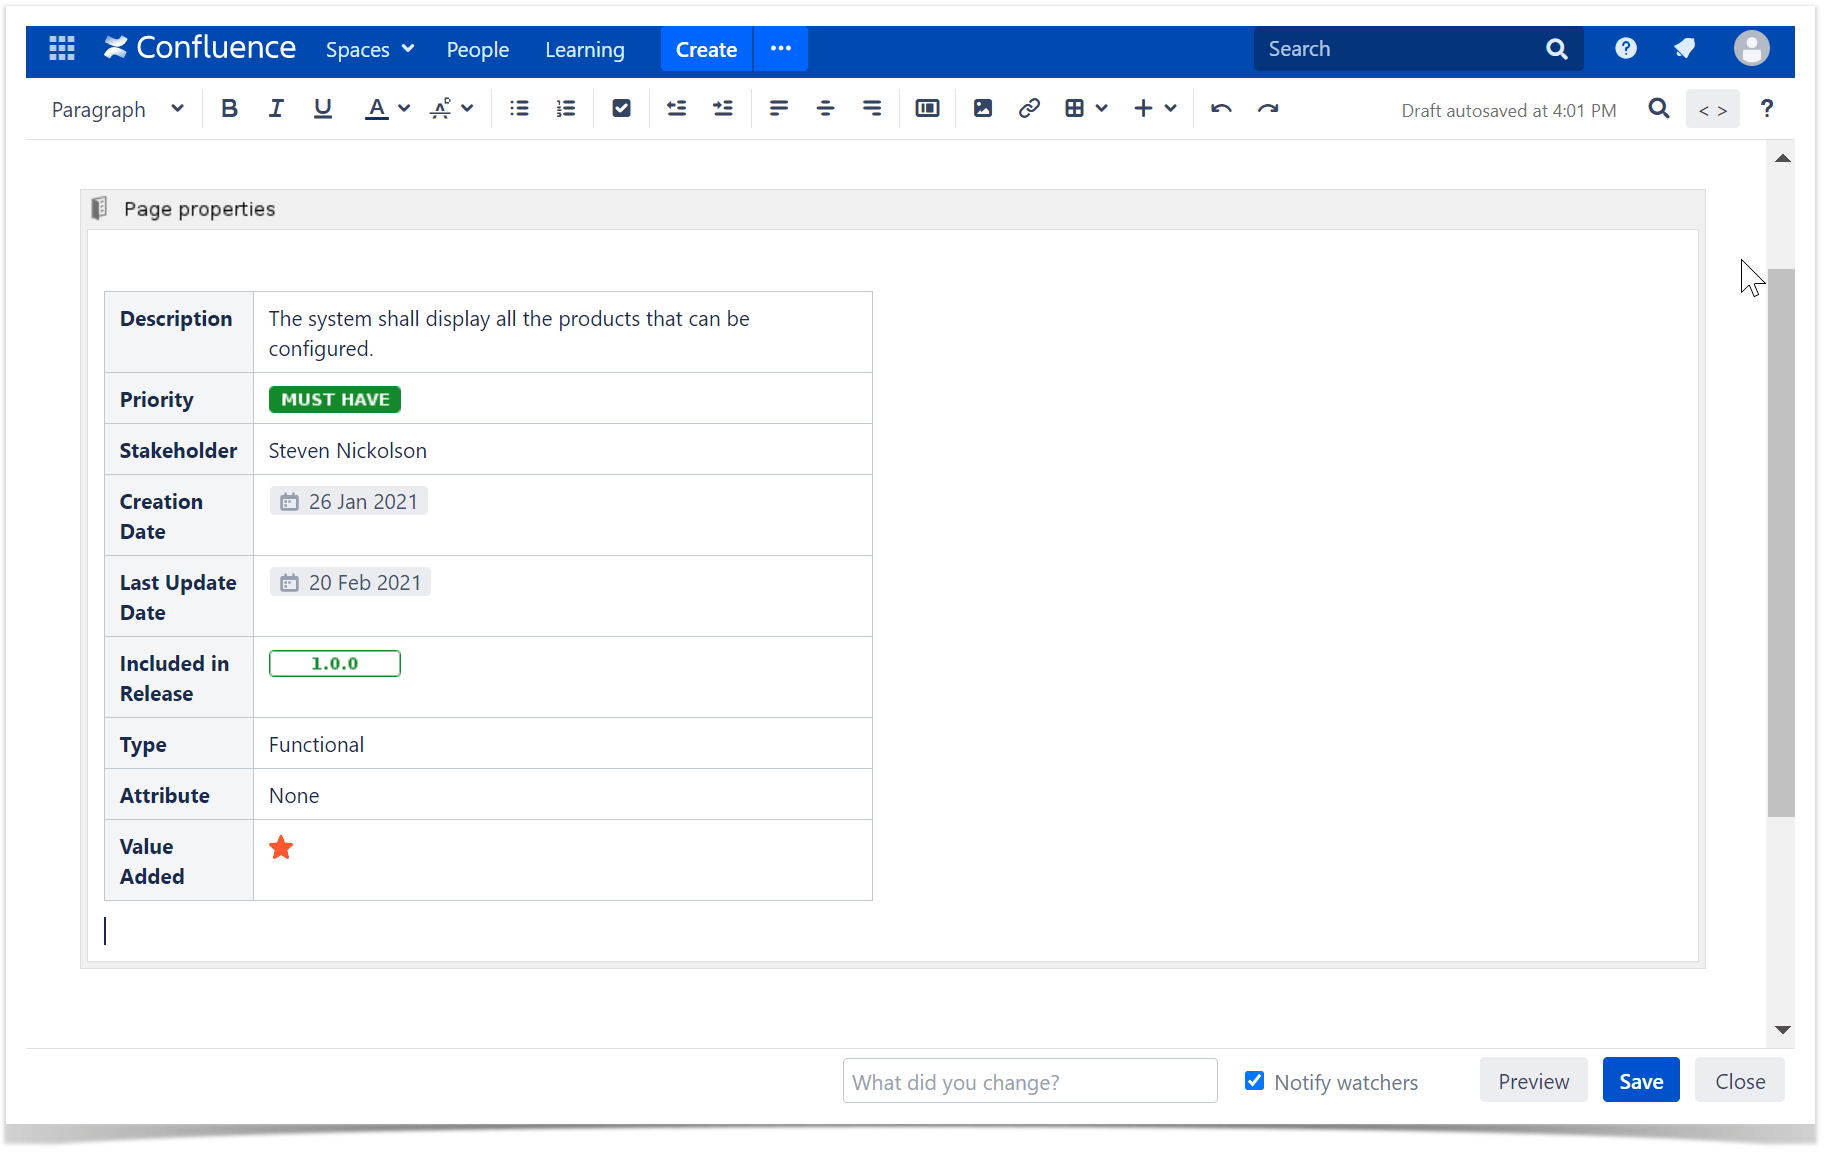
On any Confluence page, you can insert the Page Properties macro that allows you to define one or multiple properties to the page. These properties are placed within the specifically formatted table. The Page Properties Report macro further pulls these properties (the so-called metadata) from pages having specific labels and generates a table listing these properties.
This may be convenient when you deal with the pages storing similar content. With this macro, you can keep some information that can be further used for filtration or visualization.
The easiest way to use the Confluence Page Properties macro on your page is to create a blueprint and place the table with metadata and text hints there. This way, whenever a user creates a new page with a template, you will have the same data. That will keep consistency for all the pages based on the same blueprint.
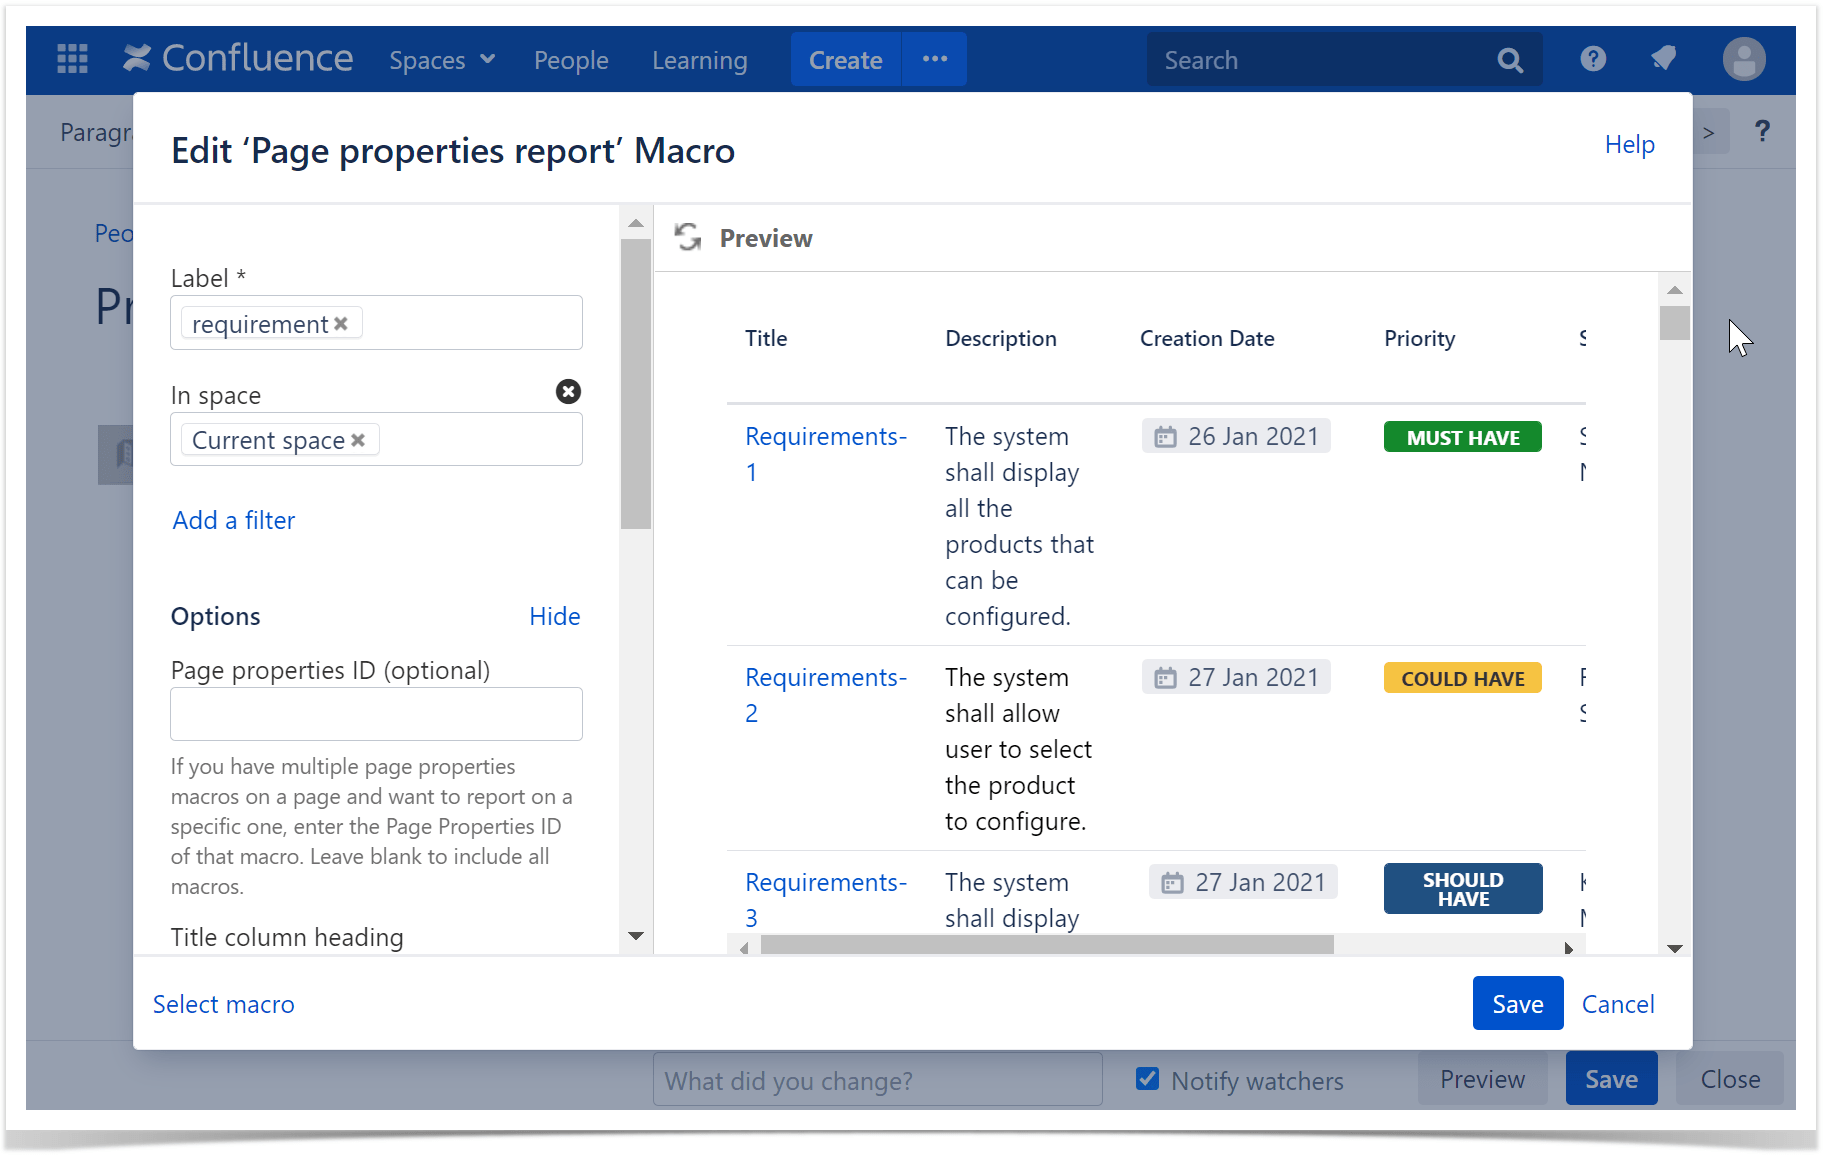
To generate a content report, you need to create a page with the Page Properties Report macro. After that, select one or multiple page labels against which the list of pages will be generated.
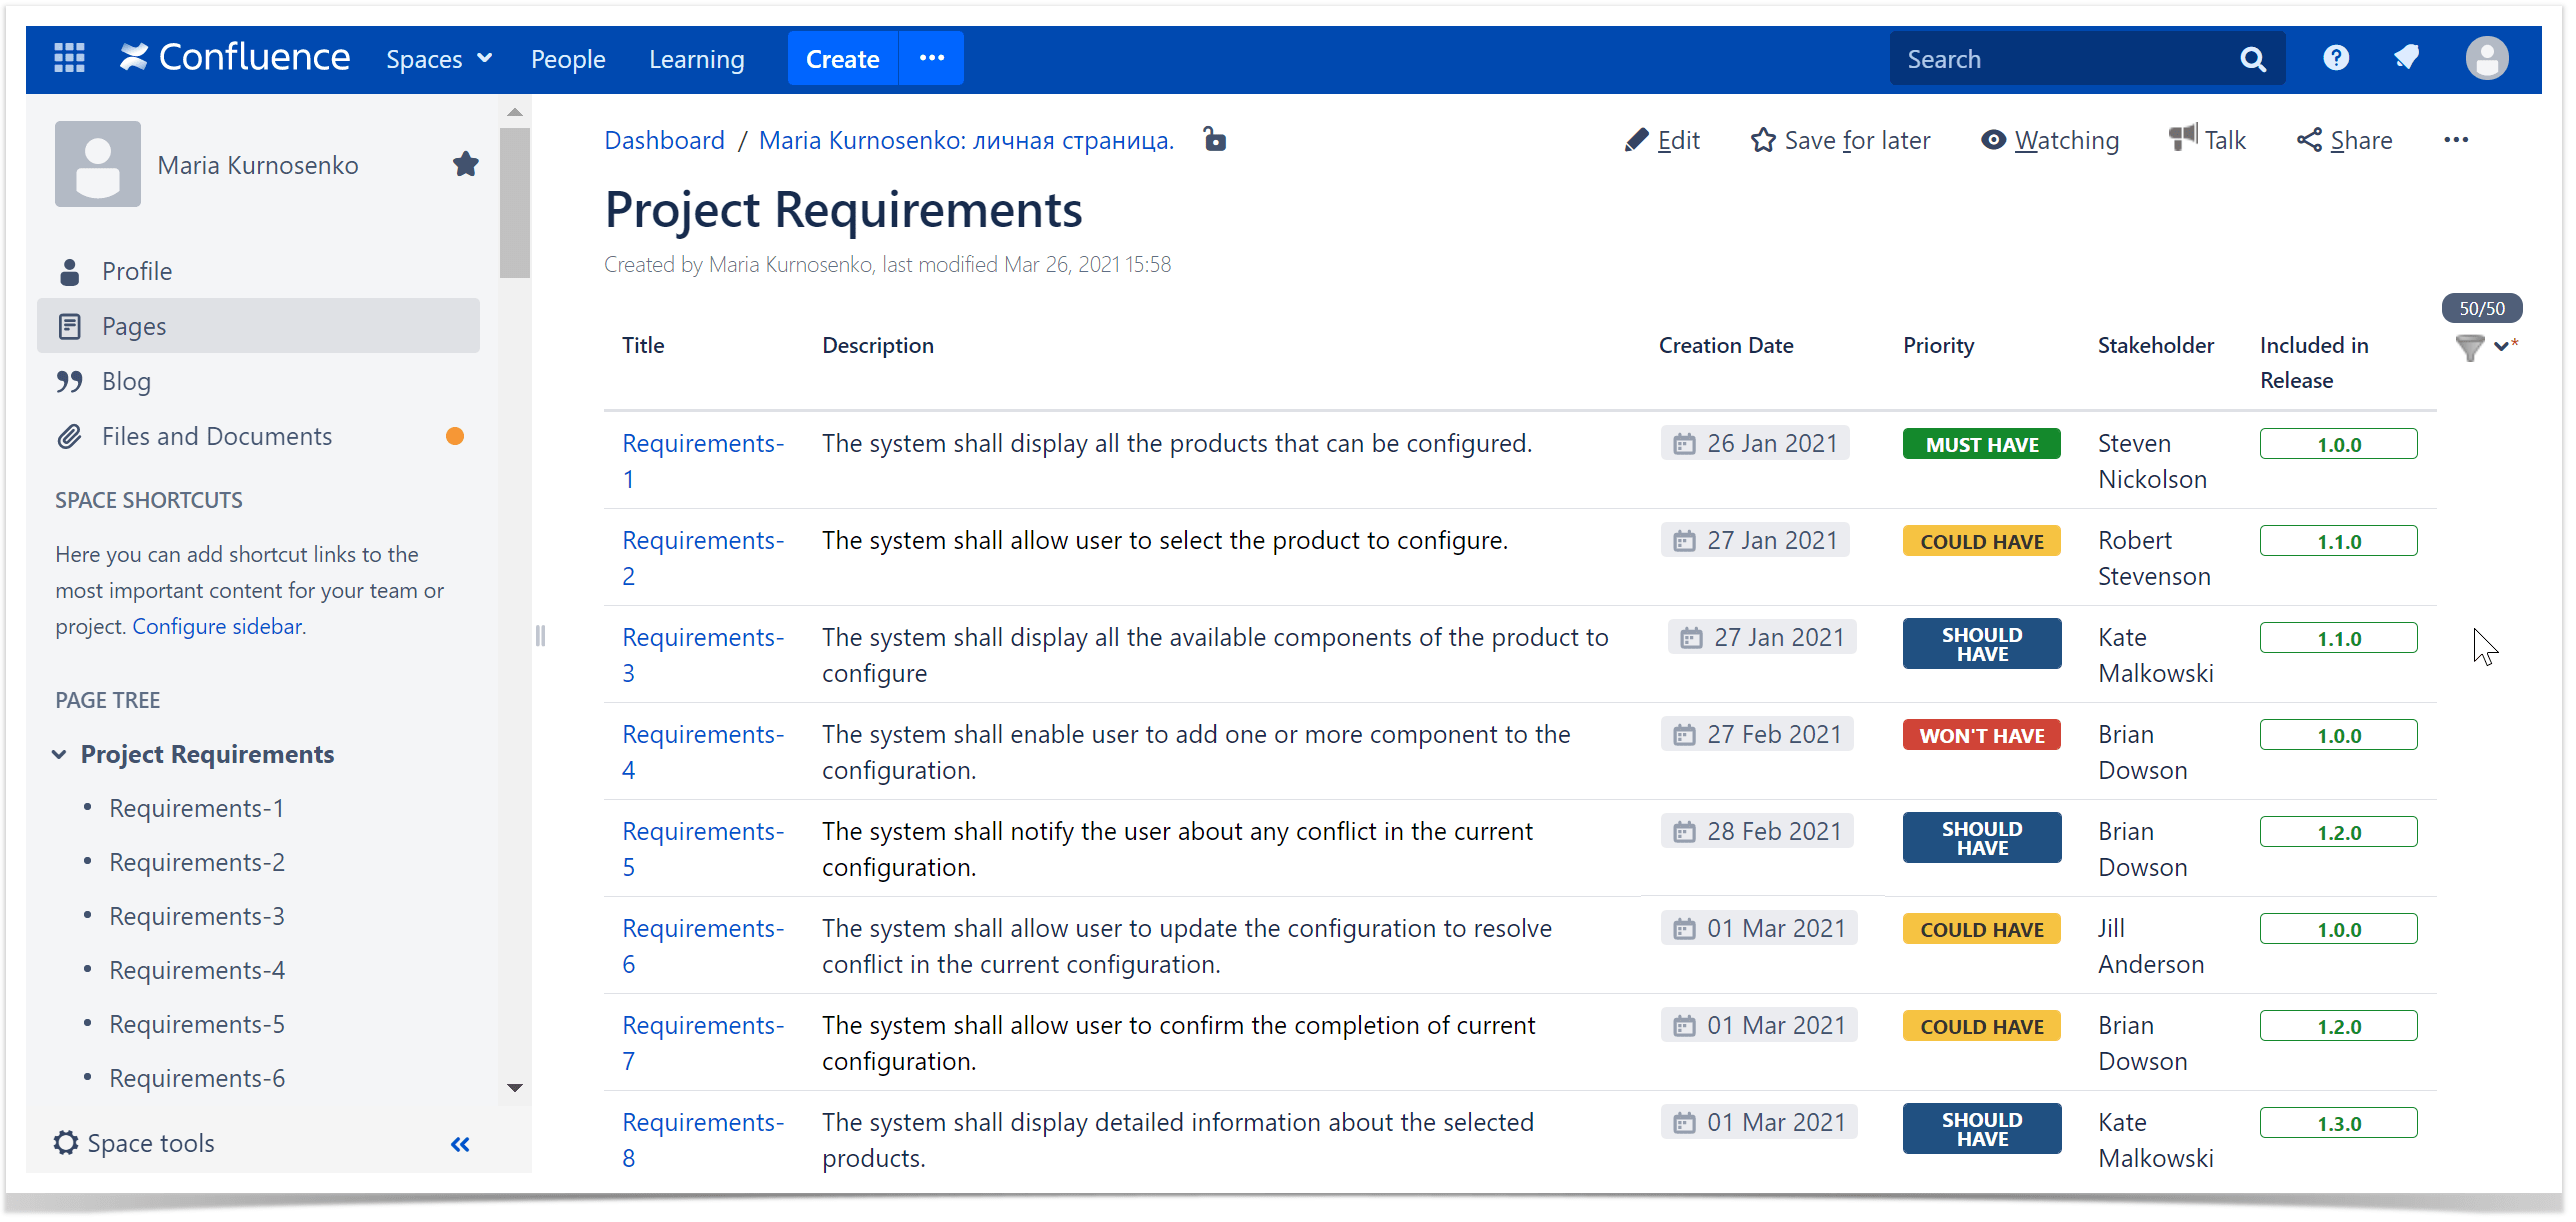
Once you save the page, the macro generates the list of pages with metadata.
Pro tip:
Learn more about using Spreadsheets in Confluence
Table Filter and Charts for Confluence with Page Properties Report
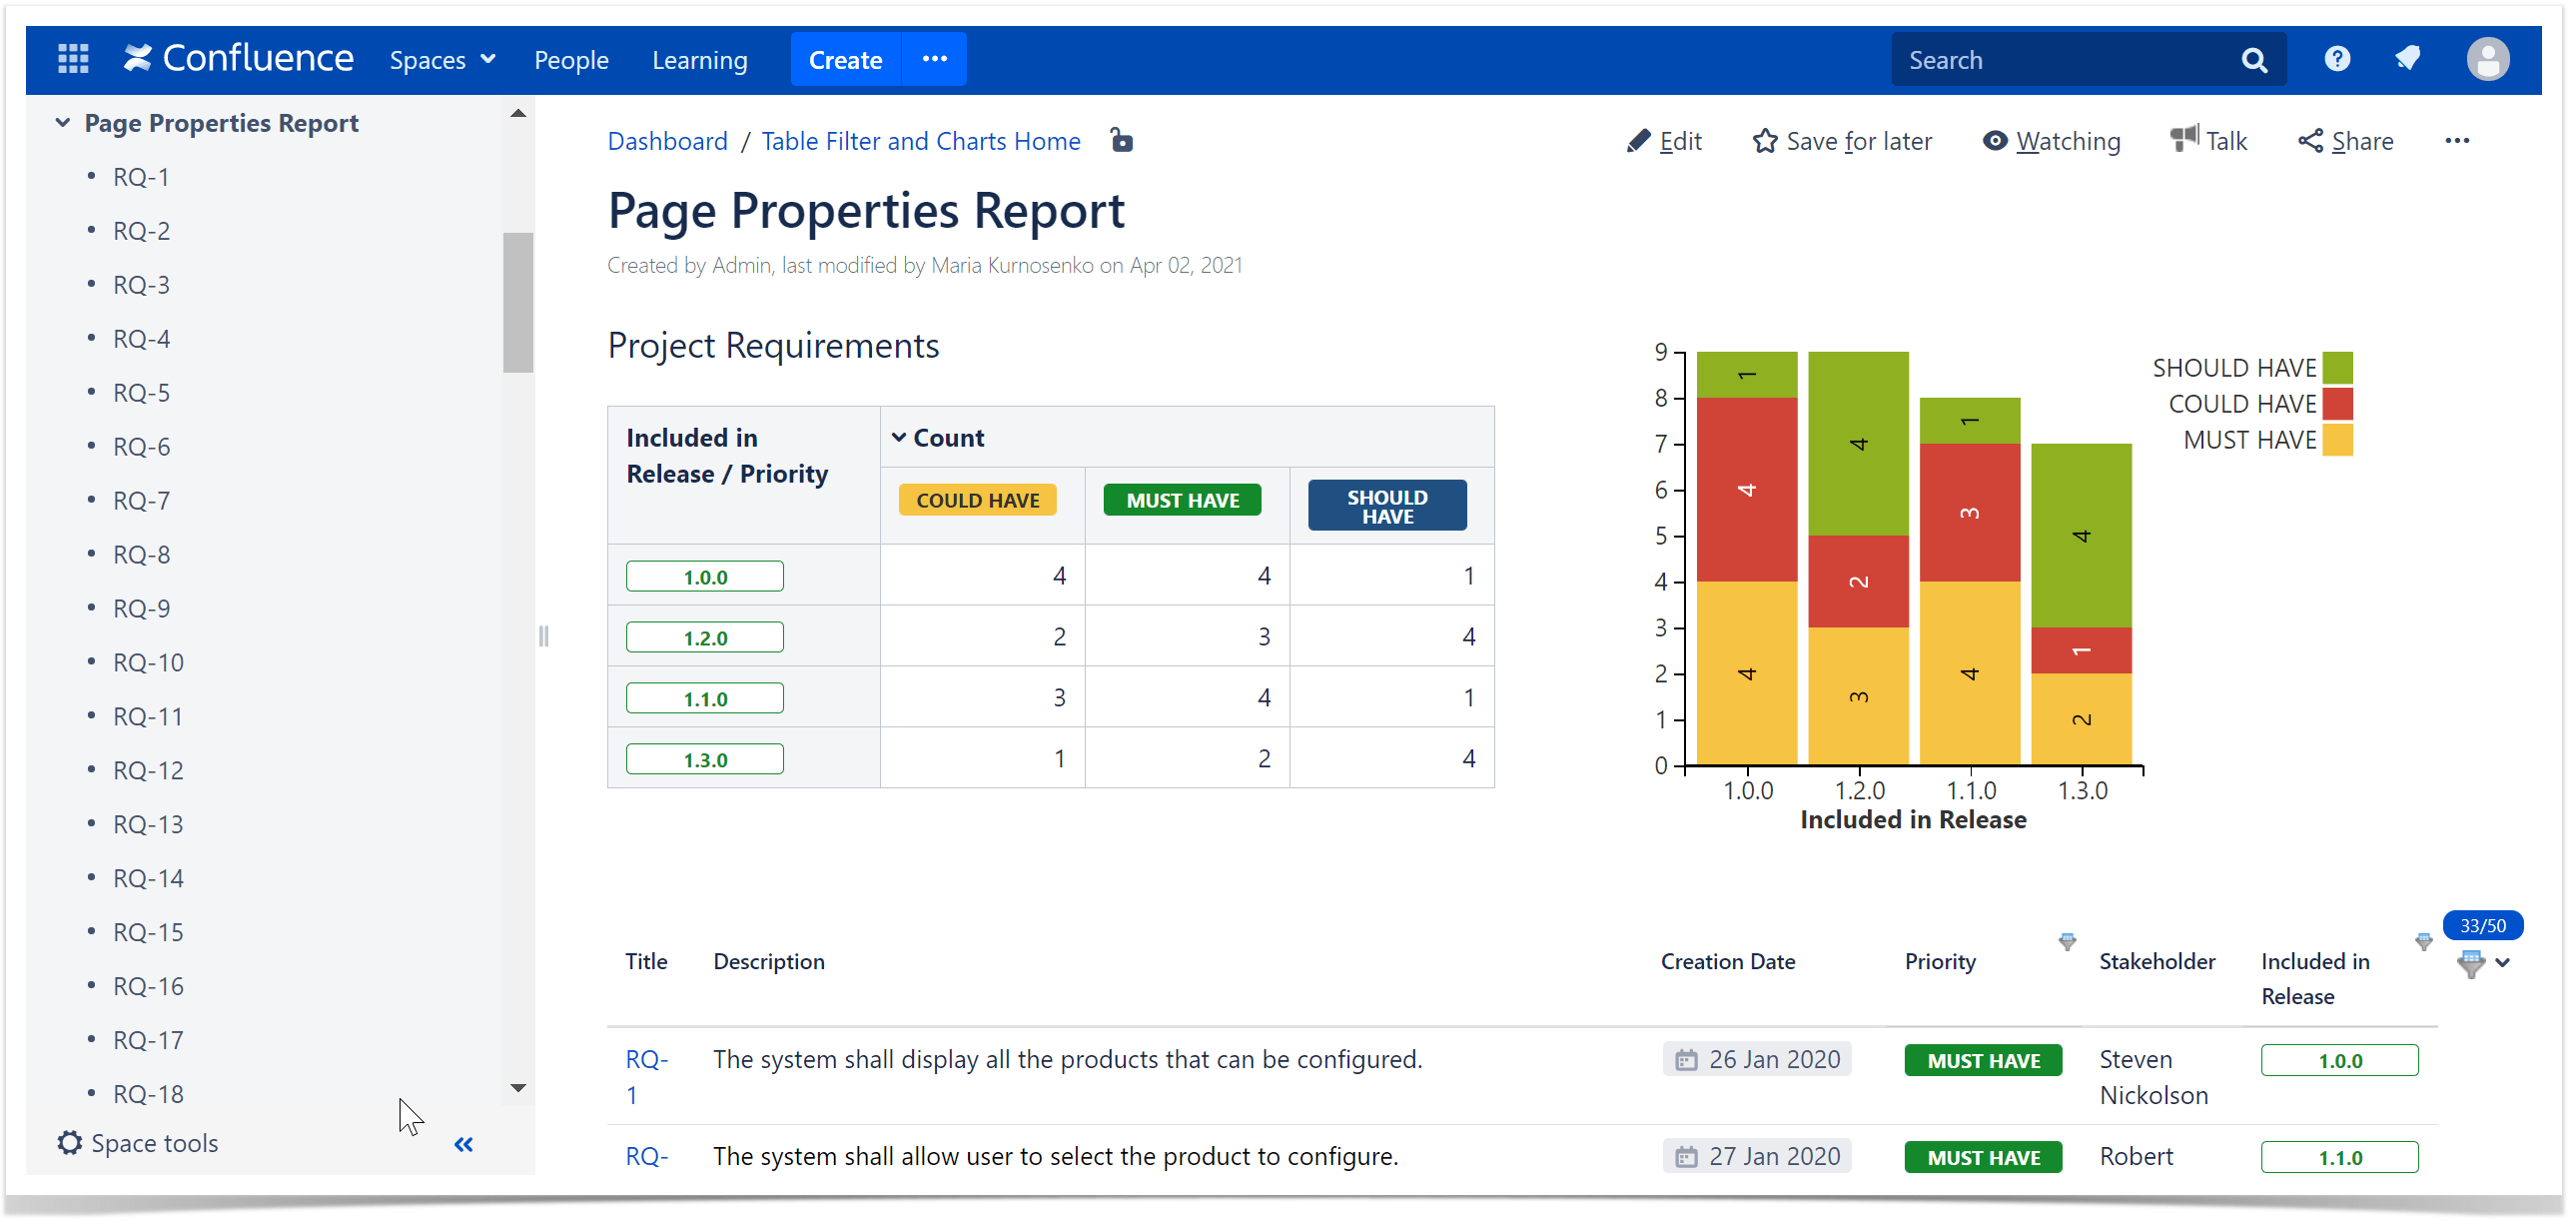
When you get a long list of data, you may find it useful to filter the content. The Table Filter and Charts for Confluence app will be a good tool to apply to Page Properties Report in this case.
This app allows you to:
- filter table data in many ways, choosing the most suitable filters
- generate pivot tables aggregating data against the specific parameters
- output charts and graphs visualizing your data series
Want to know how it works? Check out the video for key details.


