Introducing New Feature: Graphs for Teams in Awesome Graphs

December 3, 2019
#Bitbucket#Reporting#Analytics#News
7 min

There is no doubt that effective working and communication processes in a team greatly influence the overall success of a product or company. Atlassian products like Bitbucket, Jira, and Confluence aim to improve collaboration and bring distributed colleagues together.

Awesome Graphs for Bitbucket app is our contribution to the teamwork of more than 2,000 companies, as its primary goal is to help identify the bottlenecks in the development workflow and increase the speed. We are eager to make the processes transparent for both developers and managers and, thereby, improve the communication and narrow the gap between them.

We’ve discovered that lots of our clients use similar workflows: they have multiple teams working on the same project or repository. Therefore, tracking the productivity of a particular group that a project or delivery manager, or team lead manages can be tricky as the app showed graphs for all the activity across a project or repository that included the statistics about all the teams together. That’s why we decided to implement a feature that can make their lives easier: graphs for teams.

View the statistics for your team

Teams feature is designed to visualize the statistics about your team performance if there’s a lot of people working on a project or repository. It excludes the contributions of the members of other teams and helps get rid of noisy data.

Configure your teams in the settings and choose it in the All contributors drop-down menu on the Graphs page and analyze how much commits, pull requests, and lines of code a team produces apart from others.

Compare the activity of different teams

If you manage multiple teams working on the same project or repository, you may find it useful to separate their statistics from each other.  For example, compare their impact in a codebase of your repository using the Code Frequency graph. That’s what you can easily do with our new feature!

Let’s say you manage two teams: back-end and front-end developers. Open a graph for each team in different tabs and compare their performance.

From the screenshot below, you may identify that your back-end team is continuously deleting the lines of code. They are probably involved in some bug fixing or refactoring activities or implement changes in the API.

Meanwhile, the front-end team has to rewrite some pieces of code to adjust the changes in the backend.

Exclude automated users from the statistics

If you use automation in your repositories, the graphs may show the information that is not related to the activity of your team. Lots of commits and lines of code added by CI/CD users and automated scripts may complicate the performance analysis since it’s not obvious which contributions are made by real people and which of them are not.

Use teams feature to solve this problem by creating a team with all the people you need except for the automated users.

Teams management

A team can be made on the global, project, and repository level by the user with administrative permissions on this level. A team can include whole Bitbucket groups or individual users.

It’s possible to create a global team in the Teams tab in the Administration page and view graphs for it in all projects and repositories.

There’s no need to disturb your Sys Admins from their work to create a team. If you’re a project or repository admin, you may do it in the Teams tab in the settings. In this case, your teams’ graphs will be available only in your repository or project and higher.

Improve your teams’ activity tracking

At the moment, graphs for teams are available only for the Graphs page, but we’ll add this feature to the People page and Reports soon in the next releases.

Try a new version of Awesome Graphs for Bitbucket to get even more useful insights on your team productivity and compare the activities of different teams!

We are delighted to implement the team feature that our customers were asking for, and we hope to make their working process a bit easier and better! So, we appreciate any feedback on the app and suggestions that could help you get the most benefit from Awesome Graphs. If you have any, please, feel free to write to us here as we’re looking forward to learning about your needs!

Related posts

    New App Release: Submodule Changes for Bitbucket

    September 17, 2019
    #News#Bitbucket
    4 min

    We have recently released a new app – Submodule Changes for Bitbucket. This free app is created to improve the experience with the Git submodule workflow. No more unreadable pull requests with changes to submodules and skipping the code review process!

    Dealing with submodules can be annoying

    Our company develops Awesome Graphs for Bitbucket – the app that provides the statistics for projects and repositories and helps to analyze and evaluate development team performance, code review practices and personal activity of each team member. Awesome Graphs for Bitbucket is very popular and has more than 2600 installs on the Marketplace at the moment. It’s available for Bitbucket Server, Data Center and Cloud. We use Git submodules that contain features which are similar for all the versions in order to achieve the fastest delivery.

    If you use it in your projects too, you may face the situations when the commits made to a submodule are shown as two hashes in the Diff tab instead of displaying the lines of code, folders, and files that have actually been modified.

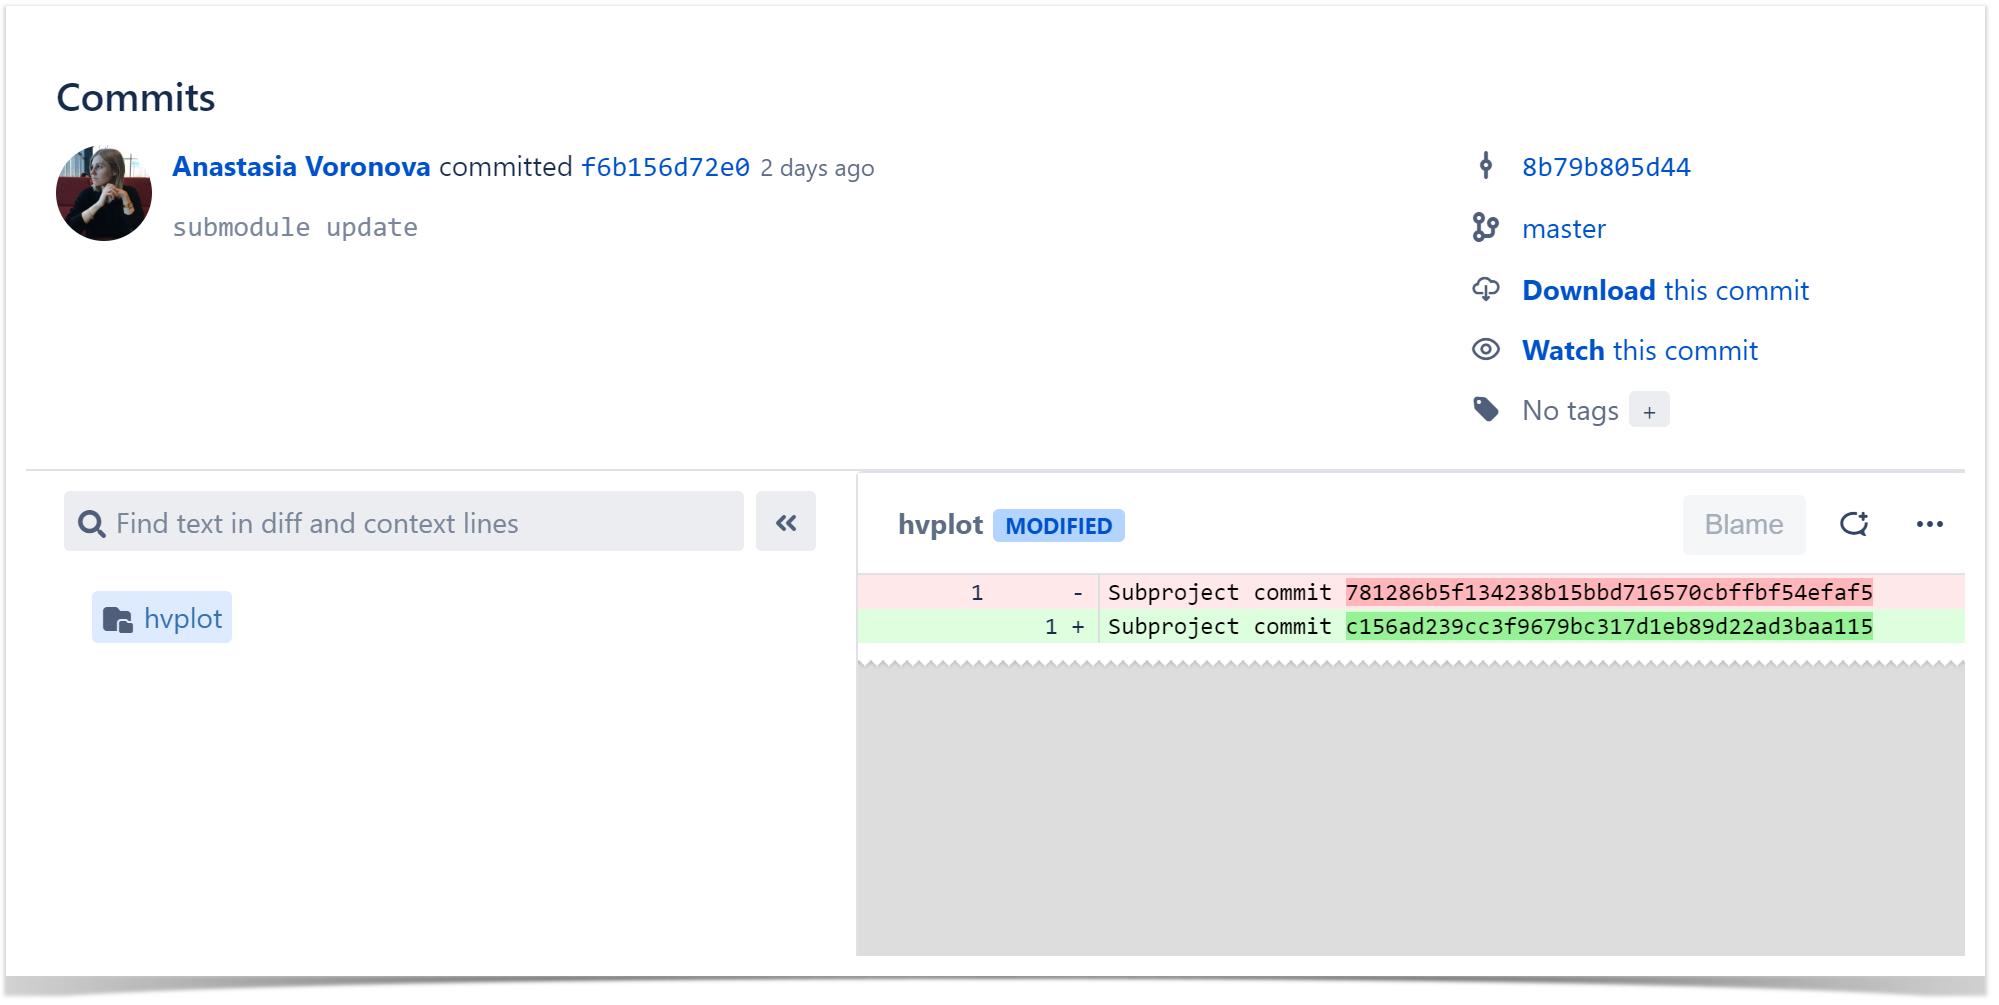
    It creates the greatest difficulty to the reviewers of pull requests since there’s no chance to review changes and leave comments on the commits of the submodule repository.

    Review Pull Requests Easily

    If you don’t want to skip such an important part of the development process as the code review, you can try the solution we created: Submodule Changes for Bitbucket. At first, this app came as software that we were using internally, but then we discovered that lots of other developers face similar issues.

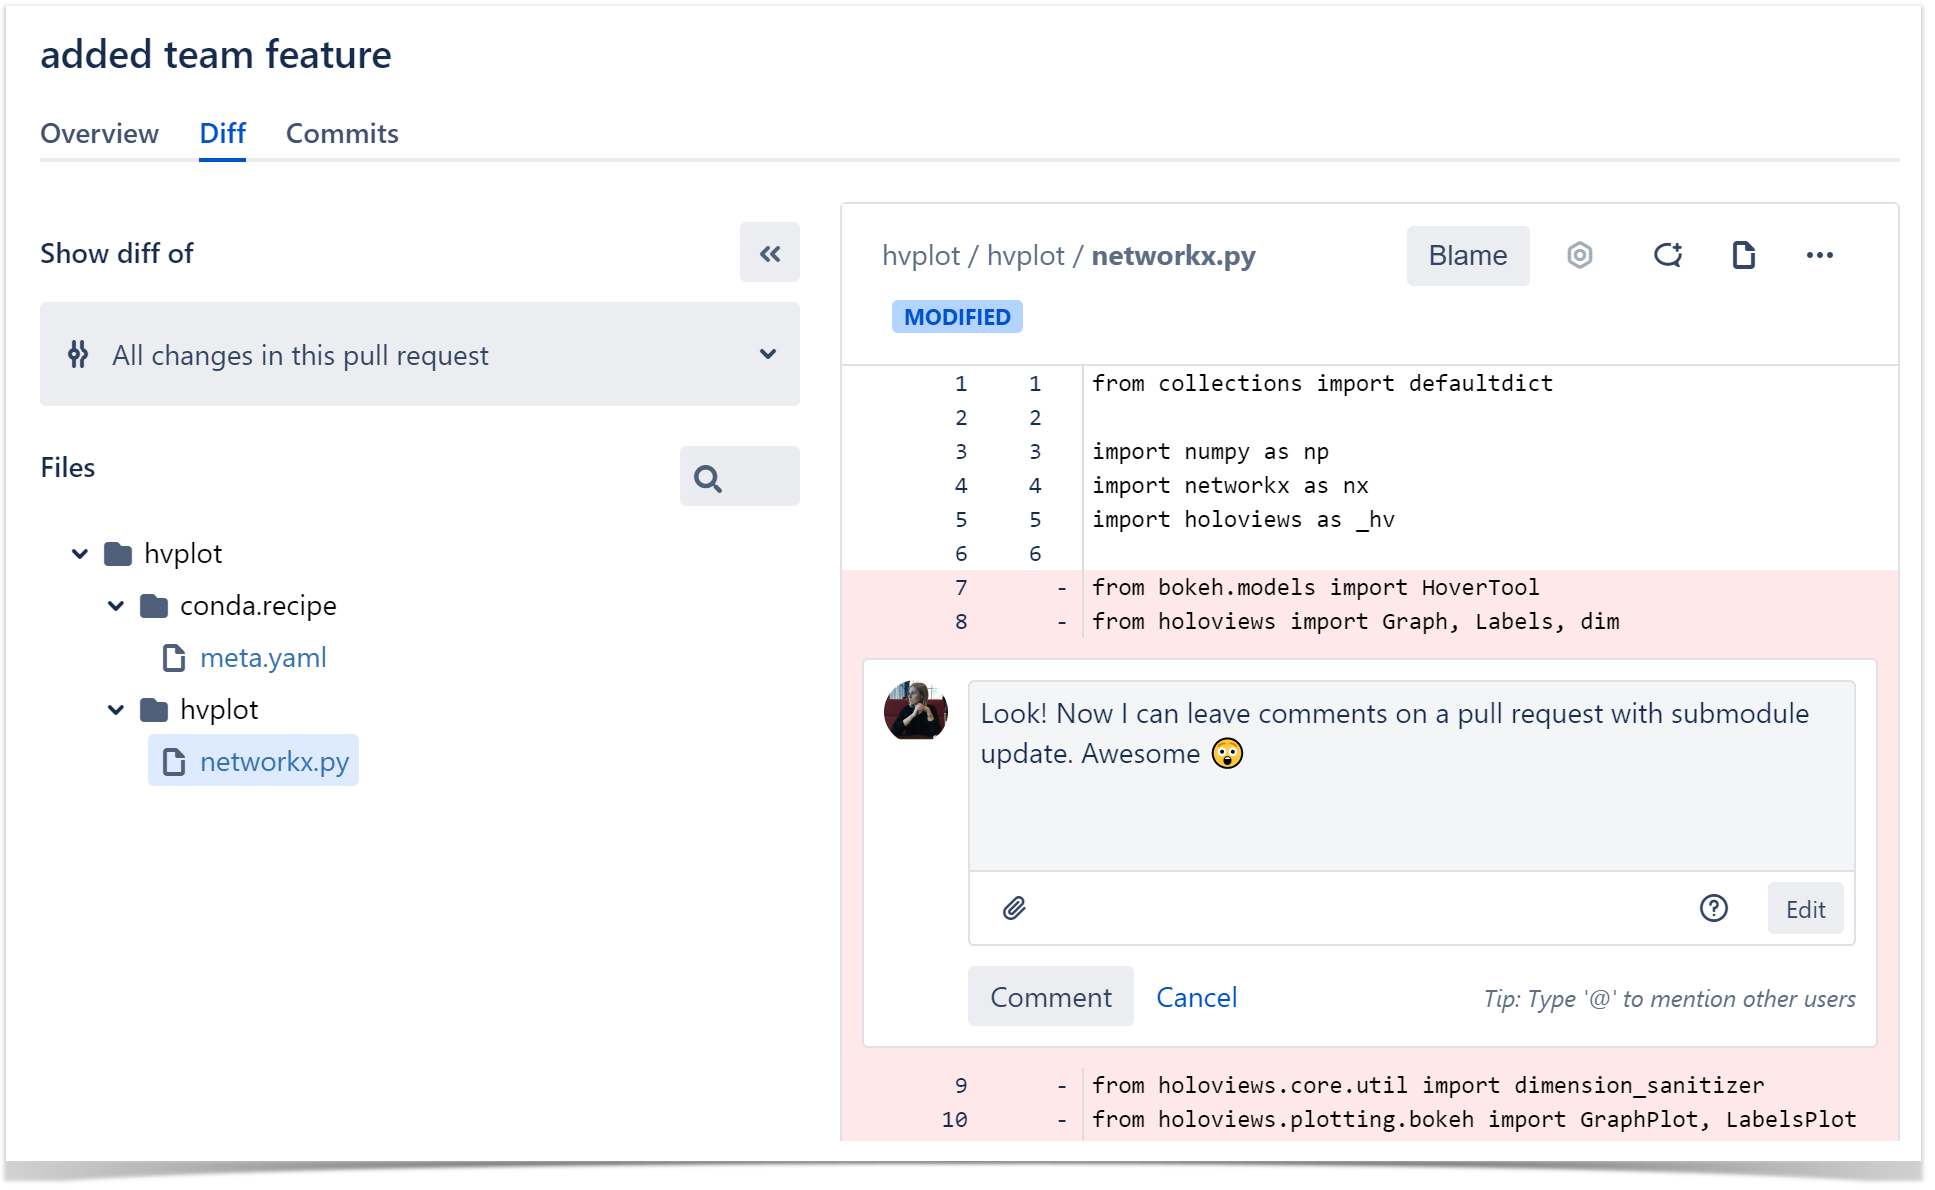
    Submodule Changes for Bitbucket replaces two commit hashes with the files modified in a commit or pull request. It highlights the changes with a submodule update in the Diff tab as if all of them were made to a parental repository.

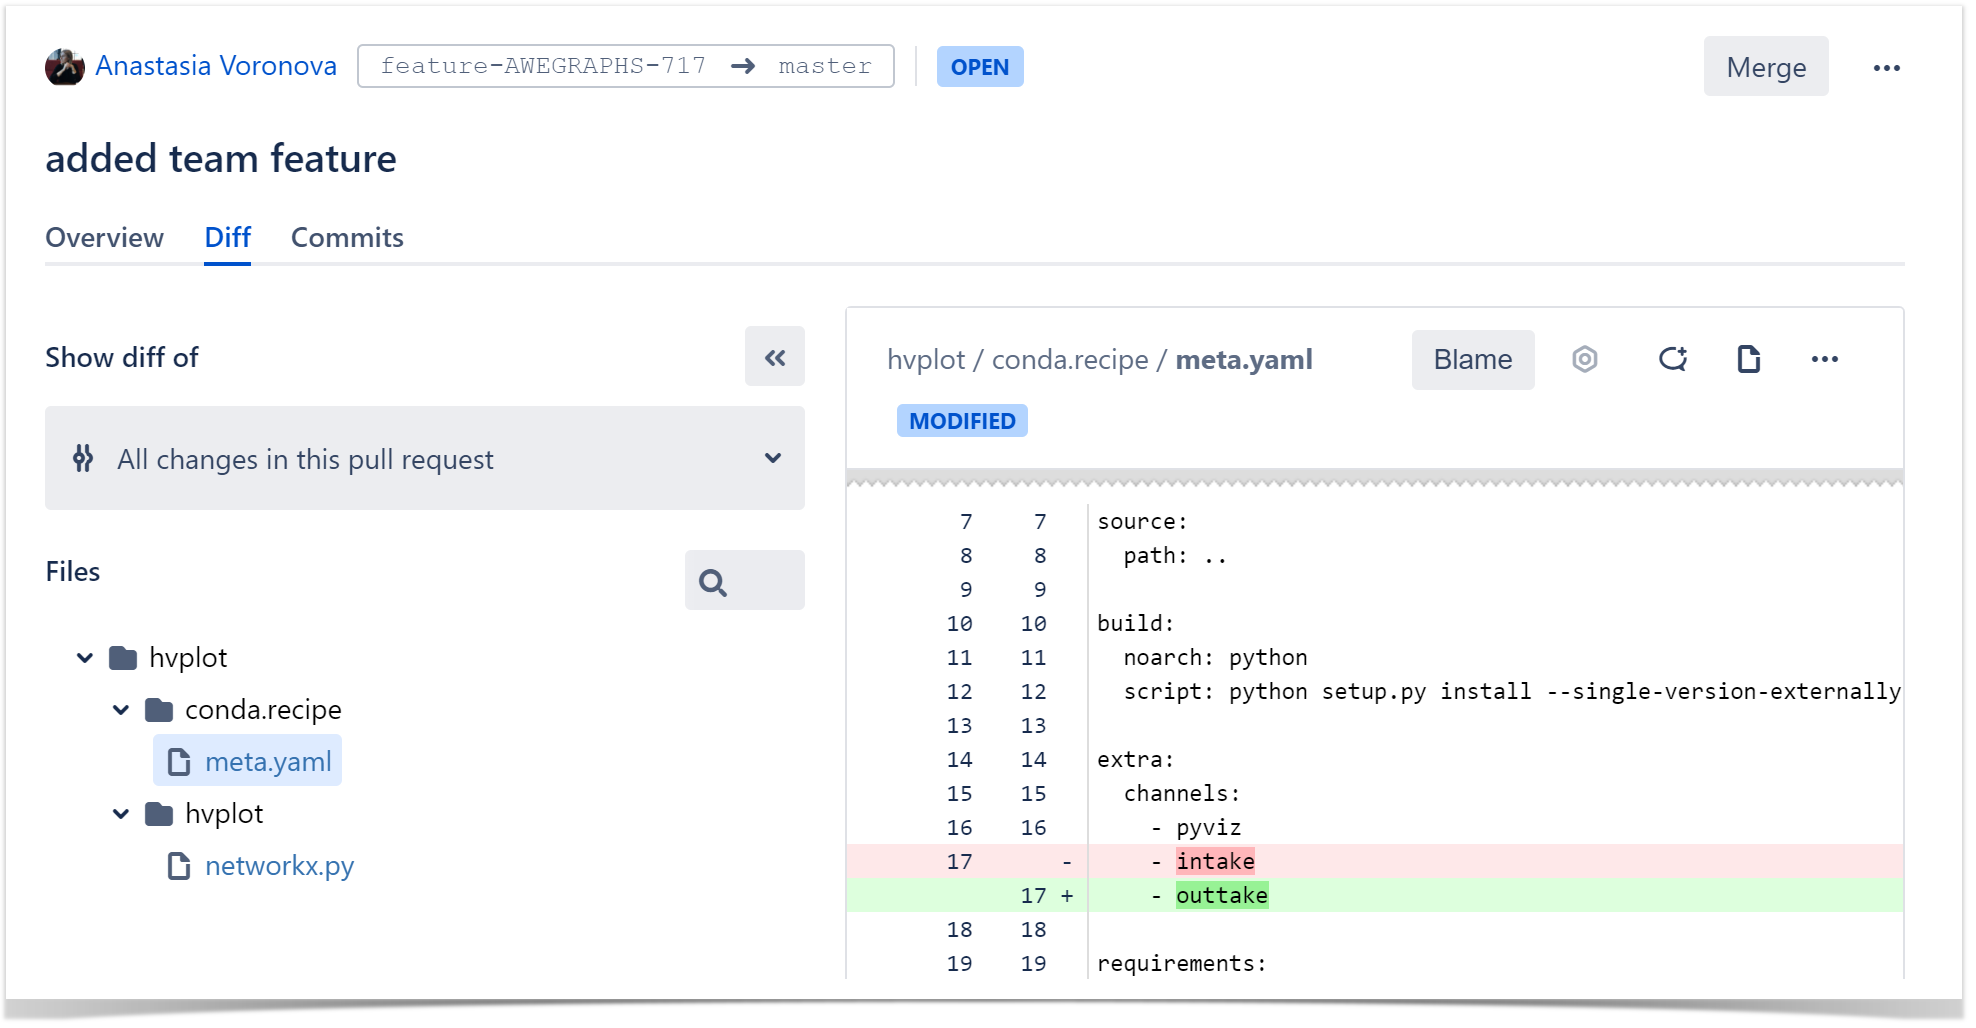
    The app also gives you the possibility to watch the Blame view, leave comments and suggest improvements in pull requests. It makes the process similar to reviewing changes in the original repository.

    Submodule Changes for Bitbucket is a completely free app that can simplify the code review process for the teams that use Git submodules for their projects.

    Try it and see how it fits your workflow!

    Related posts

      Data Center Approval Procedure for Atlassian App Vendors

      January 8, 2019
      #How To#Confluence#Jira#Bitbucket
      8 min

      Atlassian delivers a variety of applications for planning activities, managing projects and products, storing source code, and building solutions to small companies and large enterprises. Like no other companies, Atlassian team understands how unpredictable downtime or performance downgrade may cause operation instability even in the company with refined processes and procedures.

      To avoid occurrence of such issues in operation with their applications, Atlassian initiated the Data Center approval program for apps distributed on the Atlassian Marketplace. This program was designed to ensure that apps for Data Center are developed with highly available, clustered environments in mind. Each app undergoes a testing and validation process run by Atlassian in cooperation with a Marketplace vendor. Apps that successfully pass this procedure are proven to perform reliably and consistently in large-scale Data Center environments.

      Developing App for Atlassian Data Center Application

      Marketplace vendors that want their apps to be compatible with Atlassian Data Center applications need to undergo the approval process. It includes the following:

      • Filling out a Technical Readiness Checklist for the app
      • Testing app impact on application endpoints
      • Scale testing of the app and its impact on the Atlassian application
      • Support and issue escalation details

      All these items require significant input from the vendor team and preparation of the large-scale environment for testing. The vendor team needs to identify all the integration points where the app interacts with the Atlassian application and test their performance.

      Technical Readiness Checklist

      This is a detailed questionnaire with more than 150 questions detailing the app operation in the Data Center environment. It is comprised of the 10 major sections that cover all the crucial aspects of the app processes and its impact on the Atlassian ecosystem.

      It requires specification of information about data caching and its distribution across nodes, database transactions, cluster locking for running long-term operations, event handling, scheduled tasks, resource usage, security, and other things that may impact the Atlassian application.

      Testing Application Endpoints

      The vendor needs to run a series of tests to verify that the app does not have great impact on the native application REST endpoints after the app installation. This is required to ensure that the app cannot cause the endpoint slowdown or failure under the high load. If your app does not interact with any application endpoints, this testing can be skipped.

      Scale Testing

      Every app needs to be tested in the one-, two-, and four-node environment under the high load. This load testing allows you to identify problems if your app greatly impacts performance of an Atlassian application. Testing is performed in two runs: with the app enabled and with the app disabled. Here the vendor can get great insights on the performance of the app under the load and identify points that can be accelerated.

      Support Escalation Details

      Here the vendor specifies how and who the Atlassian team may contact in case of an emergency case. Every vendor needs to have a dedicated contact channel to provide support for enterprise customers with Data Center deployments.

      Making our apps Data Center approved

      We at StiltSoft have already four apps approved for usage with Atlassian Data Center applications. Here they are:

      • Awesome Graphs for Bitbucket – app to visualize and analyze performance of individual developers and evolvement of project repositories over time.
      • Table Filter and Charts for Confluence – app to manage table data, filter data against multiple criteria, aggregate it in pivot tables, and visualize this data with all sorts of charts and graphs.
      • Smart Attachments for Jira – app to organize retention of attachments in dedicated categories within issues, set access restrictions, and run automated operations or file validations during workflow transitions.
      • Handy Macros for Confluence – a set of tools and augmentations to simplify real-time interactions with content in Confluence. It bundles the switchable status sets, image and video carousels, task reminders and inline task lists.

      All these apps have passed the Data Center approval and proved to be reliable and stable solutions under heavy load.  For all these apps you can install the Data Center compatible version on the Atlassian Marketplace. In the interface of the app listing page, you can select the appropriate hosting option, as follows:

      Don’t wait and try these apps in your Data Center environment.

      What’s New in Team Calendars for Confluence

      June 1, 2018
      #News#Confluence
      4 min

      Atlassian Confluence is a team collaboration platform that encourages knowledge-sharing and helps you place all the required information in order in one place accessible to all team members. It is a nice solution for teams of all sizes and specializations that brings a new level of transparency to your team work.

      But what really matters when we speak about the team work is to keep everyone on the same page. Especially when your colleagues have different schedule and multiple projects to work on. Atlassian offers the Team Calendars for Confluence app to improve team planning with the help of a bird’s-eye view of your team’s schedule.

      So let’s check the most interesting features and new capabilities of this useful tool.

      Team Calendars for Confluence

      You can create multiple calendars and populate them with different event types helping your team know who’s doing what and when.

      This app allows you to add custom event types to your calendar or create your own events.

      You can also set a reminder not to forget about some important events. Everyone who uses this calendar will receive it.

      A fresh look of Team Calendars

      The latest release of Team Calendars provides you with a new design of this app with updated colors, typography, and icons.

      So now you can even change the colors of the custom event types.

      The Team Calendars app now supports CalDAV

      Team Calendars easily syncs with your favorite calendar client, such as Outlook, Google Calendar (Android) or Apple Calendar. In the latest release Atlassian added the feature a lot of users have been waiting for – now this app also supports CalDAV.

      This means that after subscription to a calendar in any app that supports CalDAV, you will be able to view and update events from it and make it easier for your team to find the information needed to keep work moving forward.

      All you need to do is to click the Subscribe button and choose the required app.

      Even if your app is not listed, there’s a good chance it supports either iCal or CalDav. You just need to check your calendar app’s documentation to find out what it supports, then choose either iCal or CalDav from the Calendar app field.

      Try Team Calendars for Confluence

      This useful tool saves your time and effort when you need to understand how your schedule will affect upcoming work.

      The price for Team Calendars for Confluence Cloud starts at $50/mo for 20 users and ends at $1,350/mo for 2,000 users. For Confluence Server the price starts from $550 for 25 users and ends at $7,700 for 10,000+ users.

      Start a 30 day trial of Team Calendars via the Atlassian Marketplace!

      Related posts

        Atlassian Team Playbook: Monitor Your Team’s Health

        February 23, 2018
        #How To
        8 min

        Atlassian development and collaboration tools definitely help us monitor the health of our projects. But have you ever thought about checking the health of your team?

        If you track your team health, you can understand what factors affect the mood and engagement of your team members. This way you can ensure that your team has a healthy culture and can function as effectively as possible.

        Atlassian shared their best practices guide called Atlassian Team Playbook. They developed the Team Playbook to provide teams with a set of team building activities that can be vital in getting and keeping great business results.

        In this blog post, we will tell you more about the step-by-step instructions suggested by Atlassian. You can use this information to get your team on track towards achieving your goals.

        Health Monitors

        The Atlassian team recommends to start with Health Monitors. This way you can define where your team is at the moment, why and how you got there, and what next steps to take.

        The first thing you need to do is to identify your team type and choose the Health Monitor workshop accordingly:

        These workshops contain direct guidelines that will give you a better understanding of your strengths and weaknesses as a team, and will provide you with the insight into how to manage them up.

        For example, if you choose the Leadership Team Health Monitor, you will need to gather your team together for a one-hour meeting. Share the Health Monitor grid with the eight attributes of healthy leadership teams. Divide the participants into small groups and ask them to rate all the attributes. When you receive the results, you can go through each attribute one by one, and ask the groups to explain their rating.

        This approach will help you to assess the team’s health and focus on the things that really matter.

        During the workshops you will need Atlassian blueprints that will help you to document your team’s health during the Health Monitor workshop. You can get Atlassian Team Playbook blueprints for Confluence Server or download the apps for Confluence Cloud depending on your team type:

        The Health Monitor workshop allows you to take a closer look at the performance of your team.

        Plays

        Now when you know the major bottlenecks that are slowing down your productivity, you can choose the appropriate play that will show your team how to work better together.

        For example, sometimes it is difficult to understand the real needs of your customers. In this case the Customer Interview play can help you. And if you want to get peer feedback from teammates and stakeholders, you may try the Sparring play that will help your team take your project to a new level.

        For all the plays and the Team Playbook activities you will definitely need a rubber chicken! Do you want to know why? Check the Atlassian blog.

        These techniques allow you to determine the root cause of your problem and find the best solution to solve it. The plays suggested by Atlassian will help your team unleash its potential.

        Game Plans

        Not sure which play to run? Use the game plans. They will provide you with the go-to recommendations and examples for specific use cases.

        Choose the topic that fits your pain points:

        To achieve better results, combine all the techniques described in this blog post. These step-by-step instructions can help you address issues, make changes, and improve engagement of your team.

        What about your team?

        If your employees are not enthusiastic about the work or being on the team, no process or methodology will help. So encourage your team members and keep them motivated. Do your best to identify problems early to create a healthy work environment in your organization.

        Please, tell us about your way to check and evaluate your team engagement. Let us know if you find this blog post useful. You may also ask us any questions you have about Atlassian Team Playbook. Feel free to comment below.

        Related posts