New in Awesome Graphs for Bitbucket Cloud: Lines of Code Statistics and Aggregated Stats for All Repos
December 6, 2018
#News#Bitbucket
3 min
Awesome Graphs for Bitbucket Cloud visualizes statistics of Git repositories. View this video to see the new features and the improvements we’ve recently made to the app or keep reading.
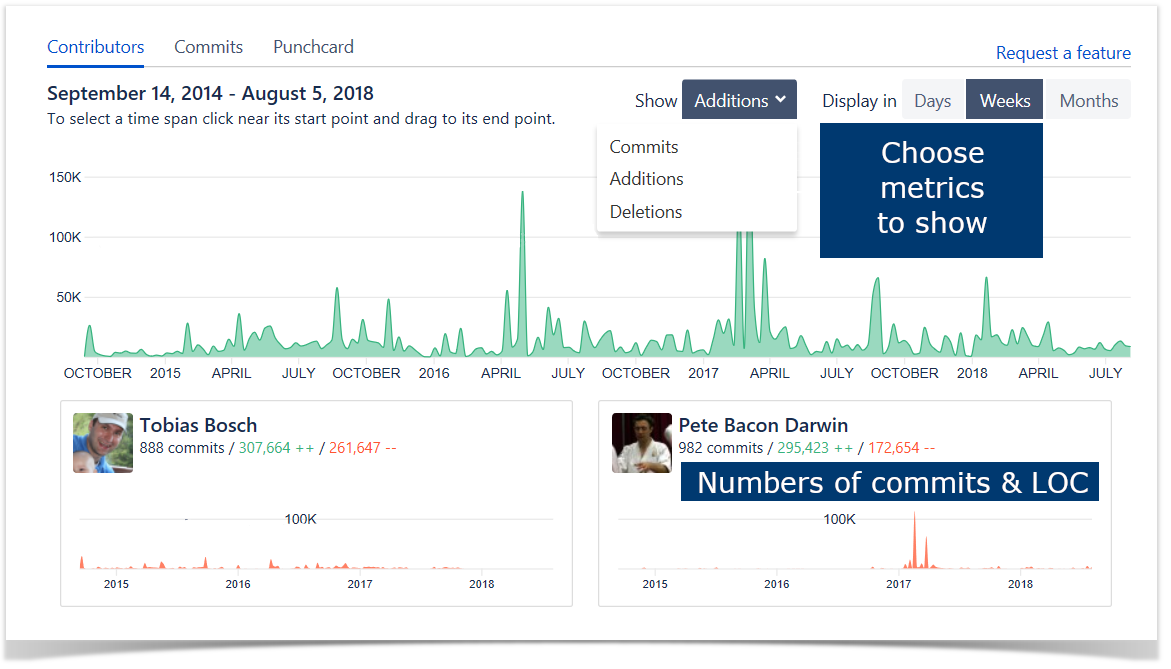
Lines of code statistics
Previously Contributors graph showed only commits statistics. Now it visualizes repository and user activity in terms of lines of code (LOC).
You can choose what data to show on the summary graph and individual contributor graphs:
commits
added lines of code
deleted lines of code
Lines of code metrics are more informative than the number of commits. They will help you to get a better understanding of project activity and efficiency of your team members.
Aggregated stats for all repositories
Now Awesome Graphs can show Contributors, Commits, and Punchcard graphs with aggregated statistics across all repositories of a user or a team.
This feature will help you to:
see your personal progress
monitor performance of your team
evaluate work of your team members
Awesome Graphs for Bitbucket Cloud is an analytical tool visualizing repository and user activity. With it, you can evaluate team’s performance, track process improvements, and deliver products faster by eliminating guesswork. Try the app now for free!
Learn more about how to install Awesome Graphs or click here to install the app.
Subscribe for monthly updates on how to get the most out of Atlassian products.
Thank you for signing up
for our newsletter!
You will be the first to know about fresh content, releases,
and special projects.
Stay tuned.
3 New Bitbucket Apps to Stay on Top of Your Projects – Third Quarter 2018
November 8, 2018
#How To#Bitbucket
6 min
With so many apps for Atlassian products on the Atlassian Marketplace, it can be pretty tough to cover every solution out there if you want to power up your Bitbucket. That’s why we’ve taken the time to try out and recommend a couple of new apps for users who want to get the most out of their Bitbucket experience. Here is our top three apps appeared on the Atlassian Marketplace in the third quarter:
You can also check our picks of the most interesting Bitbucket apps released in the first and the second quarters of 2018.
Commit Graph for Bitbucket Server
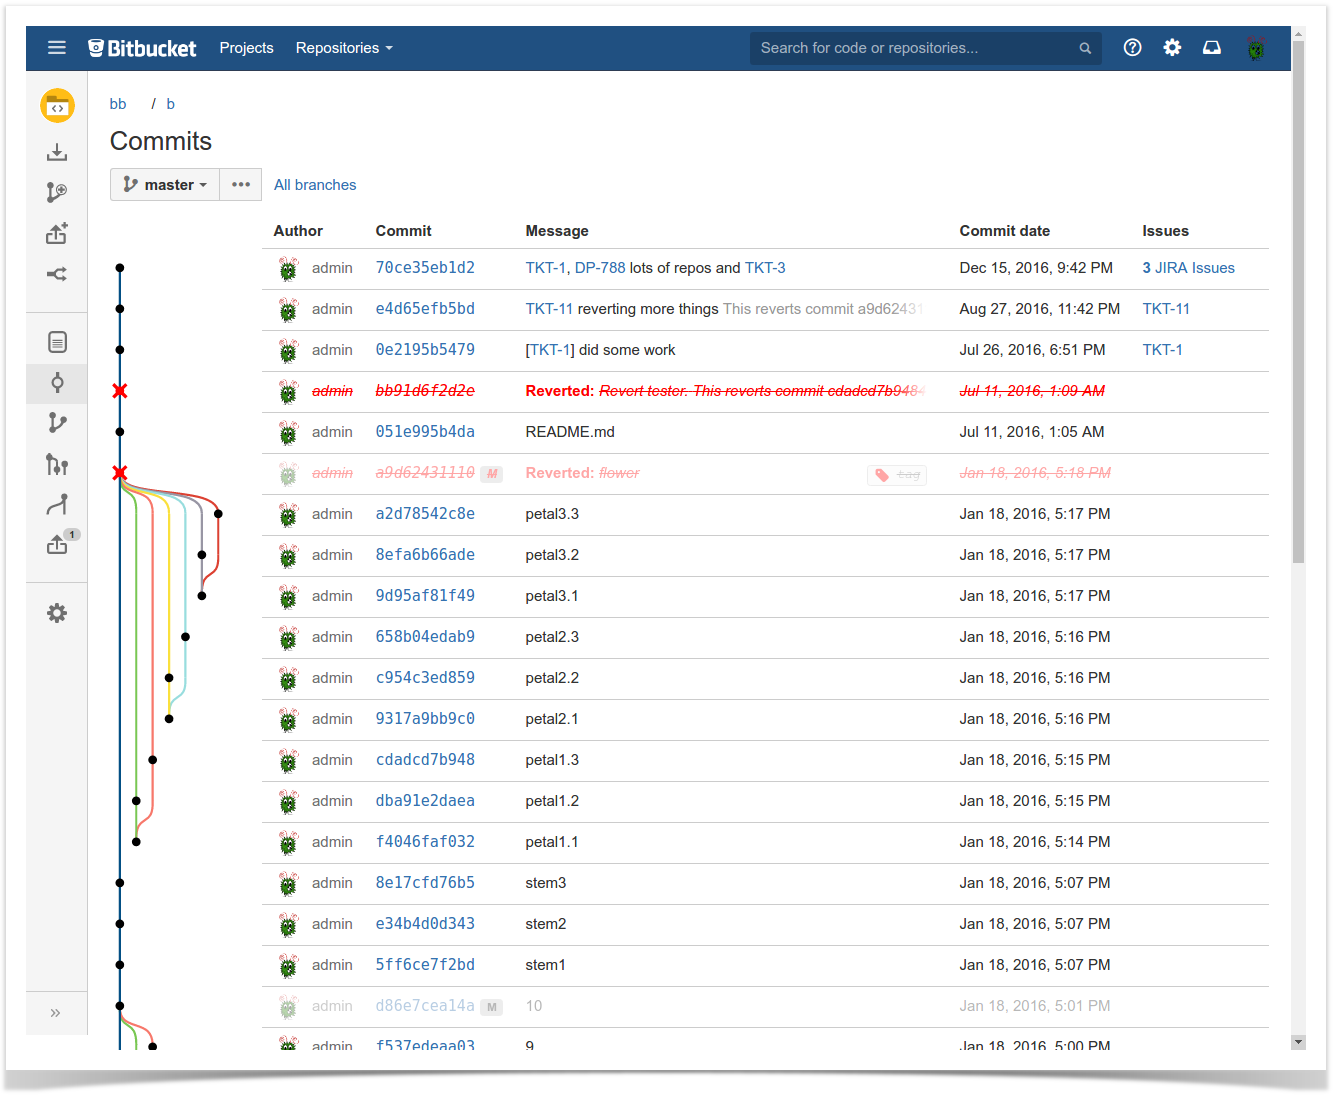
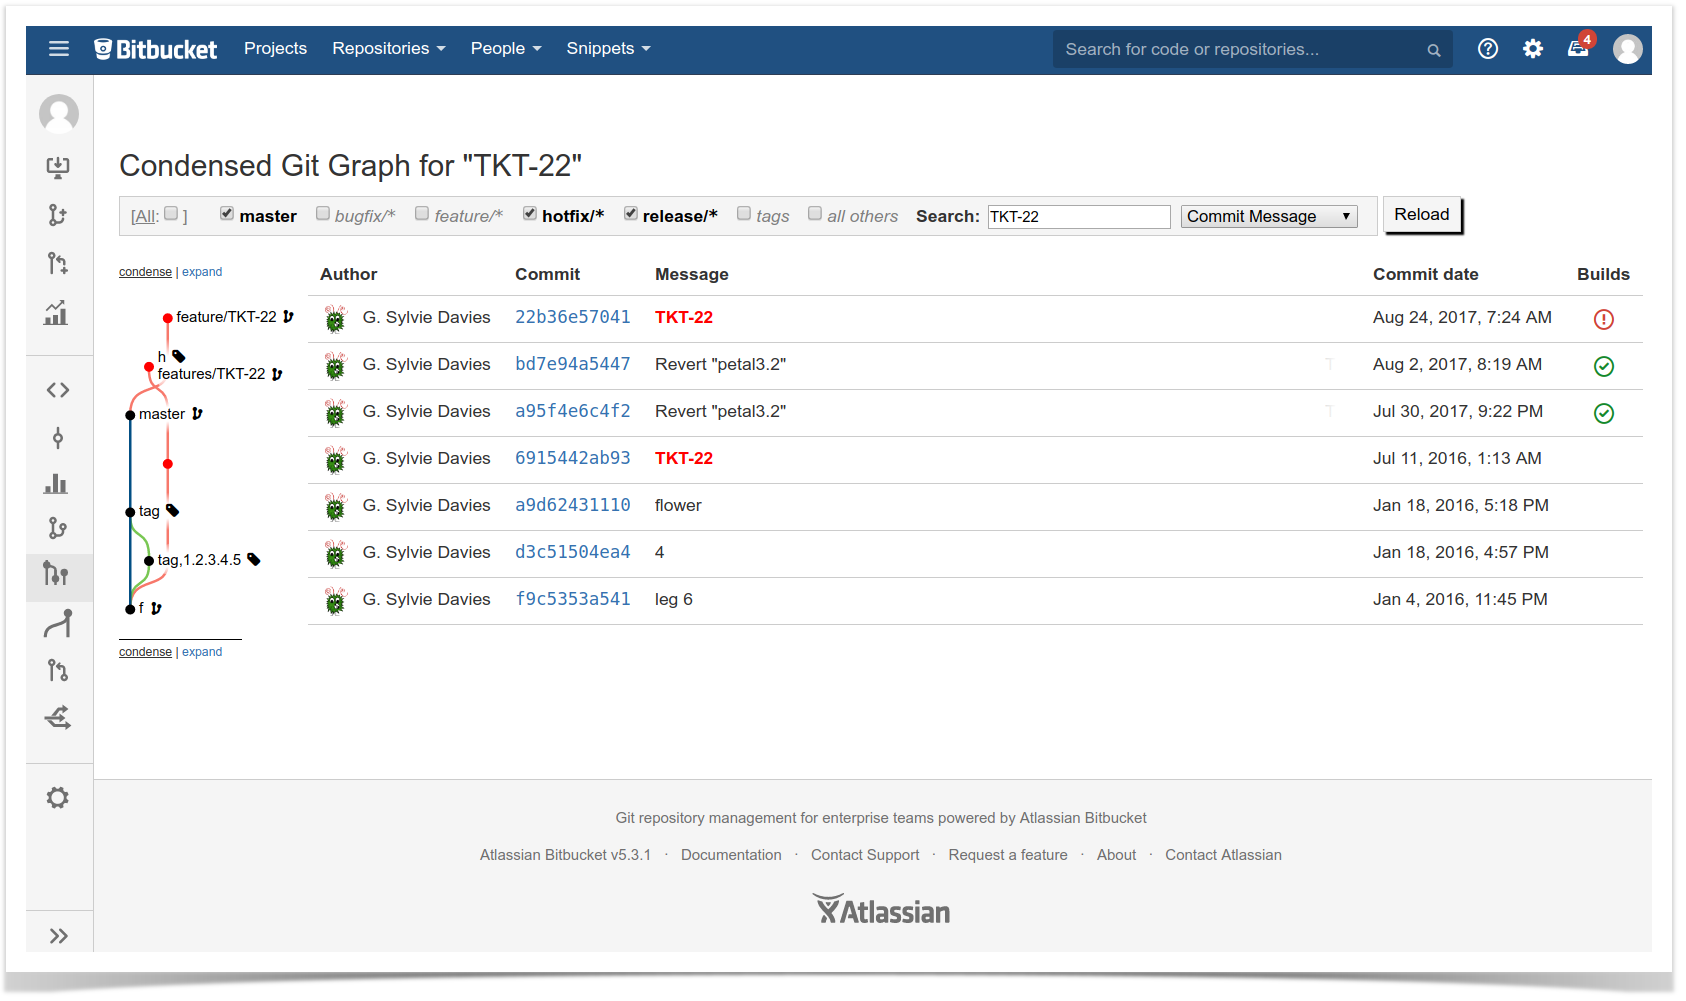
Commit Graph for Bitbucket Server appeared on the Marketplace in 2016 as a part of the paid PR-Booster app. Now it is an independent free add-on that helps you get a clear overview of commit activity across branches in a nice way so you can identify them quickly. This graph integrated into the Commits page allows your team correctly render octopus merges and orphan branches.
You can easily filter and search user names, Jira tickets, and more. You will see the results in a condensed git graph.
This app does not cache, persist, or index any data, works on large Data Center instances and is compatible with all branching strategies.
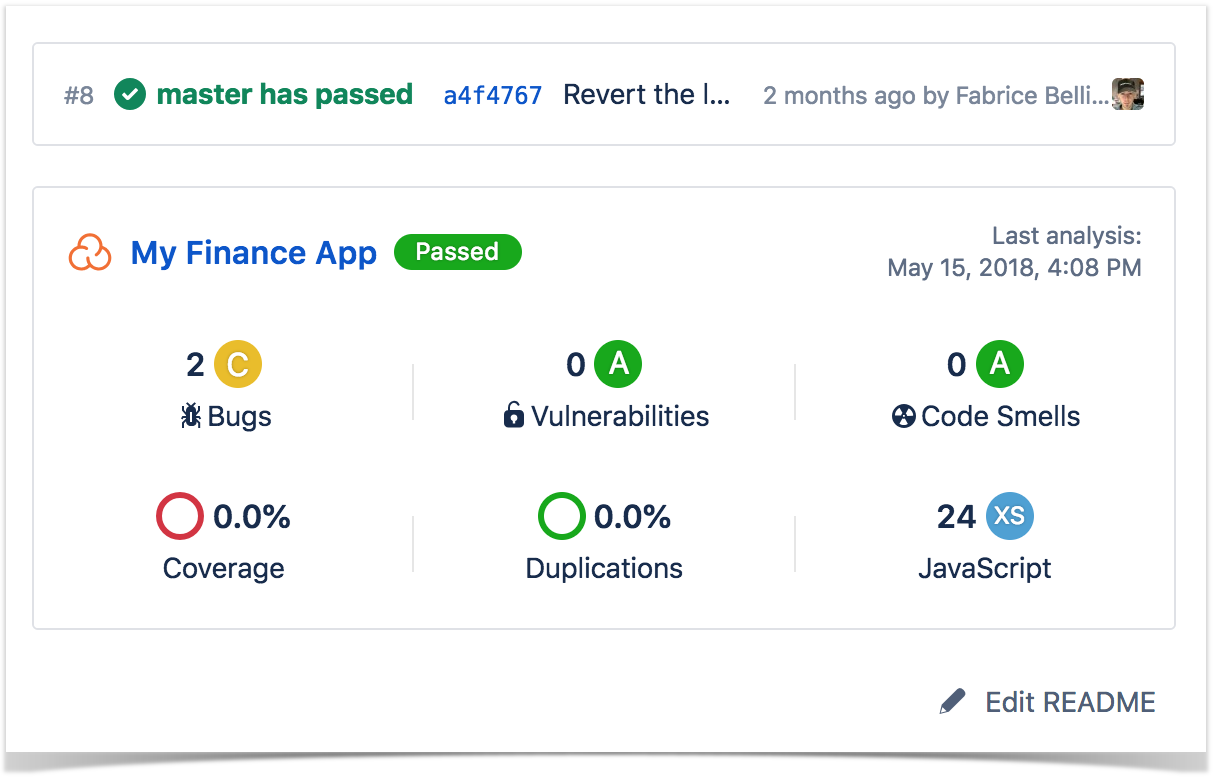
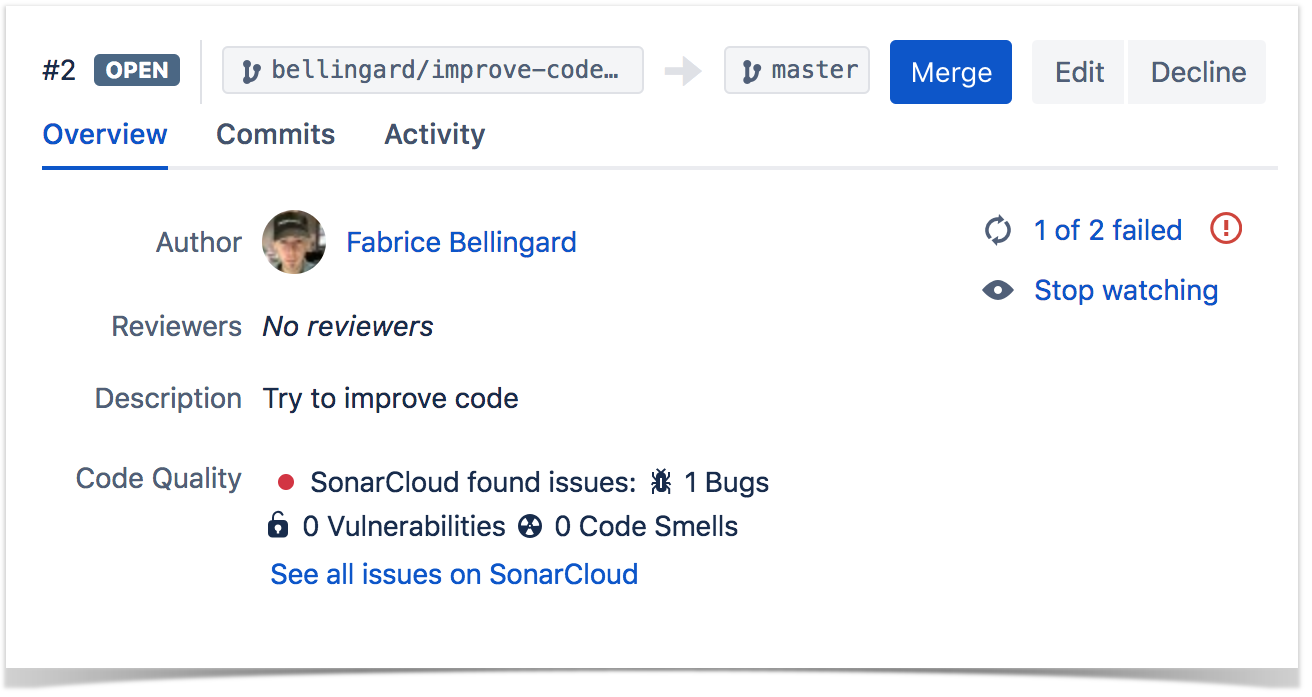
SonarCloud is a handy tool that helps you analyze your source code detecting the various issues that may influence the code quality. Moreover, this app supports all major programming languages, including Java, JavaScript, TypeScript, C#, C/C++, and more.
Powerful static code analyzers of the SonarCloud app help you track bugs and quality issues providing you with the overall picture of your code commit by commit. This apps allows you to detect and fix issues before they are merged into the master branch.
The Sonar Cloud team will offer you a paid plan in case you need to run a private check for the closed source code
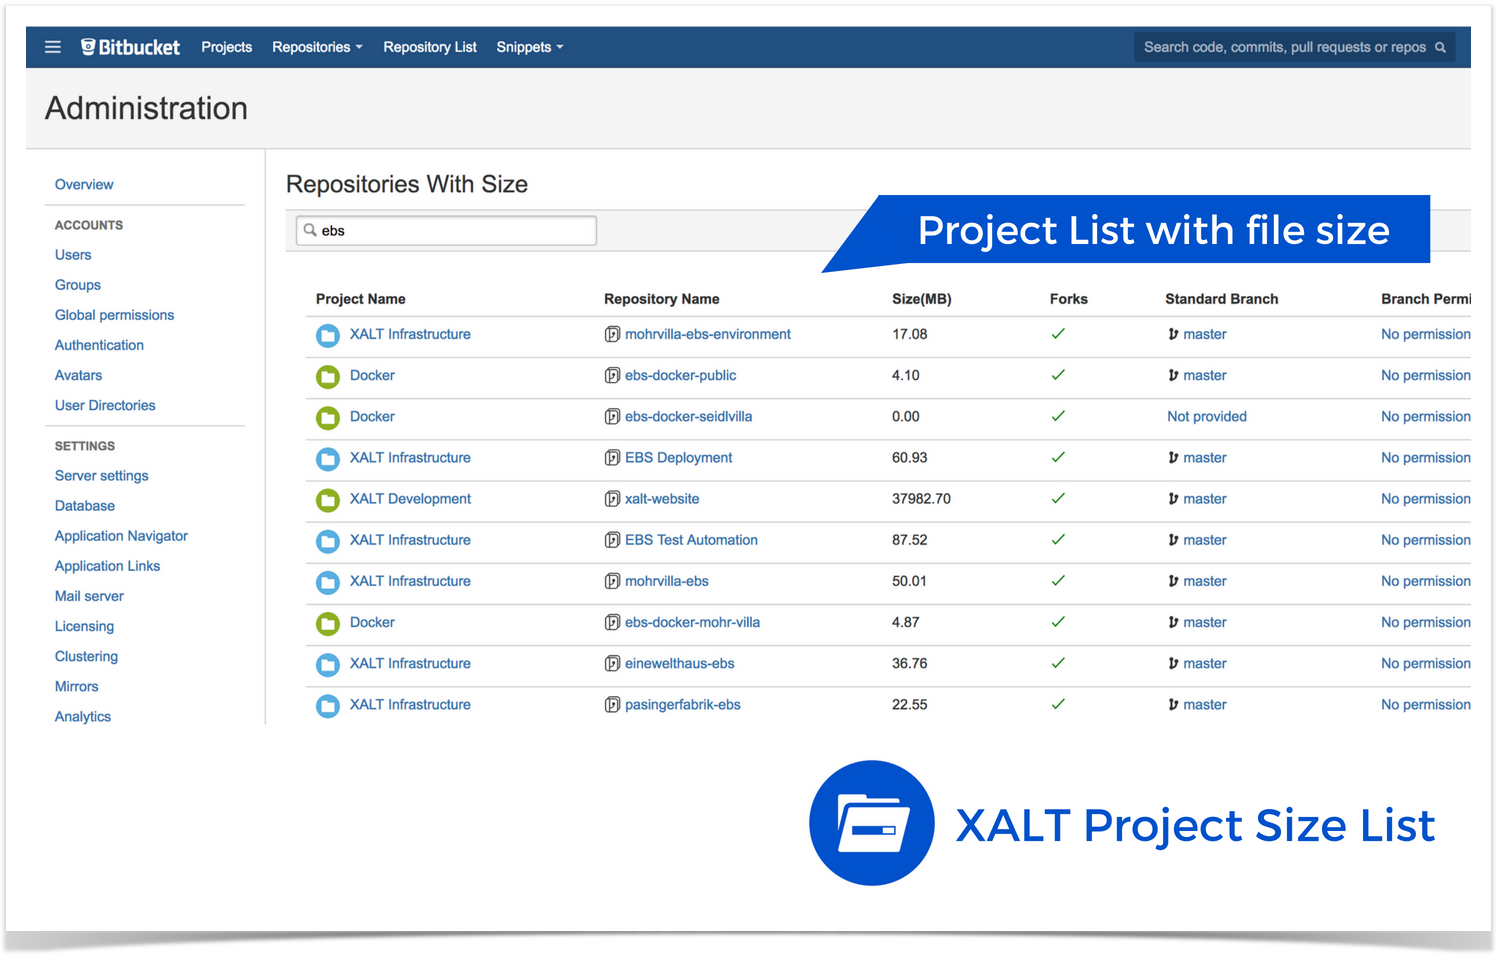
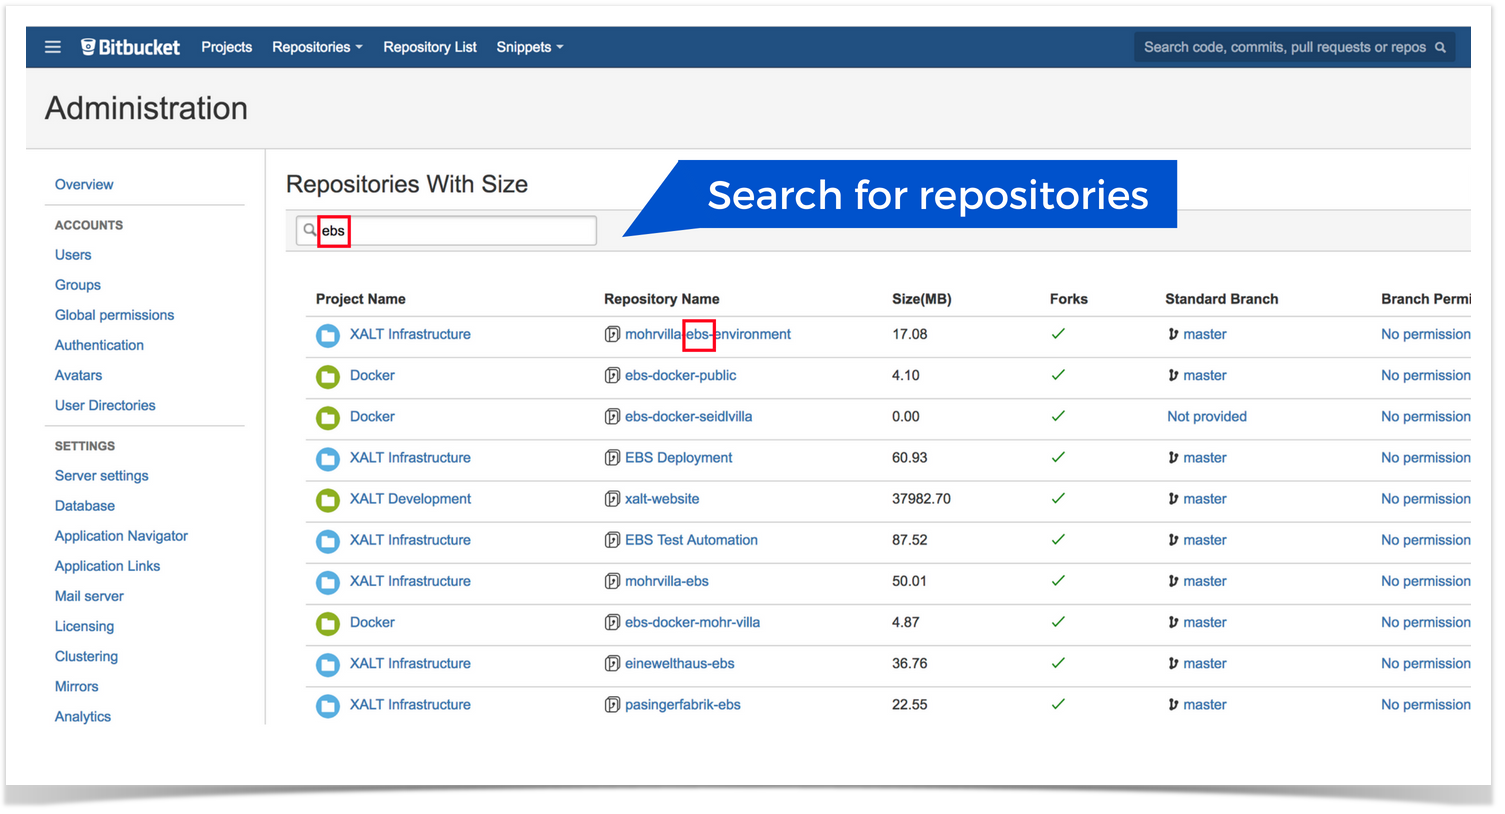
Project Size List for Bitbucket is a tool that lets developers view all projects with their storage space (MB) used on the hard disk. Now you can sort your projects by size.
You can create project tables in Bitbucket to list your repositories and projects including information about their size, forks, branches and branch permissions. This app also helps you search specific projects and repositories.
If you want to get more information about your projects, for example, pull request and commits metrics, you can try out Awesome Graphs for Bitbucket. This app allows you to quickly evaluate the performance of your team and get the insights into your projects’ history and code quality.
If you have any questions, feel free to comment on this blog post. Stay tuned and subscribe for email notifications about new posts in our blog – enter your email in the ‘Newsletter’ section on the sidebar.
Subscribe for monthly updates on how to get the most out of Atlassian products.
Thank you for signing up
for our newsletter!
You will be the first to know about fresh content, releases,
and special projects.
Stay tuned.
New in Awesome Graphs: Analyzing Pull Requests Resolution Time, Monitoring Repository Indexing, and More
November 1, 2018
#Analytics#News#Bitbucket
6 min
Our app Awesome Graphs for Bitbucket visualizes statistics of commits, pull requests, and lines of code helping to monitor and analyze code development and code review.
During the past year we’ve added new great features and made significant improvements. Let us tell you how you can benefit from them.
Pull requests’ resolution time distribution
We’ve created a new pull requests report – Resolution Time Distribution.
This report helps you to answer such questions:
How long does it usually takes to resolve pull requests?
Are there more pull requests with a long or short resolution time?
What is an expected resolution time for future pull requests?
What pull requests of the period had the shortest/longest resolution times?
How long it took to resolve a particular pull request?
In the report you will see pull requests grouped by time taken to resolve them (merge or decline).
You will see median, 25 and 75 percentile of pull requests’ resolution time. This data can help you to estimate resolution time of future pull requests.
For any time interval (blue bar on the chart) you will be able to see a list of all pull requests with their resolution time and reviewers. For more detailed analysis you can easily switch to a particular pull request to see code changes and discussion during review.
We’ve created powerful tools helping to administer Awesome Graphs. These tools are helpful when monitoring Awesome Graphs performance during repository indexing and troubleshooting app related issues.
JMX Metrics
Performance of Awesome Graphs can be monitored via JMX. It provides administrators with the way to understand what is happening in the app. You can estimate how much time repository indexing will take, see if there are any issues while indexing repositories or refs, monitor resource consumption.
More information in logs
Awesome Graphs creates comprehensive logs. It helps to easily investigate app related issues.
In Bitbucket UI and in support zip admins can see information about data indexed by Awesome Graphs:
total number of indexed contributors
total number of indexed commits
number of repositories in indexing queue
Detailed information about repository indexing is recorded in awesome-graphs.log file located in the Bitbucket home directory.
Alerts to admins
If a repository could not be indexed admins will get a notification via Bitbucket alerts. It helps to quickly detect and solve problems.
We’ve significantly improved performance of Awesome Graphs during repository indexing:
Commit data are indexed in batches to decrease memory usage.
While indexing forks only unique commits are stored in the database. If the same commit exists both in a fork and an original repository, it is not duplicated. This change helps to improve performance and reduce database size. For one of our customers with 10.000+ repositories the size of the table was reduced by four times.
Awesome Graphs uses adaptive throttling. With it Bitbucket examines the total physical memory on the machine and determines a maximum ticket number that the machine can safely support. This approach improves the system performance during repository indexing. Learn more about adaptive throttling.
We are always happy to receive feedback from customers. Feel free to contact us if you have any questions or would like to suggest new features.
3 New Apps to Power Up Dev Tools – Second Quarter 2018
July 26, 2018
#News#Bitbucket
5 min
There’s always new content arriving on the Atlassian Marketplace with the potential to change the way your work, so we’ve taken the liberty of rounding up the best new Dev Tool solutions for you to try. You can also check similar post for the first quarter of 2018 to read about other handy apps picked by our team.
Here is our top three new free add-ons for Atlassian Bitbucket and Bamboo released in between April 1 and June 30:
Browse through a brief overview of these products to learn which ones can be a catch for your team.
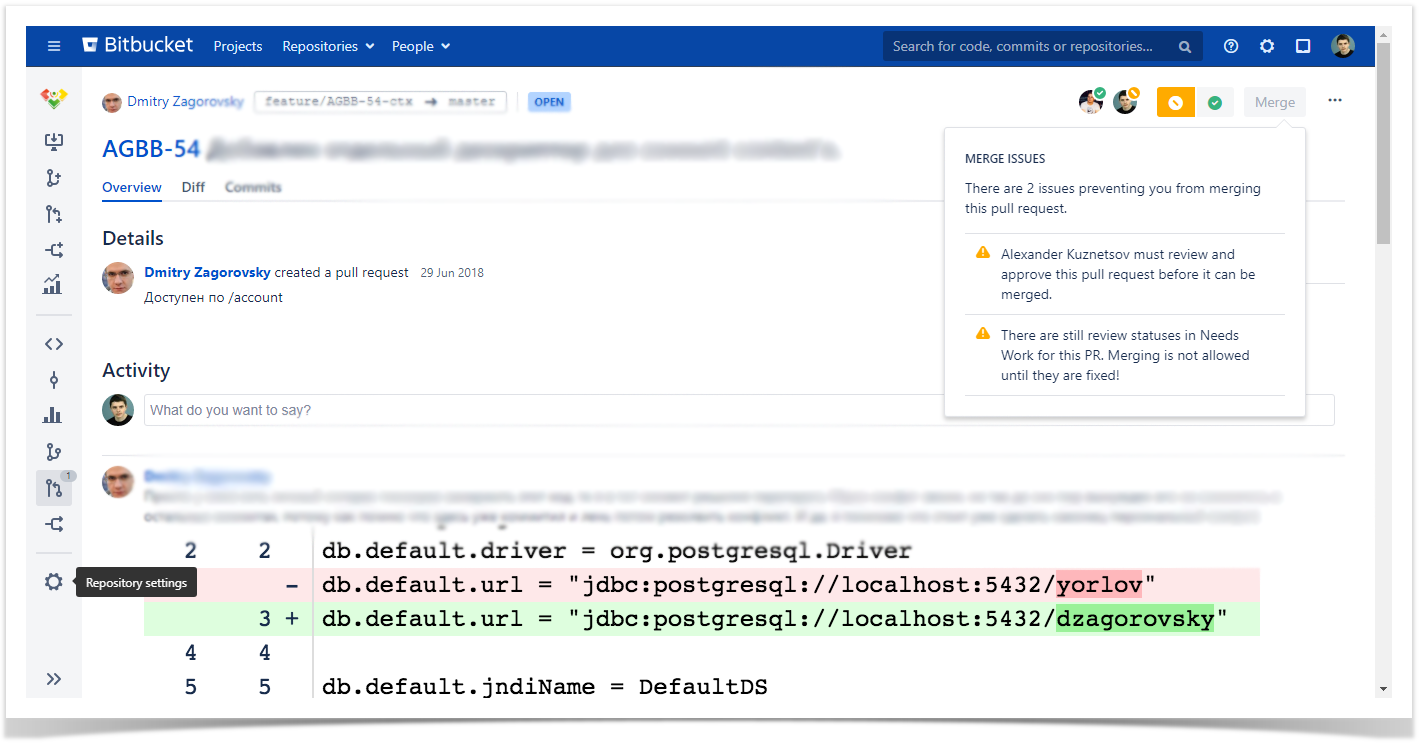
Needs Work Merge Check for Bitbucket
Checks for merging pull requests in Bitbucket prevent pull requests from being merged until your required conditions are met. In such situations the Merge button is not available letting you know what should be done to take your pull request a step further.
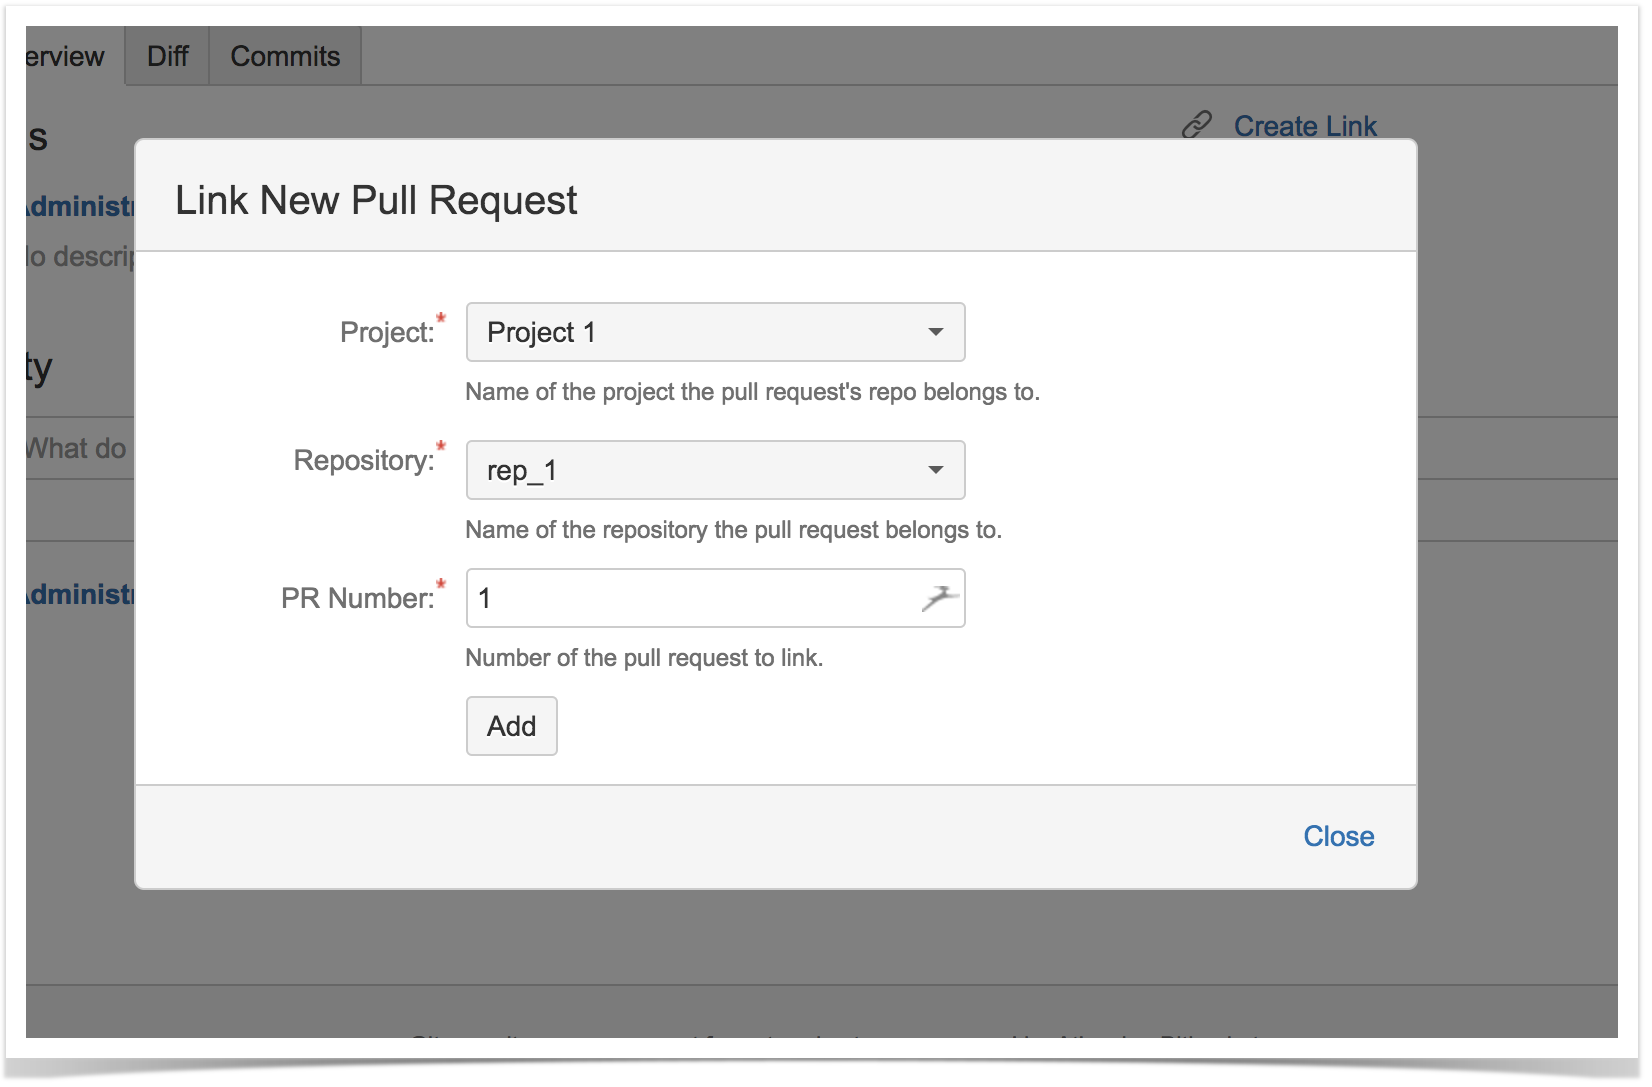
The Linked Pull Requests app provides you with easily visible links between related code changes you can have at hand. It adds the Create link button to every pull request you can use to choose the required pull request from other project or repository.
The pull requests you have chosen will be shown as the links with their status information on the sidebar and you can easily navigate between them.
Stride is a platform for workplace communication that can be tailored to all your requirements. Practically all Atlassian products have integration with Stride. Now you can receive updates about your Bamboo build results right in Stride with the help of Notifications from Bamboo to Stride.
All you need to do is to get your access token and add this app to Stride. After that just add the Stride notifications to your plan configuration in Bamboo. That’s it. Now you will receive Bamboo build notifications sent directly into the required Stride room providing you with information about the success or failure of your builds.
If you want to keep your team with up to date Bamboo notifications, you should try this simple tool.
If you have any questions, feel free to comment on this blog post. To stay tuned, subscribe for email notifications about new posts in our blog (enter your email in the ‘Newsletter’ section on the sidebar).
Subscribe for monthly updates on how to get the most out of Atlassian products.
Thank you for signing up
for our newsletter!
You will be the first to know about fresh content, releases,
and special projects.
Stay tuned.
3 New Apps to Boost Bitbucket – First Quarter 2018
April 24, 2018
#How To#Bitbucket
6 min
Last week we shared our top 5 apps for Atlassian Jira that appeared on the Marketplace in the first quarter of 2018. We’ve checked all the new Bitbucket apps and here’s a rundown of the most interesting free Bitbucket apps released in January-March of 2018:
Let’s see each app in details and find their advantages.
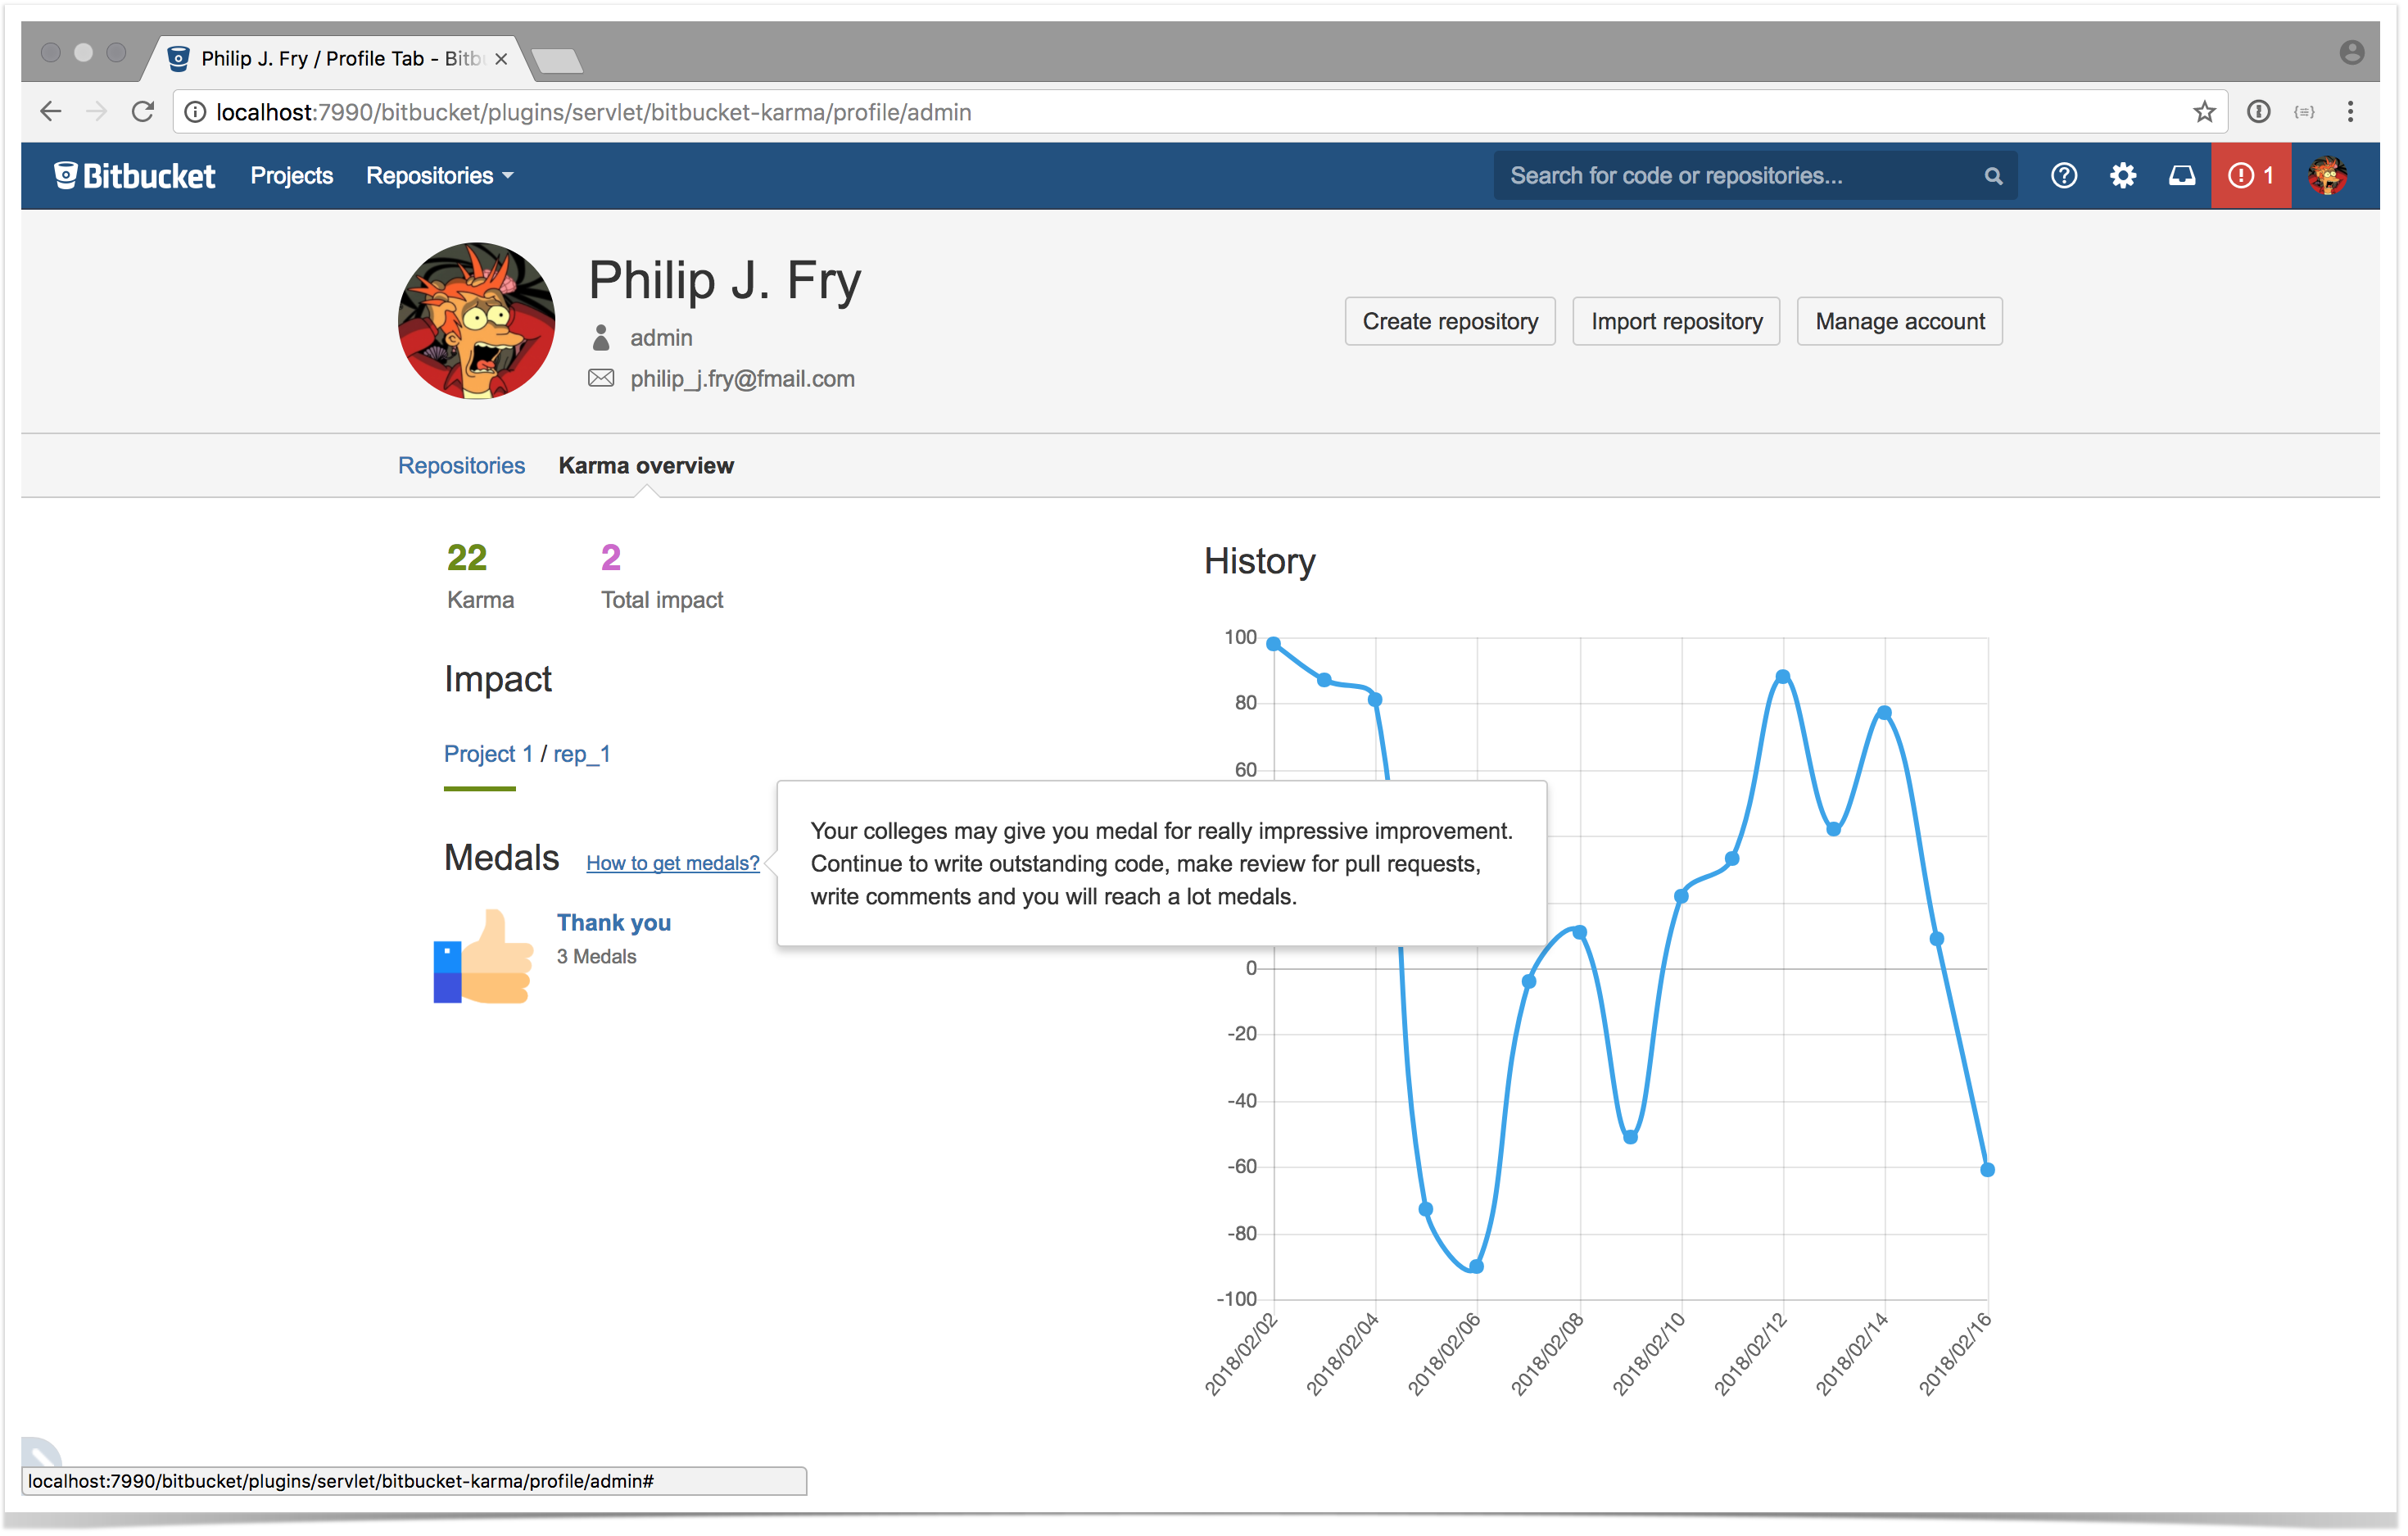
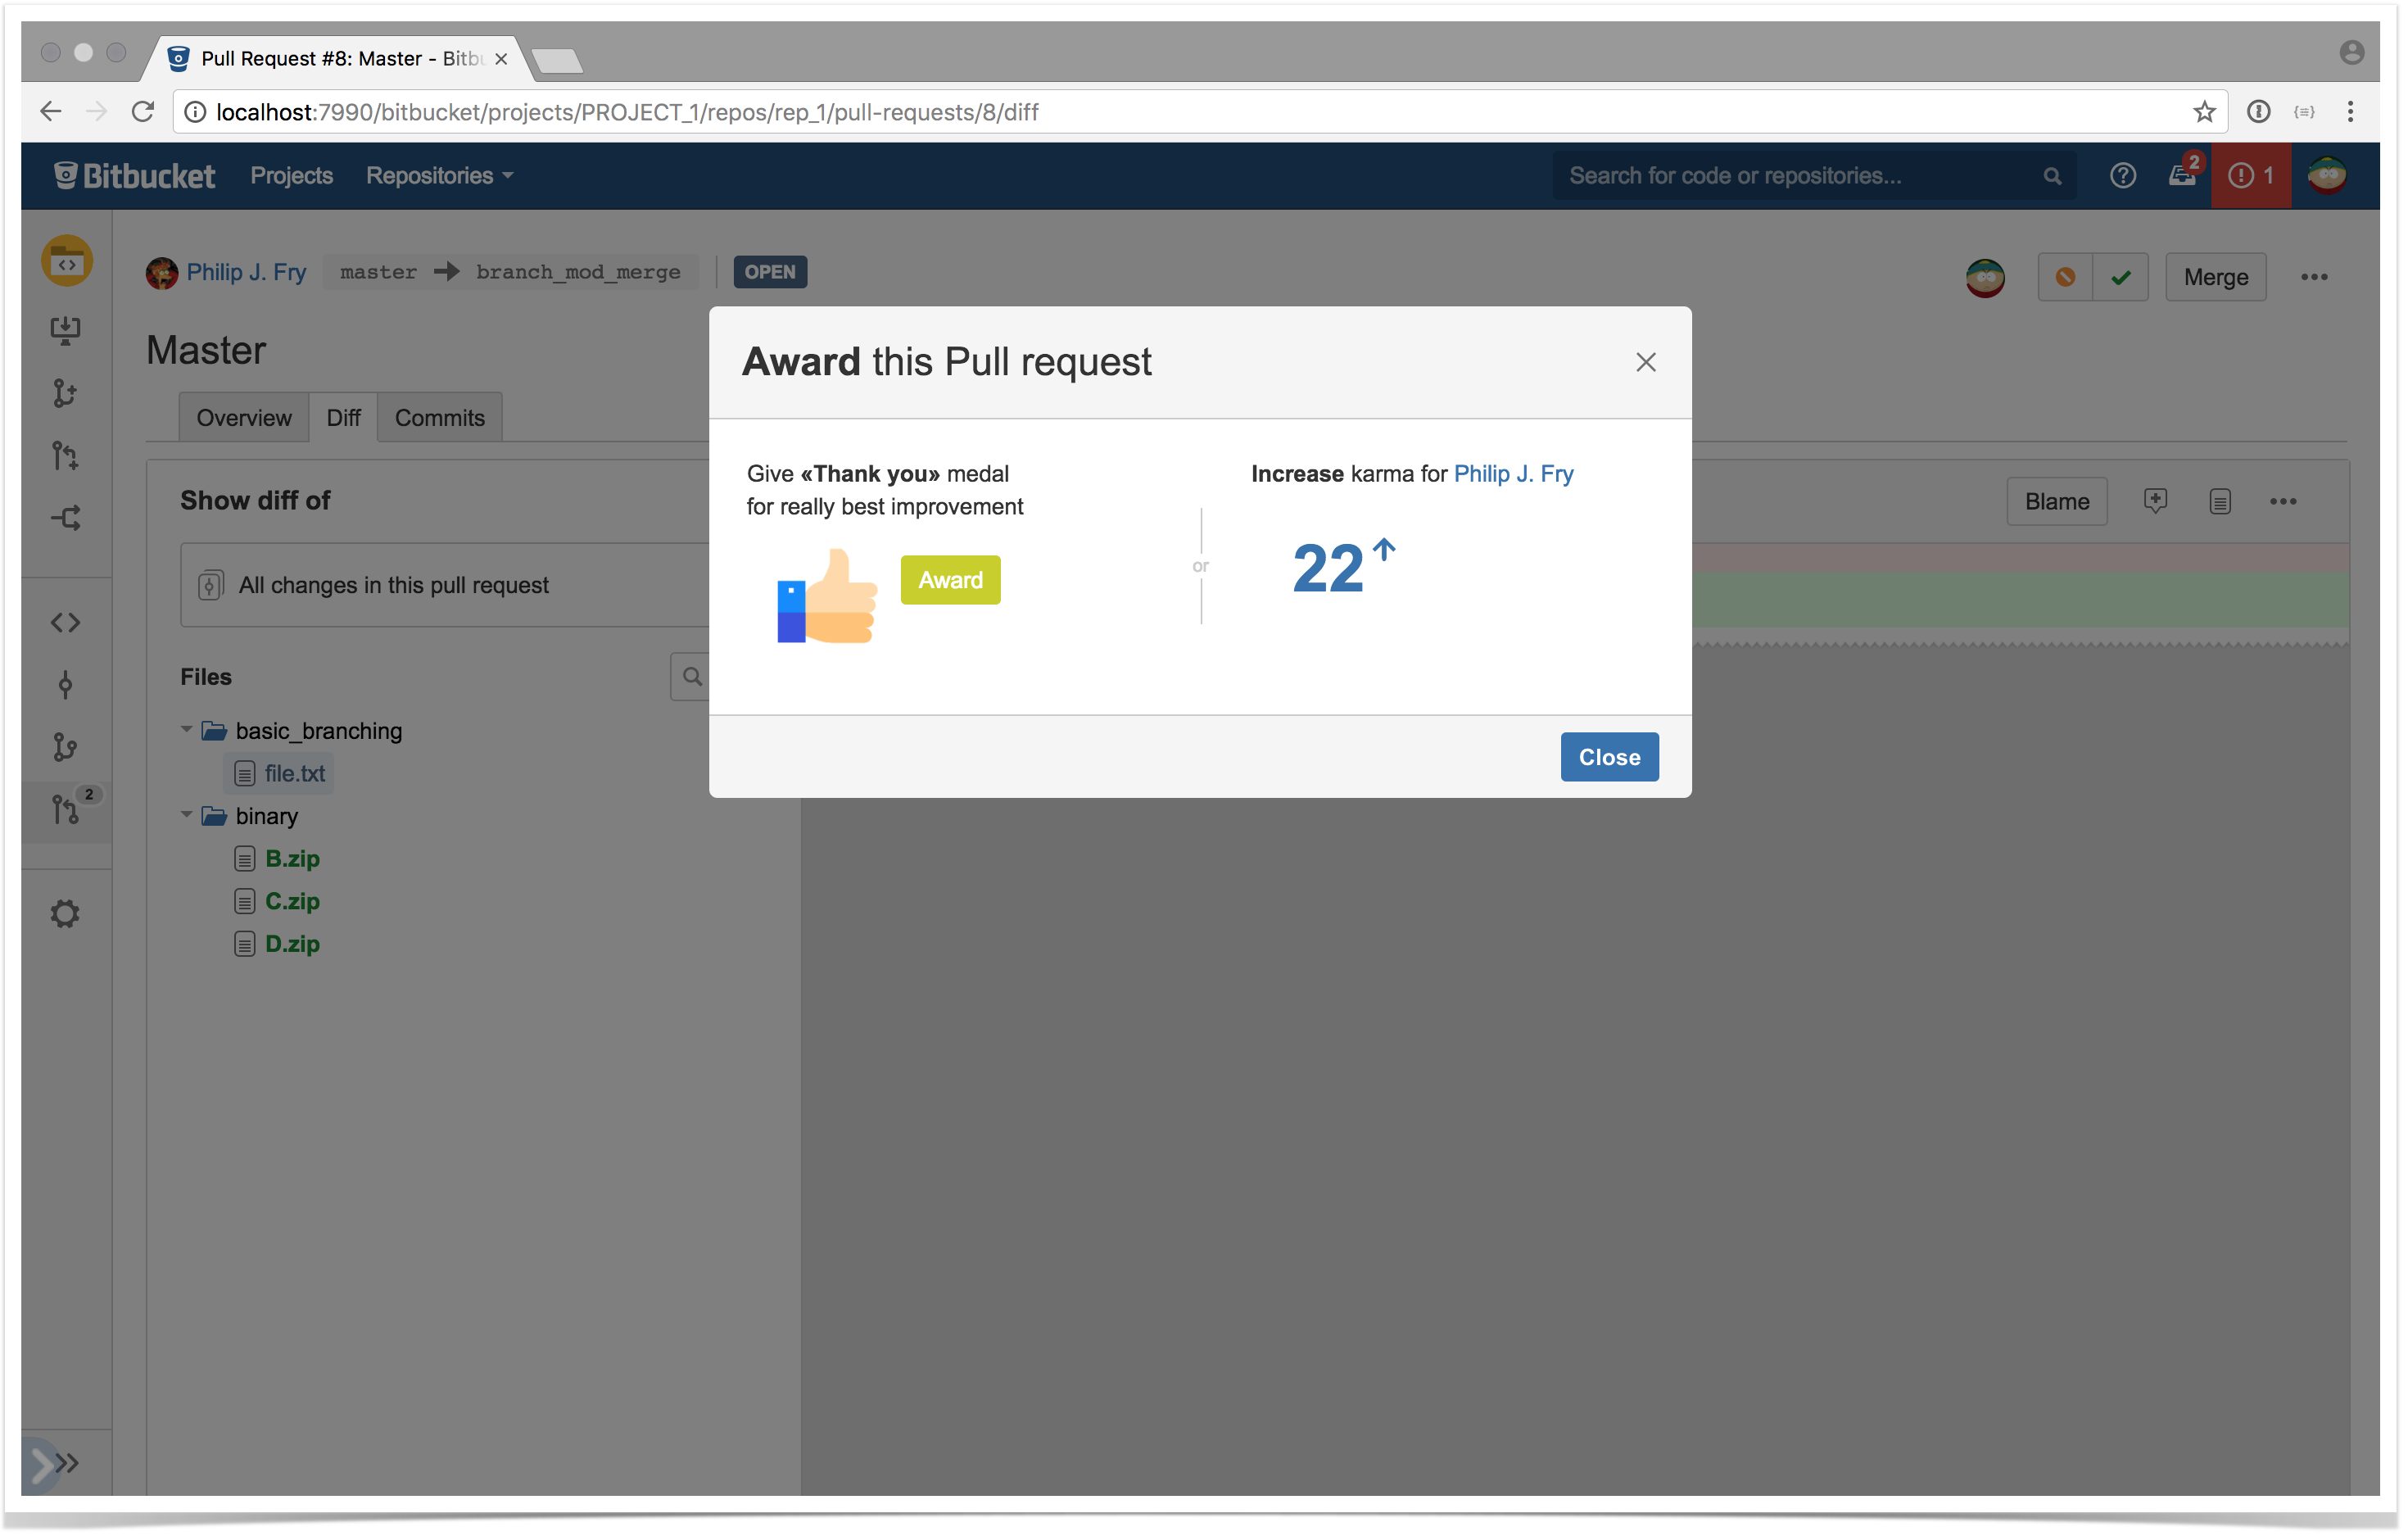
Karma
The Karma app is a nice solution that helps you motivate your software engineers and development team. It allows you to award your colleagues for great commits and pull requests improving their karma in Bitbucket.
The Karma overview tab shows you the current karma score, the number of medals received for some impressive improvements, and the total impact by repository of every contributor.
The karma can be improved in two ways:
giving scores;
giving Thank you medals.
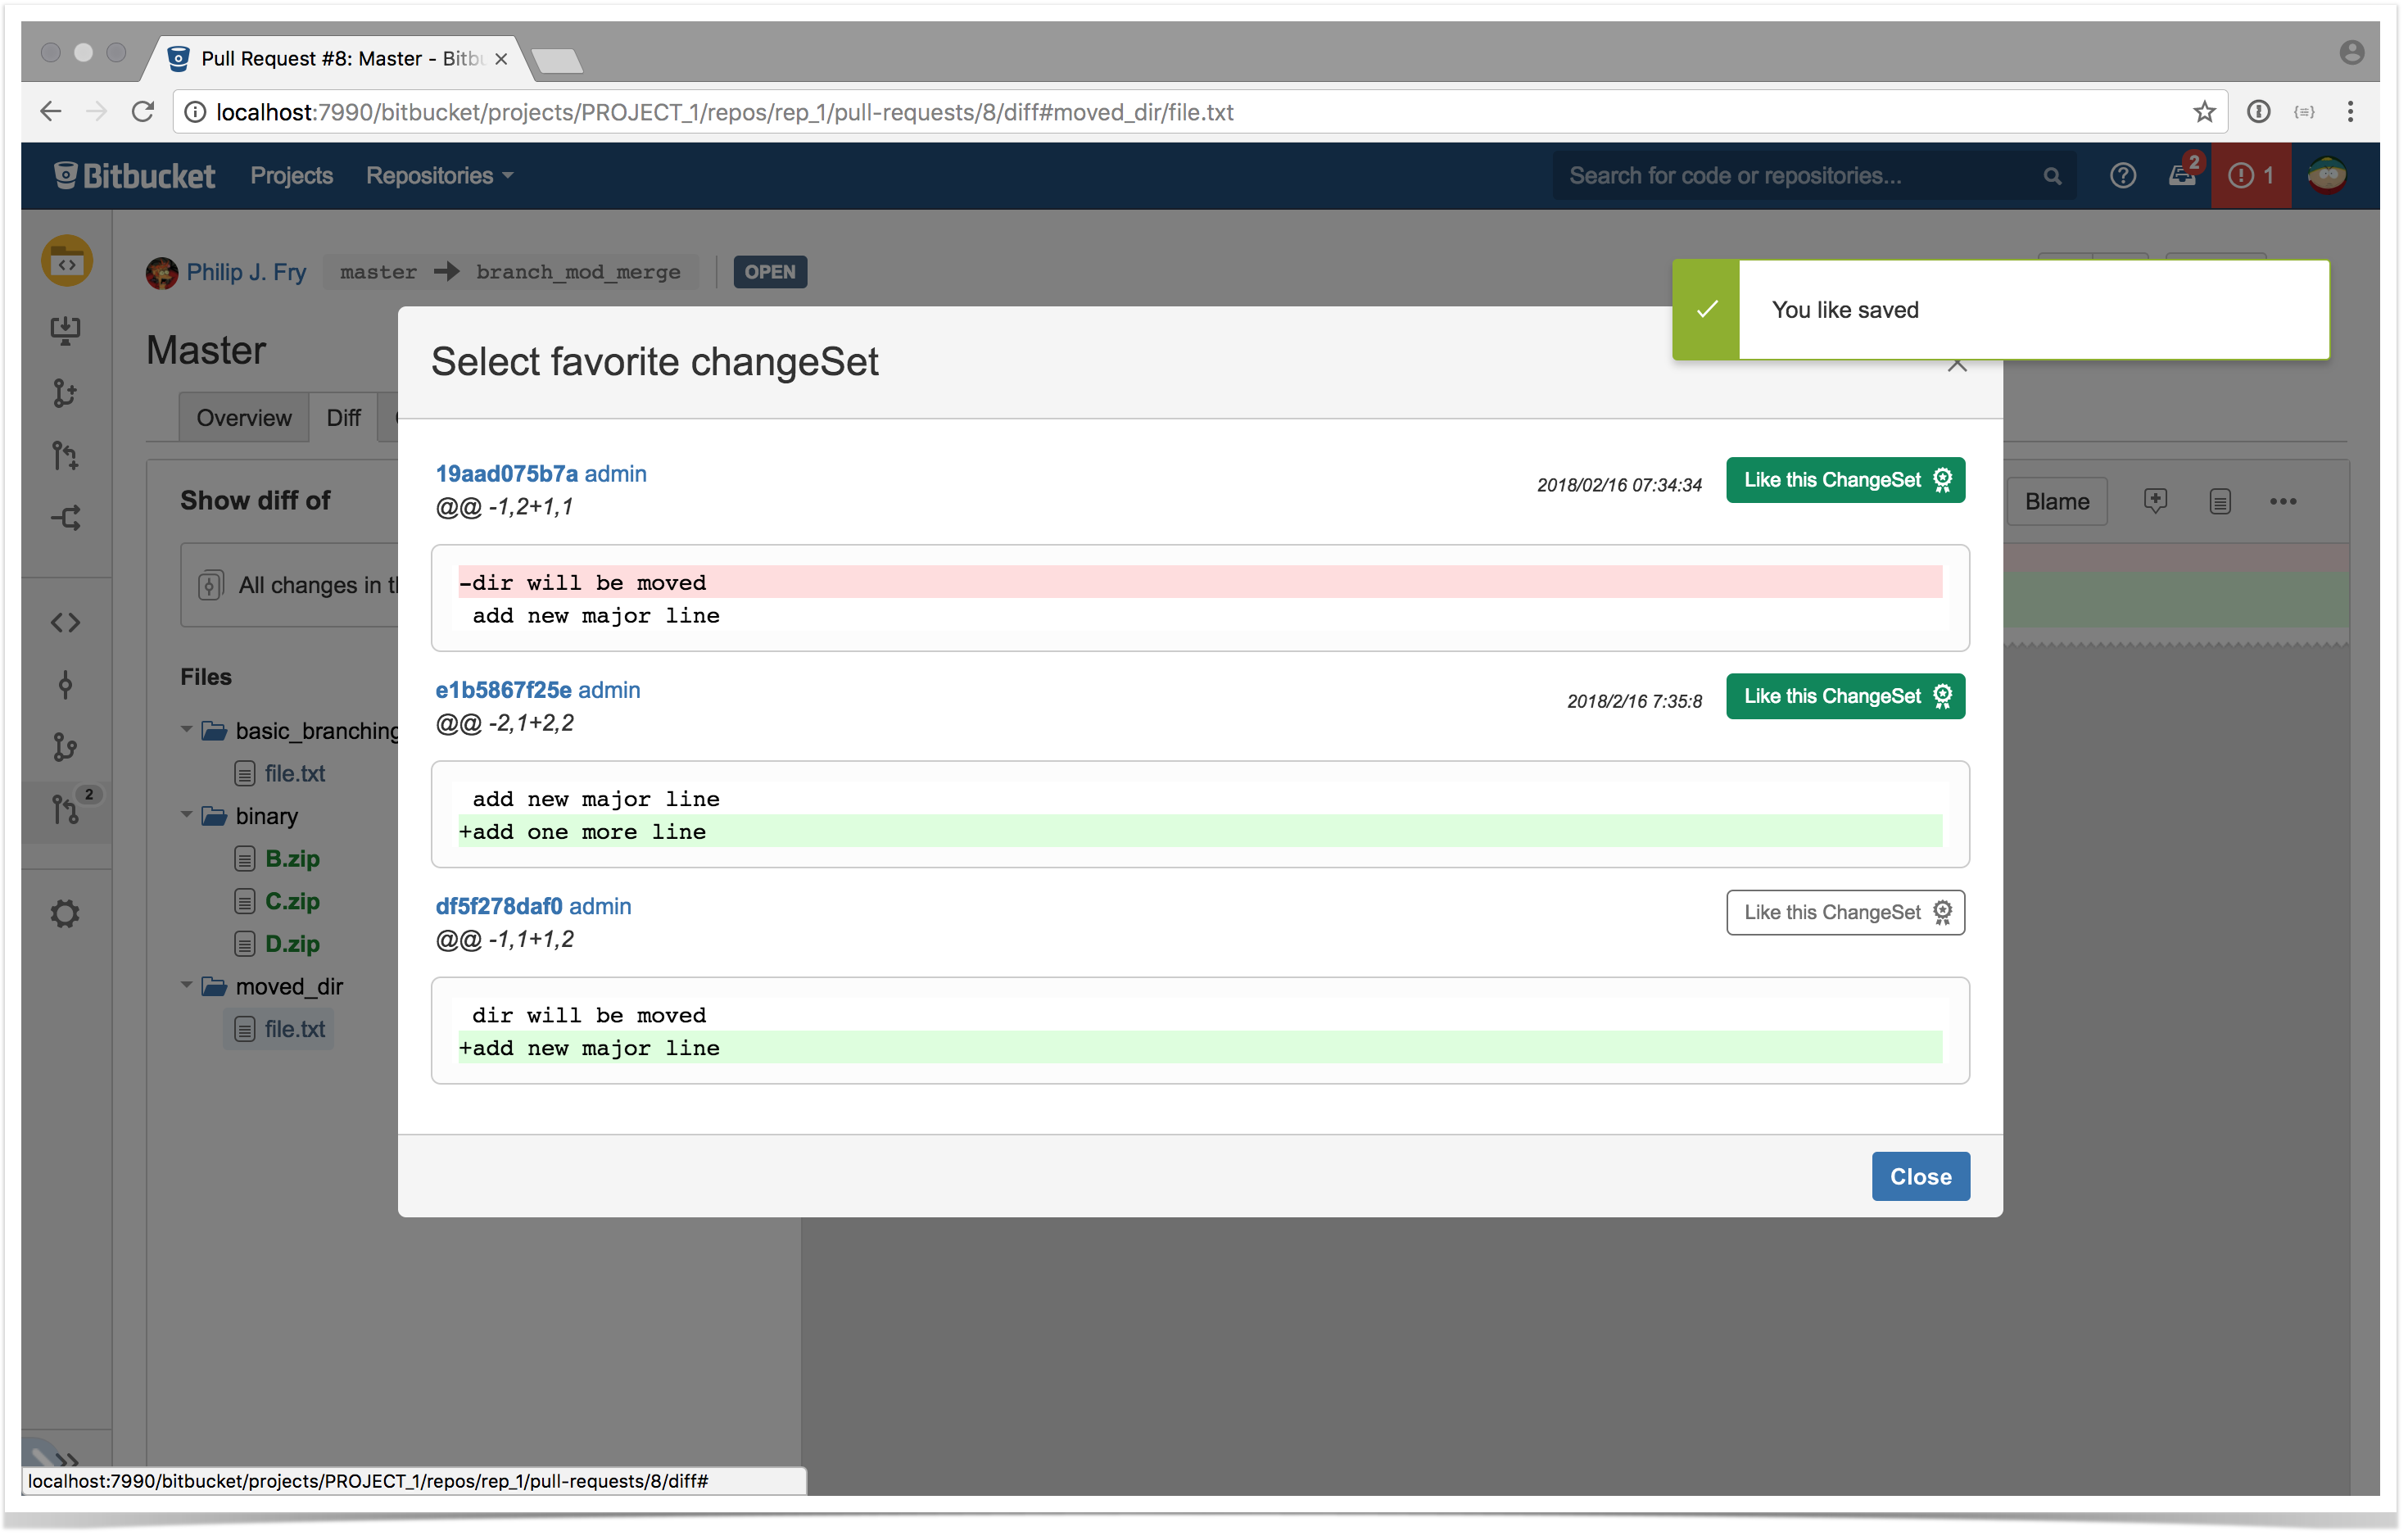
The Karma app allows you to like single changes in pull requests.
This add-on helps you reward your developers for collaborating and contributing to your projects. It seems that keeping your competitive edge in the workplace is always a good idea.
Pricing: The Karmaapp for Bitbucket Server is free to use.
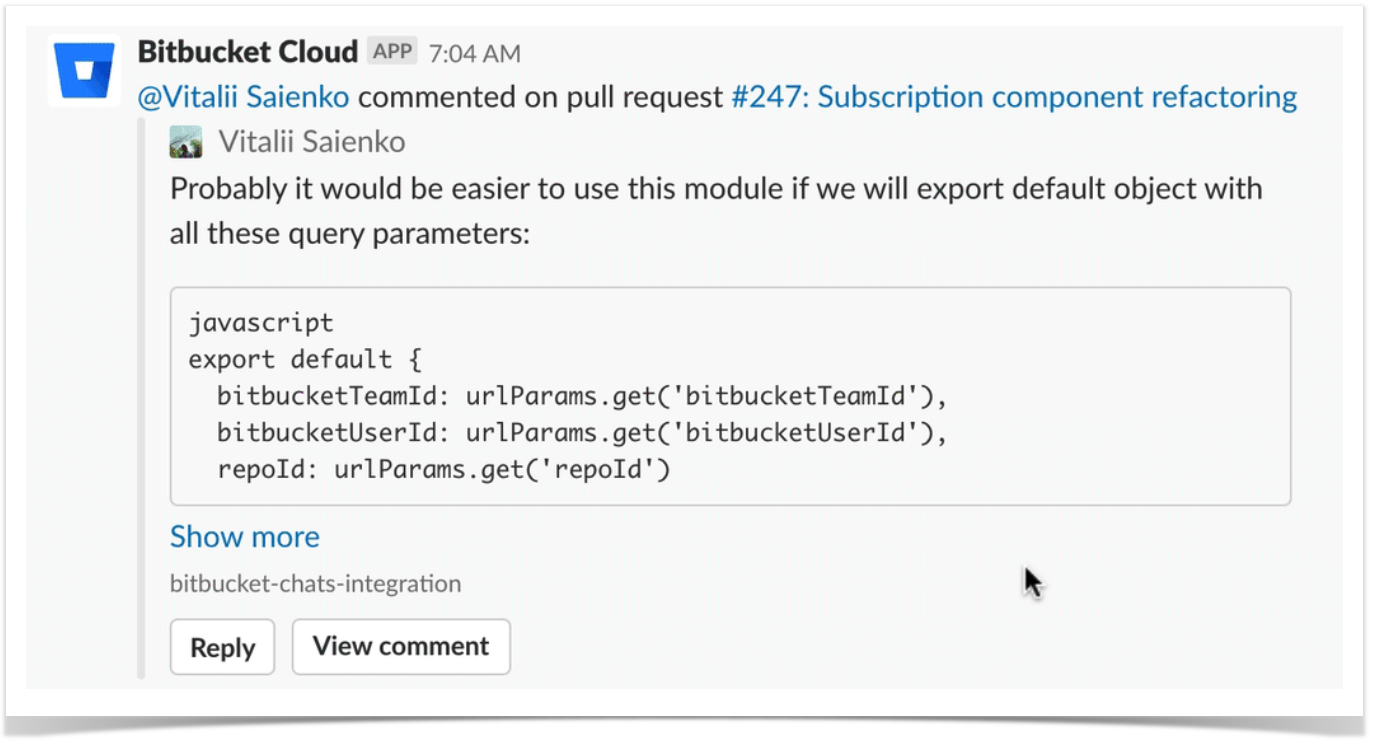
Bitbucket Cloud for Slack (Official)
After installation of Bitbucket Cloud for Slack, you get the Bitbucket Cloud bot for Slack that will help your team stay up to date with your Bitbucket activity. You will receive smart notifications about any pull request activity (important notes about pushes, merges, and builds only for your primary branch) and commit comments across the entire repository.
You can fulfill some Bitbucket tasks without leaving your Slack channel:
create a new pull request;
merge PRs right in Slack;
reply to the comments in your pull request;
re-run a failed build pipeline:
ping your team members that have an overdue PRs.
All the notifications are updated with the latest status to get your team on the same page.
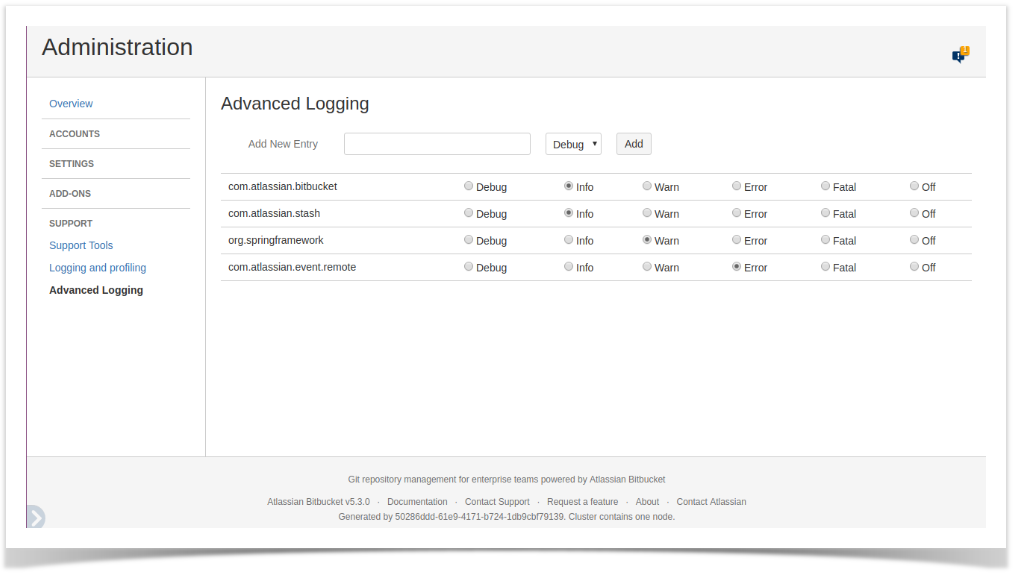
The Advanced Logging app allows you to change logging levels for different types of packages via application UI.
Moreover, you can add different system packages by clicking the Add button. So this useful tool helps you change your logging levels in one click.
Pricing: The Advanced Logging app for Bitbucket Server is free to use.
If you have any questions, feel free to comment on this blog post. Don’t forget to subscribe for email notifications about new blog posts in this series!
Subscribe for monthly updates on how to get the most out of Atlassian products.
Thank you for signing up
for our newsletter!
You will be the first to know about fresh content, releases,
and special projects.
Stay tuned.
Case Study: How to Evaluate Code Quality in Bitbucket
March 21, 2018
#Analytics#How To#Bitbucket#Case Study
7 min
This plugin helps us in Code Frequency to evaluate code quality and project history. Contributors evaluate the code committed by each person in a sprint and we use the Activity stream to show all commits and pull requests of the selected time span as the activity stream with links to associated Jira issues, subtasks, and backlogs.
Hemanth Dharavath, Apptium
Apptium Technologies, our customer, is a technology and management consulting company that helps global broadband, wireline, and wireless communications service providers boost their productivity. This company has offices in the USA, Canada, and India.
The team of Apptium Technologies actively uses Atlassian Bitbucket for team collaboration. This way they can build and ship software to their clients that use Apptium application as Platform as a service (PAAS). They decided to extend the Bitbucket Server functionality by installing our Awesome Graphs app.
In fact, our customer has around 25 projects going parallel. Each project has its own dev, QA, production environments with around 15 repositories. All team members use the Awesome Graphs app to track and monitor their projects and repositories with visualized statistics.
Let’s see what features and capabilities of this app the Apptium team uses most.
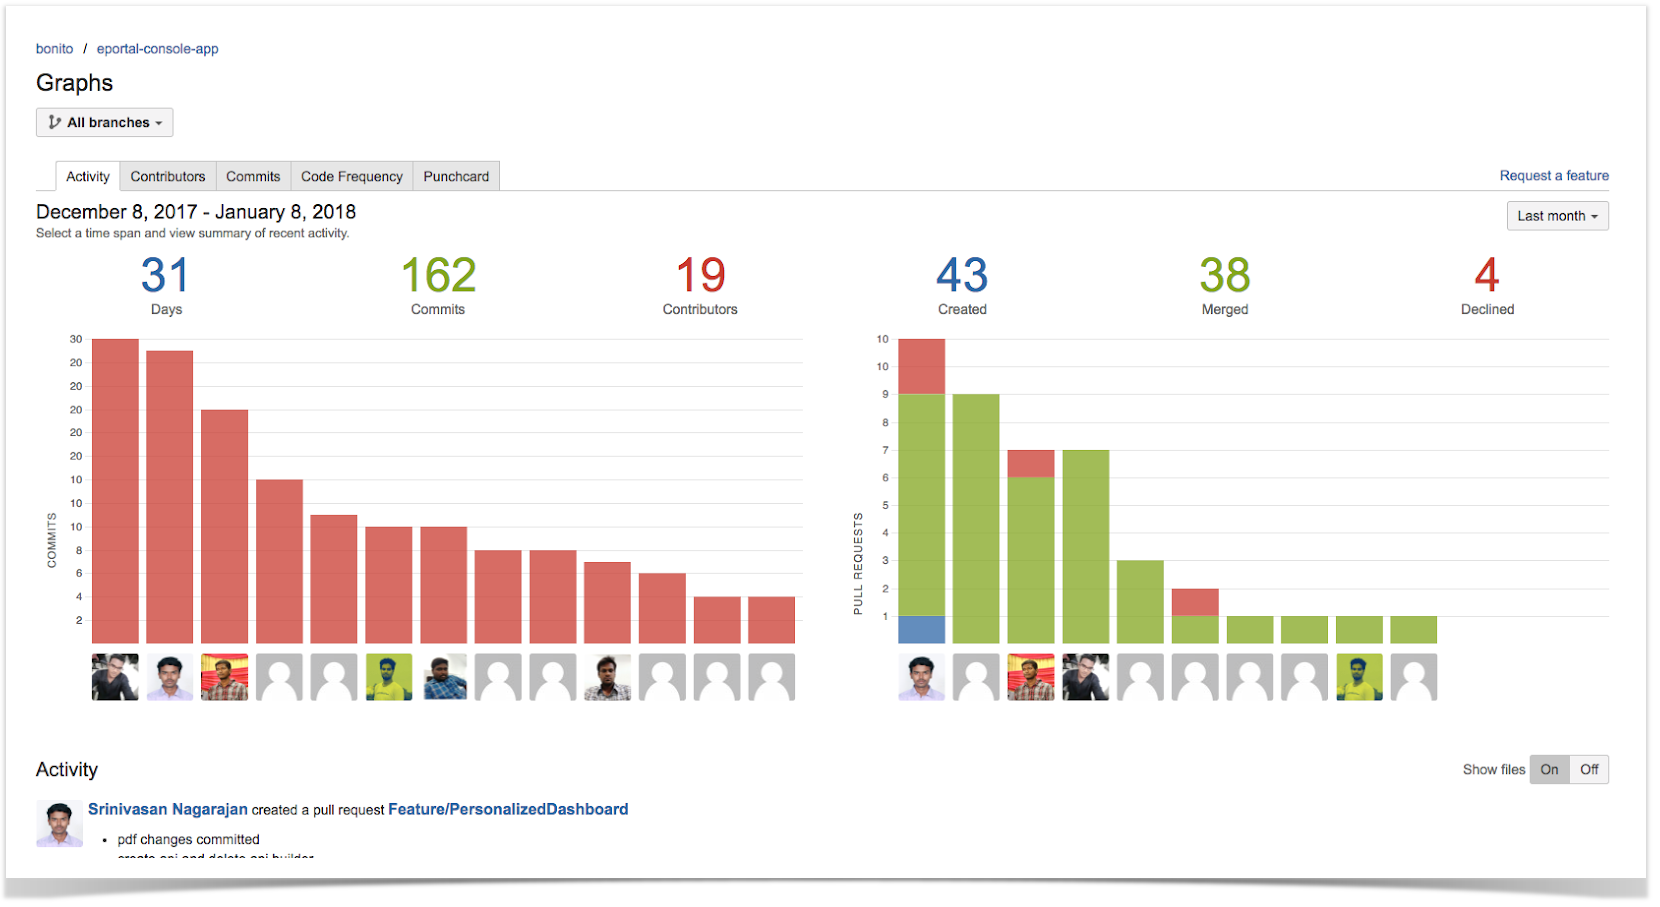
Activity tracking and reporting
As an Agile software development team, Apptium wants to track down issues and daily updates of the tasks assigned in their sprints. For instance, to achieve this goal, they use the Activity graph. It shows the existing commits and pull requests through the selected time span at the project level, featuring activity in all project repositories.
Moreover, our client can also check the activity stream with the links to the associated Jira issues, sub-tasks, and backlogs. This way, they can easily track daily updates for their current Jira tasks.
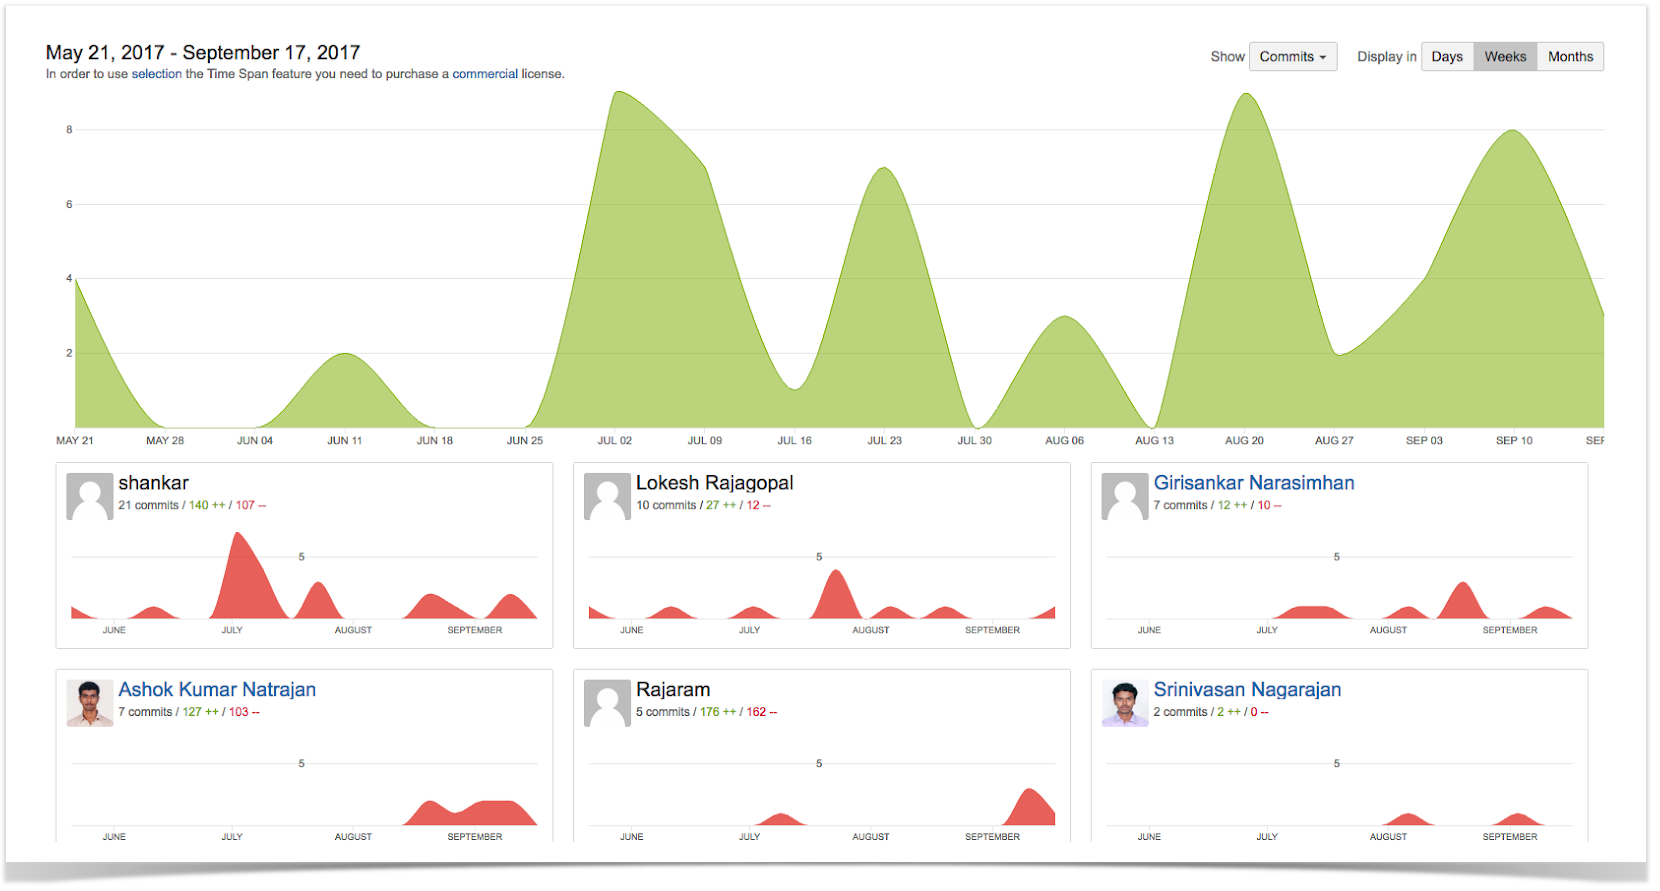
Contribution tracking
The Contributors graph helps the Apptium team to evaluate the code committed by each person in a sprint. They can compare the input from different team members with a help of a summary graph of the contributions made by all developers. In addition, they evaluate the number of commits and lines of code added and deleted by each developer.
Using this graph, the Apptium team can monitor the team’s performance and analyze the critical points throughout the year.
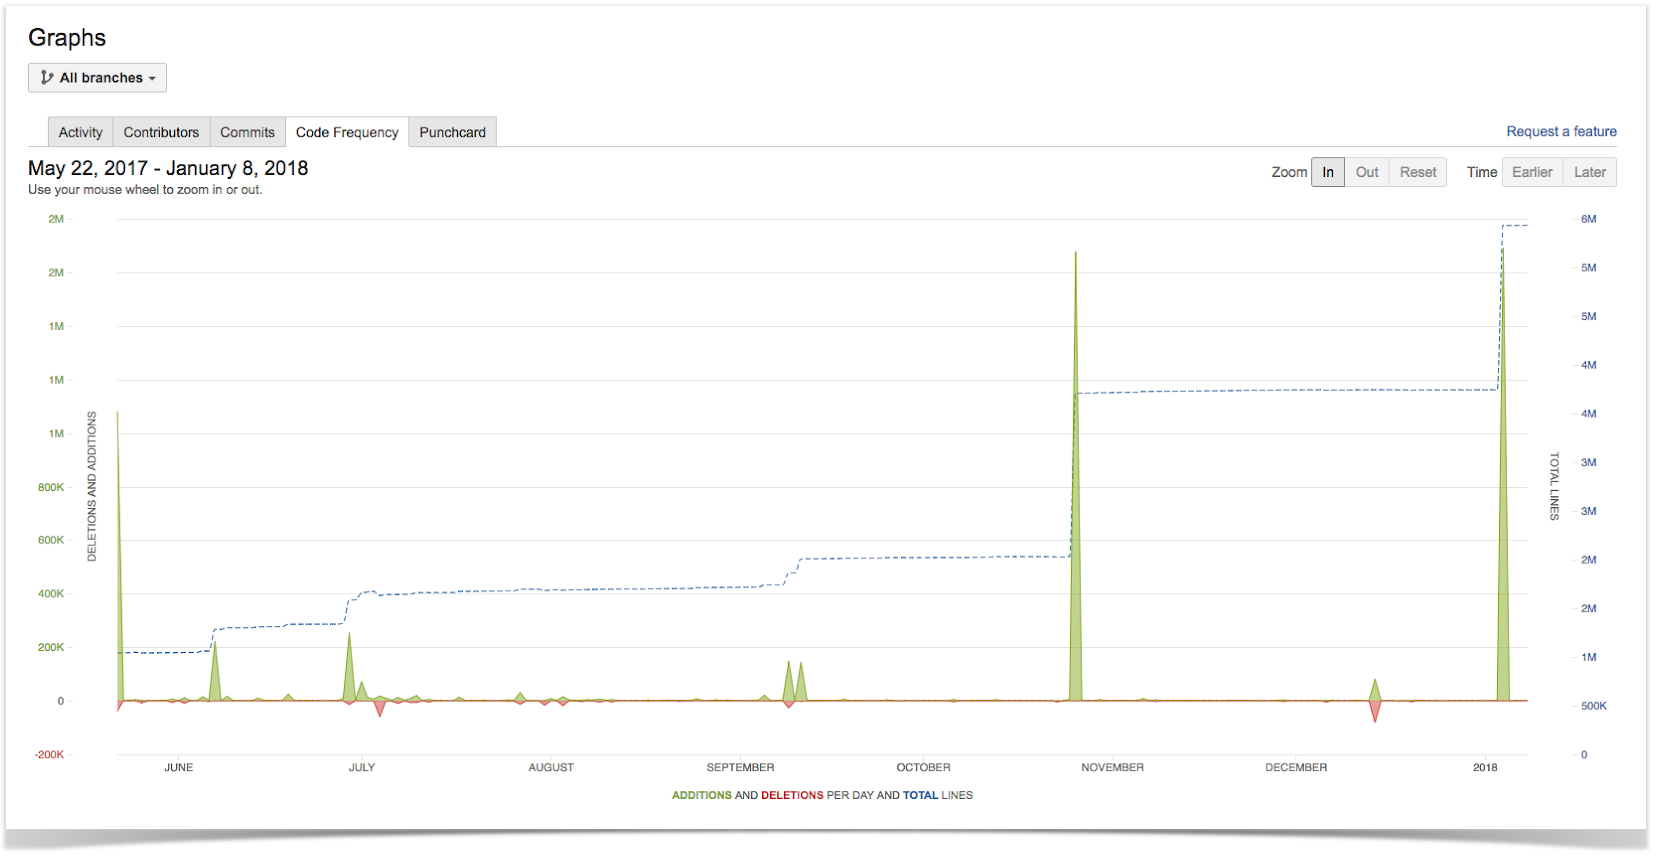
Code quality analysis
The Code Frequency graph allows Apptium to evaluate the project history and code quality. The team members can watch the dynamics of their projects in terms of lines of code.
As a result, the Apptium team can have a birds-eye view of the whole project from its start to the current week in one graph.
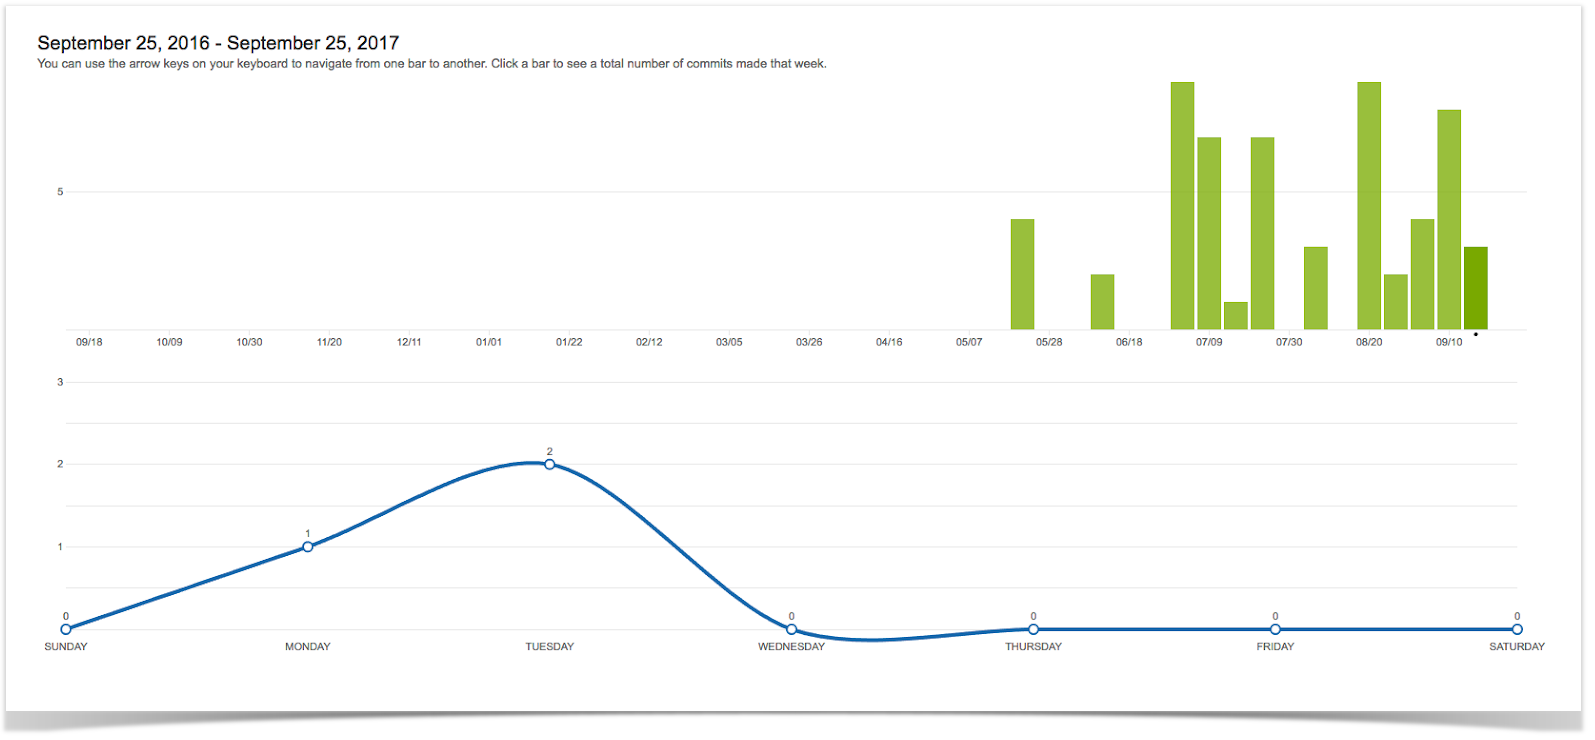
Commit frequency evaluation
Apptium Technologies also uses the Commits graph to pull out the report on commits made to repositories every week (each bar represents one week). So they can compare their estimates with the real work done and plan their work on the projects ahead.
This useful graph provides our client with an overview of their team activity.
Challenges and benefits
Awesome Graphs for Bitbucket allowed the customer to get the detailed visualized statistics of their team performance and address the following challenges:
analyze the critical points along the year
track activity and progress of the team
watch their projects evolve
capture trends and identify bottlenecks
Apptium Technologies now can rapidly evaluate the performance of their development, QA, and production teams. The insights they receive using our handy tool definitely help them deliver the best service to their customers all over the world.
Read more case studies to see how our customers benefit from using Awesome Graphs for Bitbucket in their work:
We use cookies on our website to give you the most relevant experience by remembering your preferences and repeat visits. By clicking “Accept All”, you consent to the use of ALL the cookies. However, you may visit "Cookie Settings" to provide a controlled consent.
We use necessary cookies to optimize our site. We’d also like to set performance cookies that help us make improvements by measuring how you use the site.
By clicking “Accept all”, you voluntarily agree to the data processing mentioned.
The cookies collect information in a way that does not directly identify anyone. For more information on how these cookies work please see our ‘Cookies policy’.
Necessary cookies are used for activities that are strictly necessary to operate or deliver the service you requested from us and, therefore, do not require you to consent. They enable core functionality such as security, network management, and accessibility.
Performance cookies enable improved functionality and personalization and help us measure traffic and analyze your behavior with the goal of improving our service. This means that our services may not work properly if they are disabled.