How to Search for Commits in Bitbucket Server and Data Center

April 1, 2023
#Reporting#Analytics#How To#Bitbucket
14 min

Bitbucket has greatly improved the development workflow of teams and companies that use Git with its friendly interface and features. However, sometimes it lacks opportunities for convenient work with commits. Have you ever wasted time scrolling the mouse wheel trying to find some of the old commits? Luckily, there are some ways to make your life easier and search for commits in Bitbucket. In this article, you will learn how to find:

  • projects and repositories in your Bitbucket that a certain user contributed to (filter by author)
  • commits that were made long ago to a repository with high activity (filter by time)
  • the commits of a user made to a repository or project (filter by author and project/repo)
  • all the commits made to a project (filter by project).

We’ll also show you how to automate the process using the Bitbucket REST API, as well as the Awesome Graphs REST API and the Export to CSV feature.

Sourcetree search opportunities

Sourcetree is an Atlassian desktop client for working with Git and Mercurial repositories. It provides an opportunity to search for commits by an author, a commit message, and a file.

search for commits by an author, a commit message, and a file in Sourcetree

Its user-friendly interface helps find commits easier, but it’s impossible to look at them for all repositories at once as you need to go to each repo manually. Besides, it needs to be installed on each computer separately and is not available for Linux.

Use Awesome Graphs to search commits in Bitbucket

Awesome Graphs for Bitbucket helps engineering leaders and software teams improve their processes and deliver products faster by transforming invisible development activities into easy-to-understand insights and reports. Convenient search for commits isn’t its main purpose, but a nice bonus.

This app indexes information about commits, which makes searching by author, time, or repository faster and does not affect even huge Bitbucket instances (70,000+ repositories).

The Contributions graph shows the activity of each developer during a year as a calendar. So it’s an easy way to find all the commits made by a person to all projects and repositories. Here you can also filter the commits of a particular user by time period (up to a year) and by project or repository.

Below the calendar, there is a list of all commits and pull requests made during the selected time span. By default, it’s a year, but it’s possible to choose any period to display.

In order to find the commits made to a certain repository regardless of their author, use the Activity graph. It shows all commits for the last year or a shorter time span in the Activity section below the charts.

And if you need to find commits made long ago, the Top Committers Report can be a good solution. In general, its use-case is to find the most active contributors of the project or repository, but you can configure the Period of time and choose Authors of the commits you’re searching for.

As a result, it shows the list of all commits for the selected time span in the Activity section below as well as their distribution in time.

Export commit data to CSV

Awesome Graphs for Bitbucket also gives you the capability to export commit data to CSV in different ways. As a result, you’ll get a list of commits with their details:

To export raw commit data to CSV directly from Bitbucket, you need to go to the People page. There you’ll notice the Export menu at the top-right corner, where you can choose CSV.

Another way to export commit data to CSV is to use the Awesome Graphs REST API, which allows you to automate the processes and retrieve this data easier using the dedicated resources.

You can access the in-app documentation (accessible to Awesome Graphs’ users) by choosing Export → REST API on the People page or go to our documentation website.

Search for commits in Bitbucket via REST API

Bitbucket REST API provides a possibility to get the list of all commits in the repository using this request.

https://example.com/rest/api/1.0/projects/exampleprojectkey/repos/example-repository-slug/commits

The request can be extended by specific parameters to receive a more accurate result. For instance, since and until options help to get the commits made after or before a certain commit, or between two commits defined by their IDs. Merges parameter controls how to handle merge commits – exclude merge commits, include both merge commits and non-merge commits, or only return merge commits.

https://example.com/rest/api/1.0/projects/exampleprojectkey/repos/example-repository-slug/commits?merges=exclude&since=ea3eea9dcbd&until=f4240bf022a

As a result, you receive a JSON response with the list of the commits and their IDs, author’s names and email addresses, commit messages, and parents.

{
    "values": [
        {
            "id": "f4240bf022a69815241a883c03645444b58ac553",
            "displayId": "f4240bf022a",
            "author": {
                "name": "Max Desiatov",
                "emailAddress": "max@desiatov.com"
            },
            "authorTimestamp": 1557113671000,
            "committer": {
                "name": "Tomer Doron",
                "emailAddress": "tomer@apple.com"
            },
            "committerTimestamp": 1557113671000,
            "message": "Add internal section link to README.md (#71)",
            "parents": [
                {
                    "id": "ea3eea9dcbd46887d846696261f54b3d2f74fecd",
                    "displayId": "ea3eea9dcbd"
                }
            ]
        },

Alternatively, you can use the Awesome Graphs REST API that provides global, user, project, and repository data. The solution allows you to retrieve data faster while decreasing the load on the instance compared to Bitbucket REST API. 

Use this request to get a list of commits from the specified repository.

https://example.com/rest/awesome-graphs-api/latest/projects/exampleprojectkey/repos/example-repository-slug/commits

The response will look as follows:

{
  "values": [
    {
      "user": {
        "emailAddress": "yorlov@stiltsoft.com",
        "displayName": "Administrator",
        "name": "admin"
      },
      "author": {
        "displayName": "admin",
        "emailAddress": "yorlov@stiltsoft.com"
      },
      "authorTimestamp": "2020-03-05T22:58:18Z",
      "linesOfCode": {
        "added": 1,
        "deleted": 0
      },
      "parents": [],
      "repository": {
        "slug": "Commit Hook",
        "name": "commit-hook",
        "project": {
          "key": "TESTCONTAINERS",
          "name": "Testcontainers",
          "type": "NORMAL"
        }
      },
      "id": "9f2e24a147bb8f5a5a3d10b692703cc5784df8b5"
    },
  ],
}

Learn more about the available REST API resources.

Find out what works best for you

We’ve described different ways to work with commits effectively:

  • Sourcetree as a free application that is suitable for searching among a small number of repositories.
  • Awesome Graphs for Bitbucket add-on as a tool with wide search opportunities and various analytical features.
  • Bitbucket REST API as a more advanced and technically demanding option.

Try them all and find the best solution!

You can also read how other teams benefit from using Bitbucket in a bundle with Awesome Graphs:


Related posts

    Analyze How Code Review is Going in Bitbucket Data Center

    September 27, 2021
    #Analytics#How To#Bitbucket
    9 min

    Awesome Graphs is one of our most popular apps. It’s a solution that extends Bitbucket, a platform that teams use to host Git repositories and collaborate on code.

    Awesome Graphs helps engineering leaders and software teams improve their own processes and deliver products faster by transforming invisible development activities into easy-to-understand insights and reports.

    One of the keys focuses of the app is the code review processes analytics. We would like to tell you which features support this use case and how you can benefit from the app. Keep reading if you are interested in:

    • Seeing how actively your team members review code
    • Analyzing what developers may need to improve their work patterns and who’s doing a great job
    • Learning what reviewers are most active and diligent
    • Knowing the average time taken to resolve pull requests.

    Code review analysis

    code review analysis in bitbucket

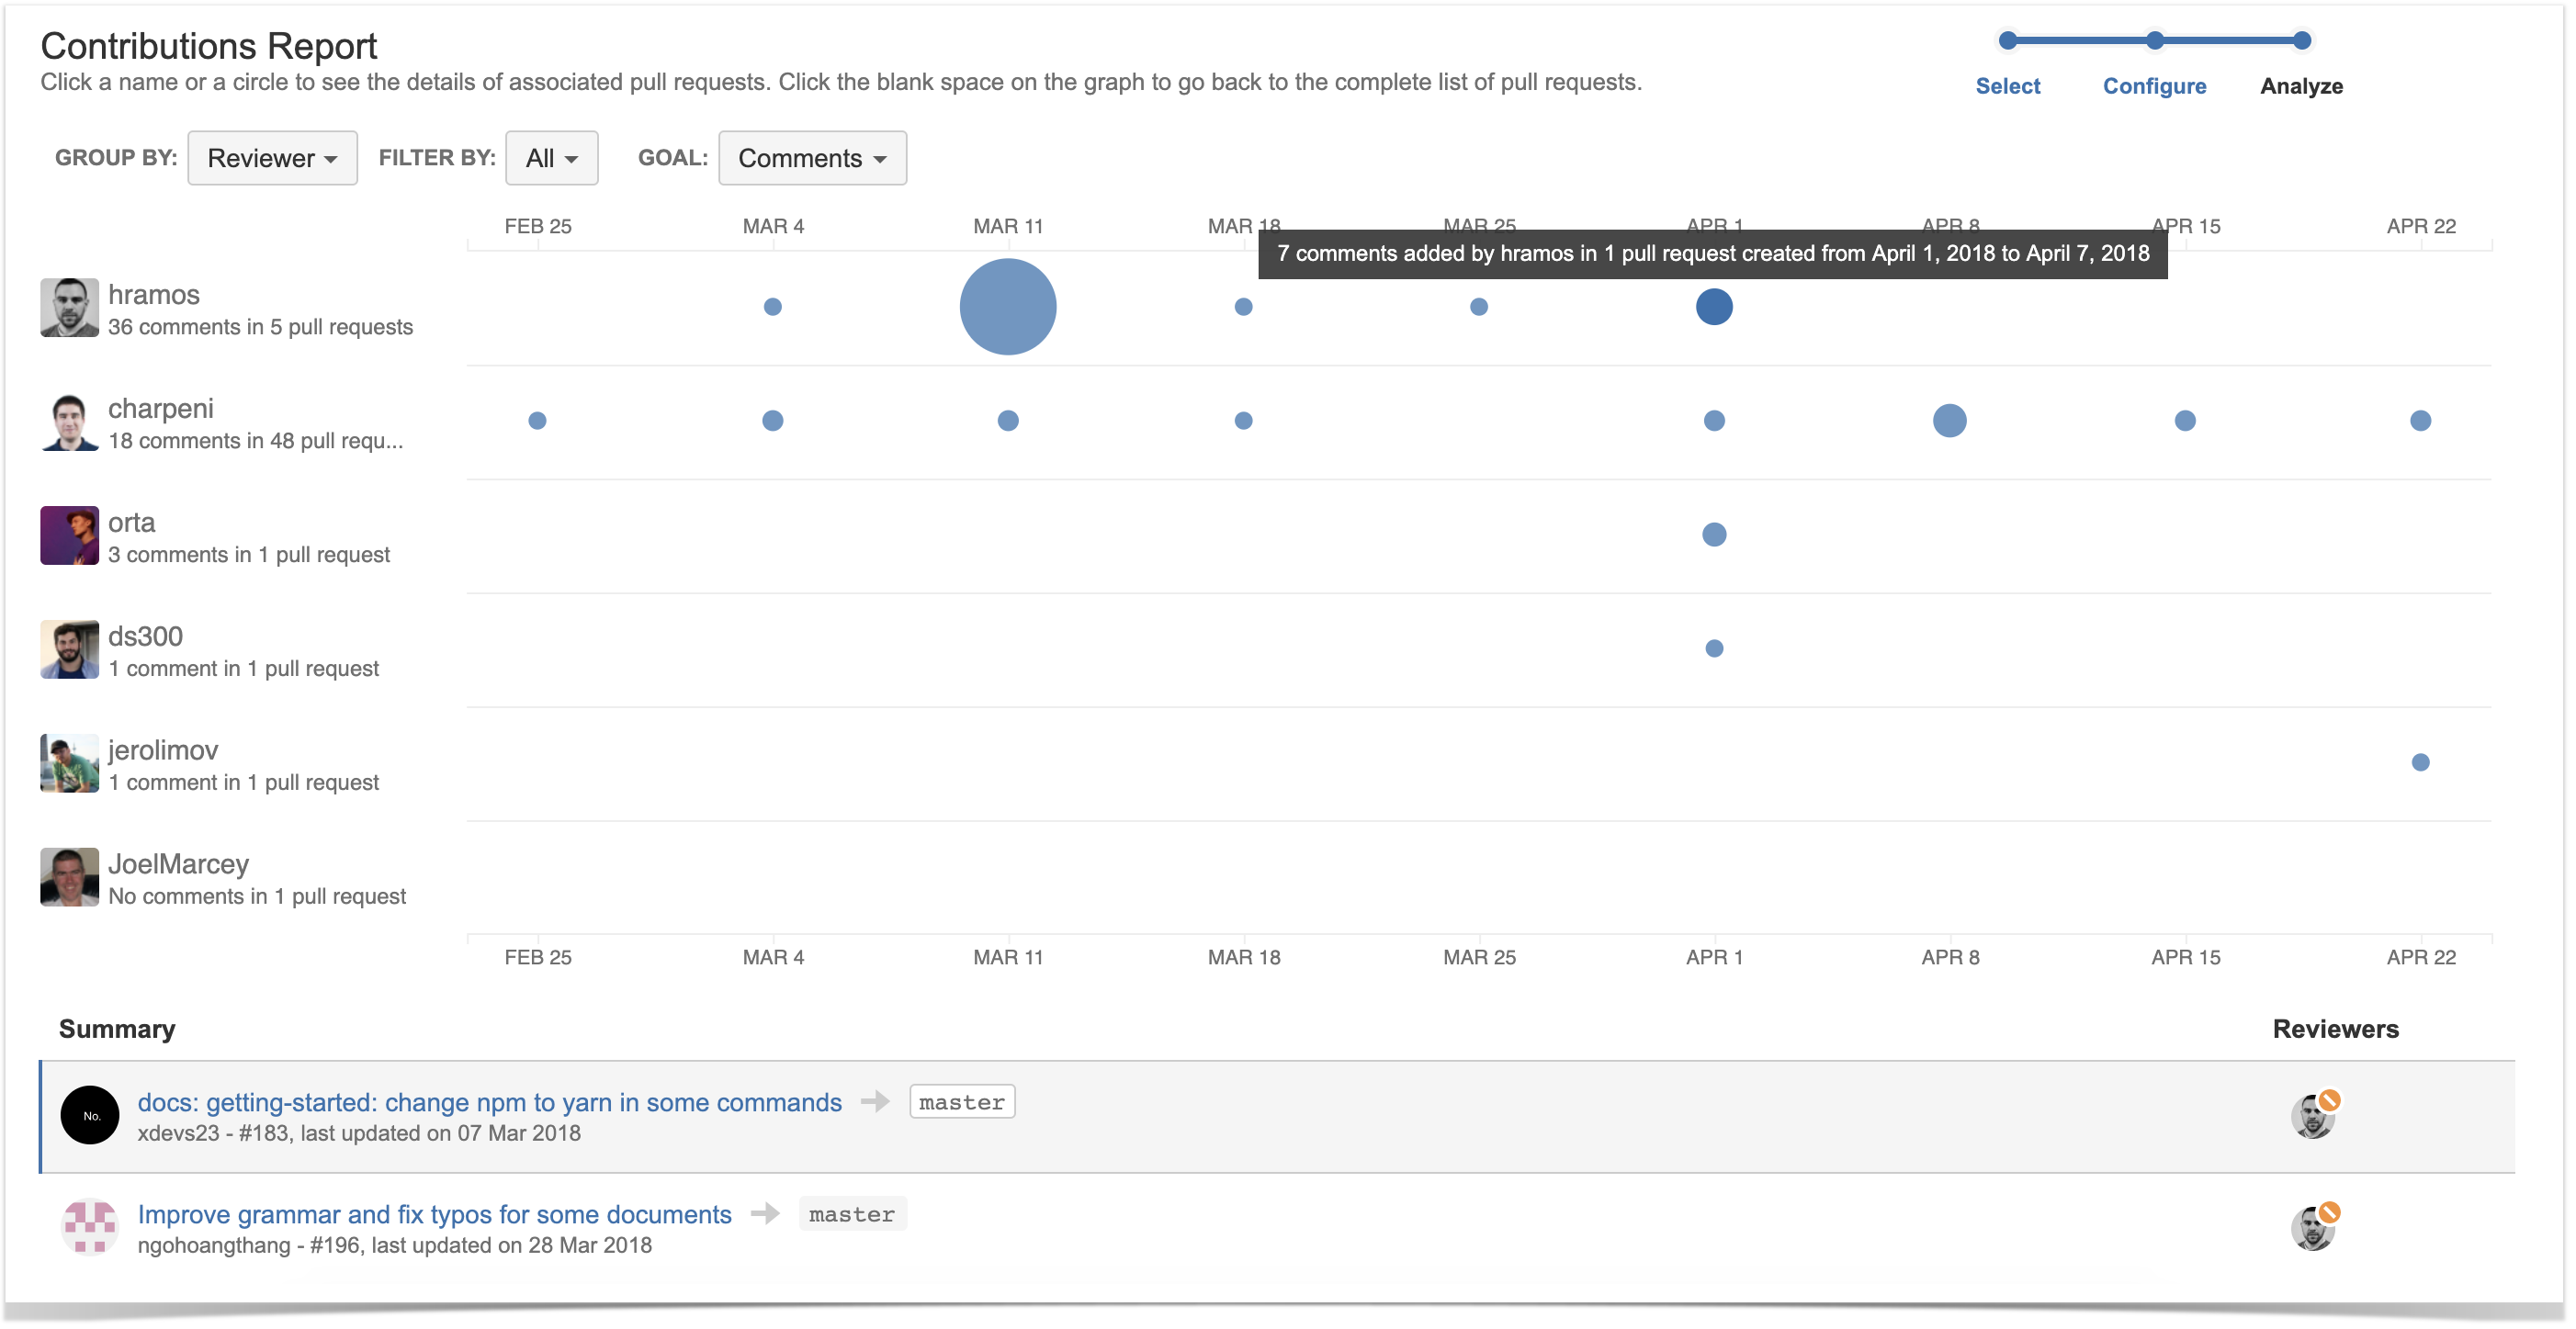
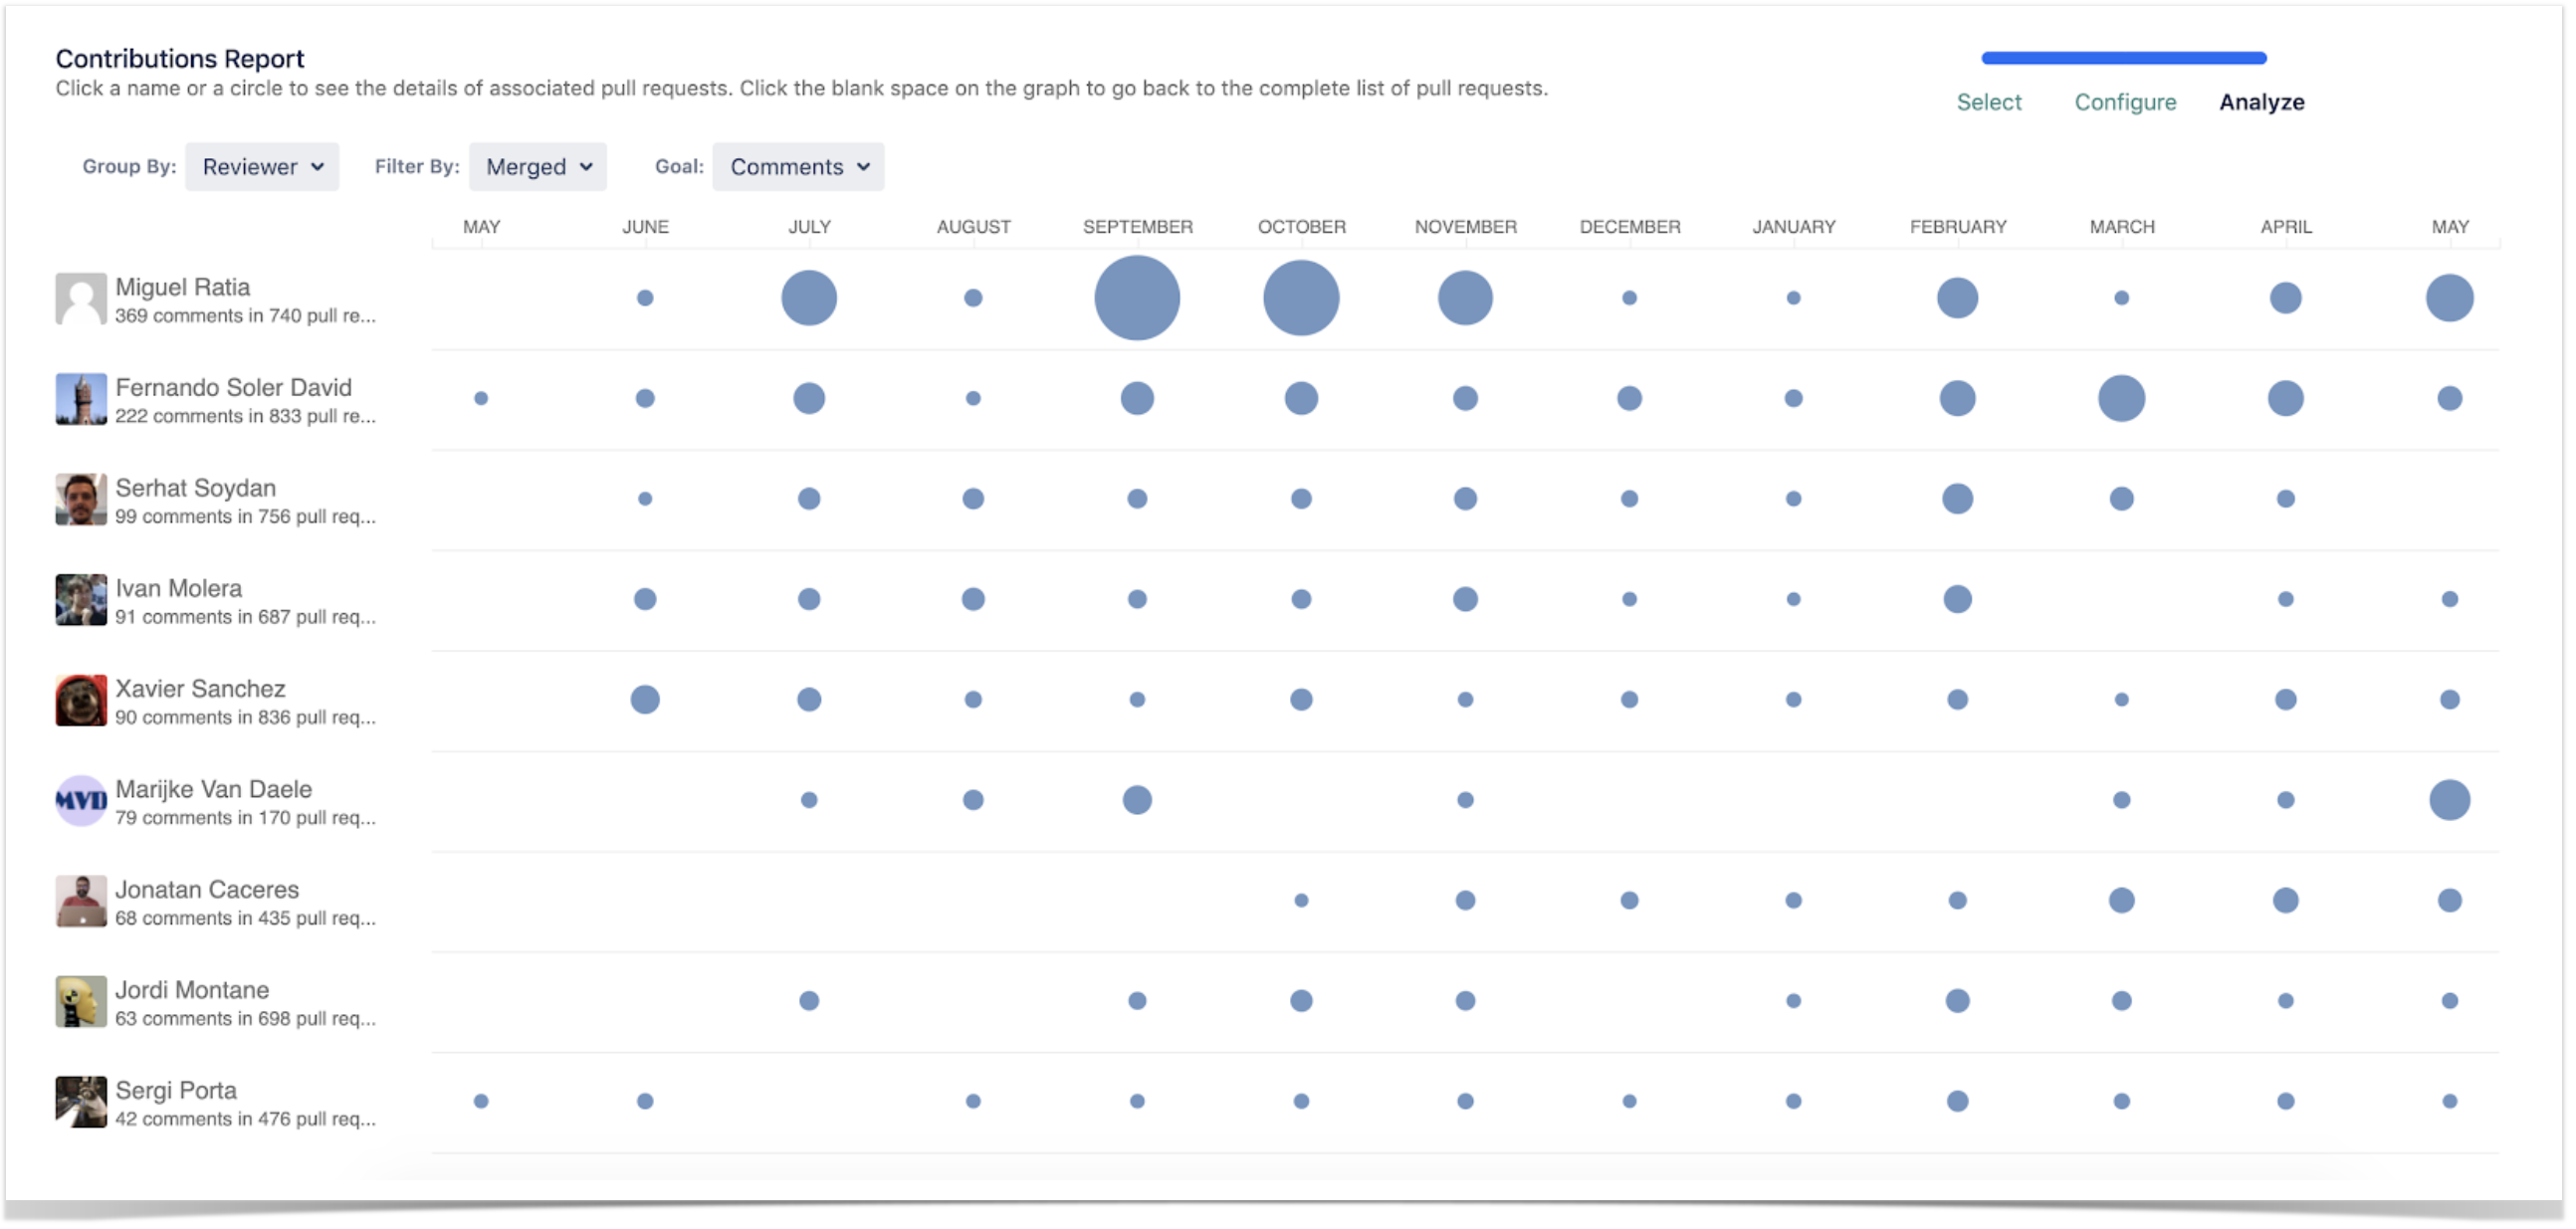
    The Contributions Report analyzes activity in pull requests (tasks, comments, needs work/approved/declined statuses). It helps you understand:

    • What developers create high-quality code and who might need to improve their approach to work. E.g. when an engineer has fewer taskscomments, and needs work flags in their pull requests, it suggests his work is approved as it is or with minor changes and he creates code of high quality.
    • What reviewers are thorough when they review the work of developers. E.g. diligent reviewers come up with suggestions and improvements, so they have more tasks and comments than others.
    • How the dynamics of code review changes over time. E.g. you can see if the number of pull requests with Needs work flags is getting bigger or smaller if the number of tasks in pull requests is increasing or decreasing over time.

    Learn more

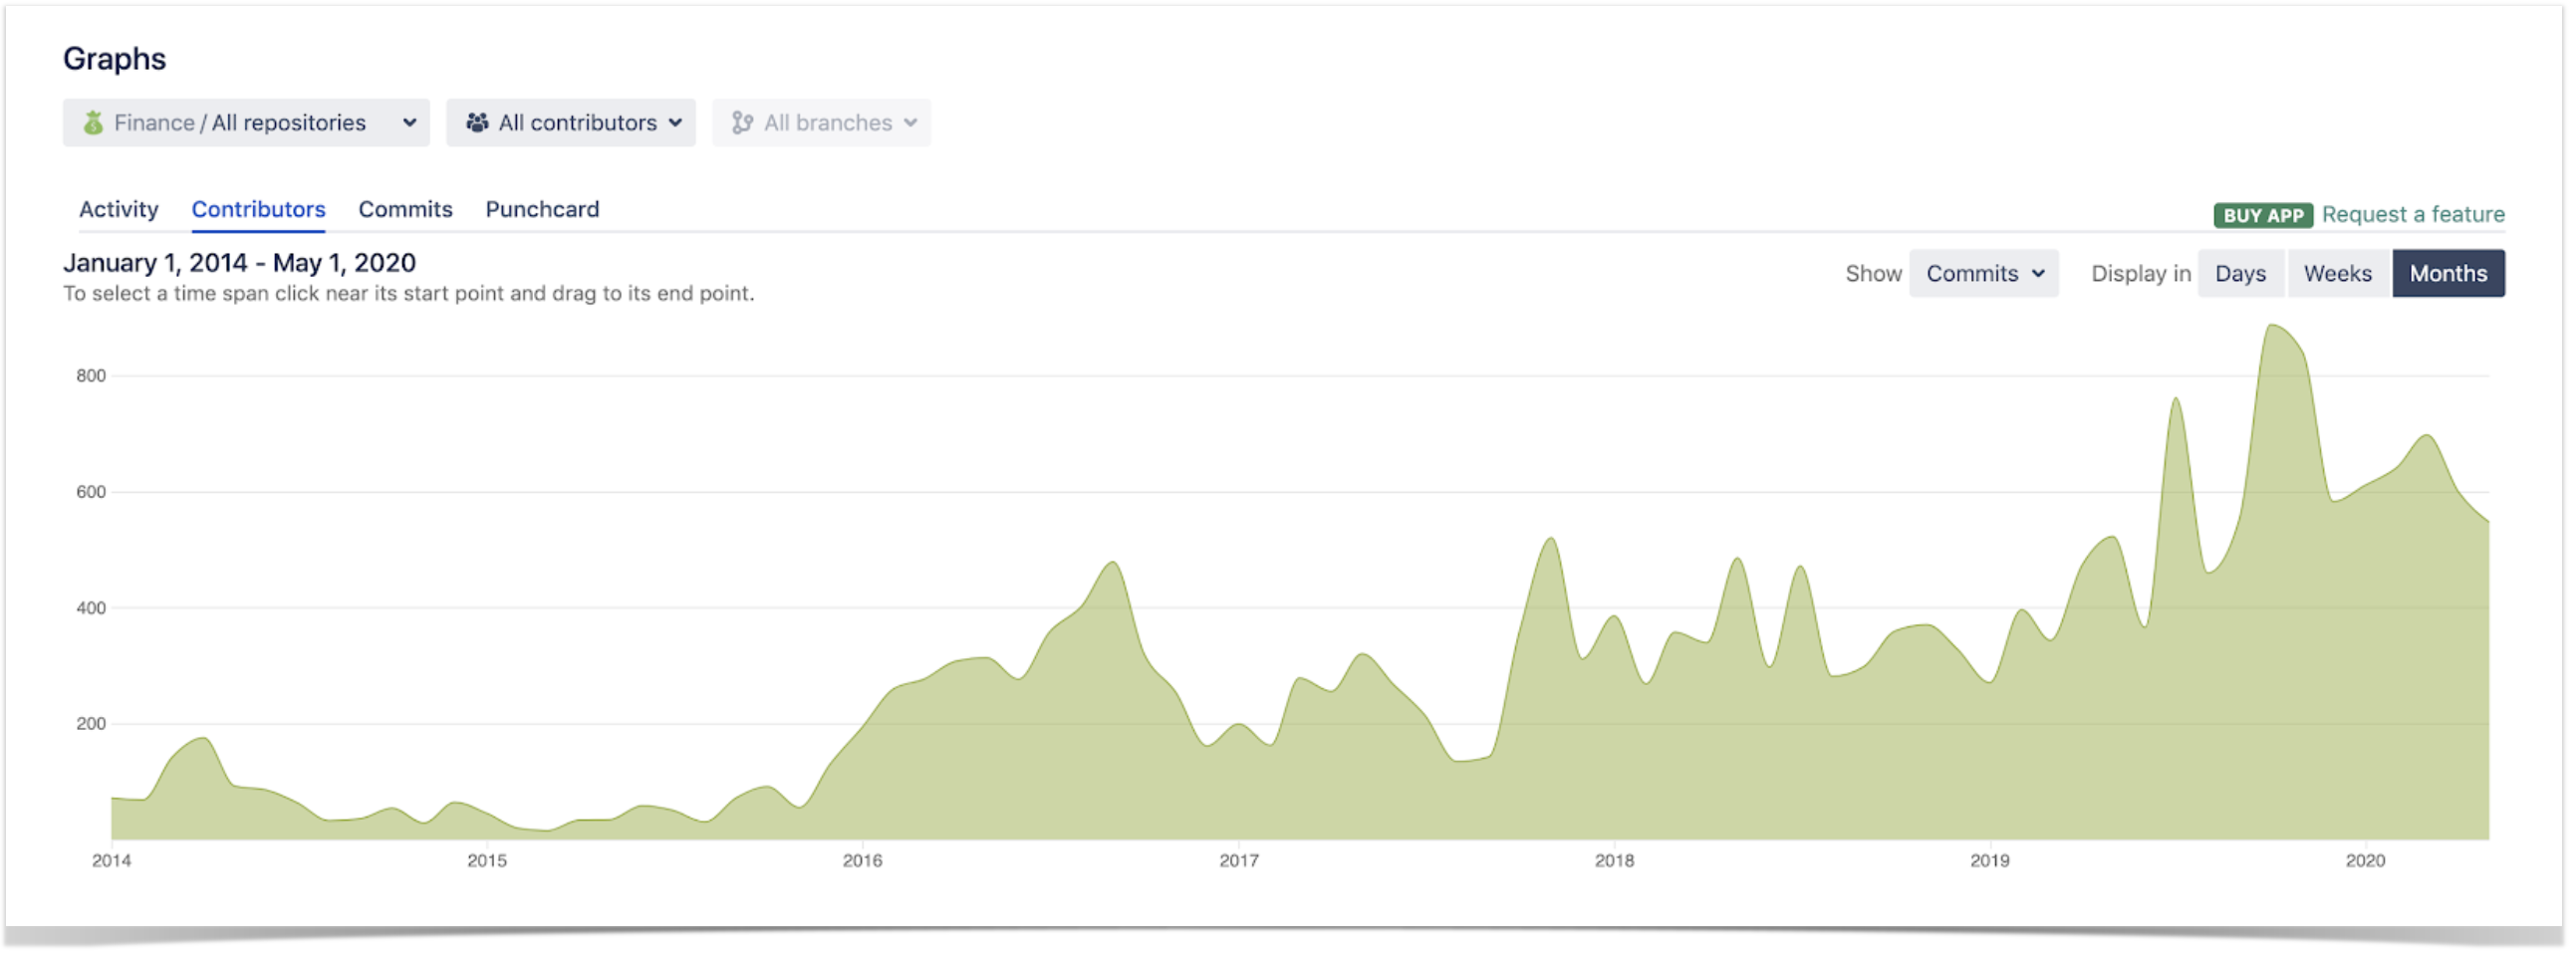
    The average time taken to resolve pull requests

    pull requests resolution time report in bitbucket

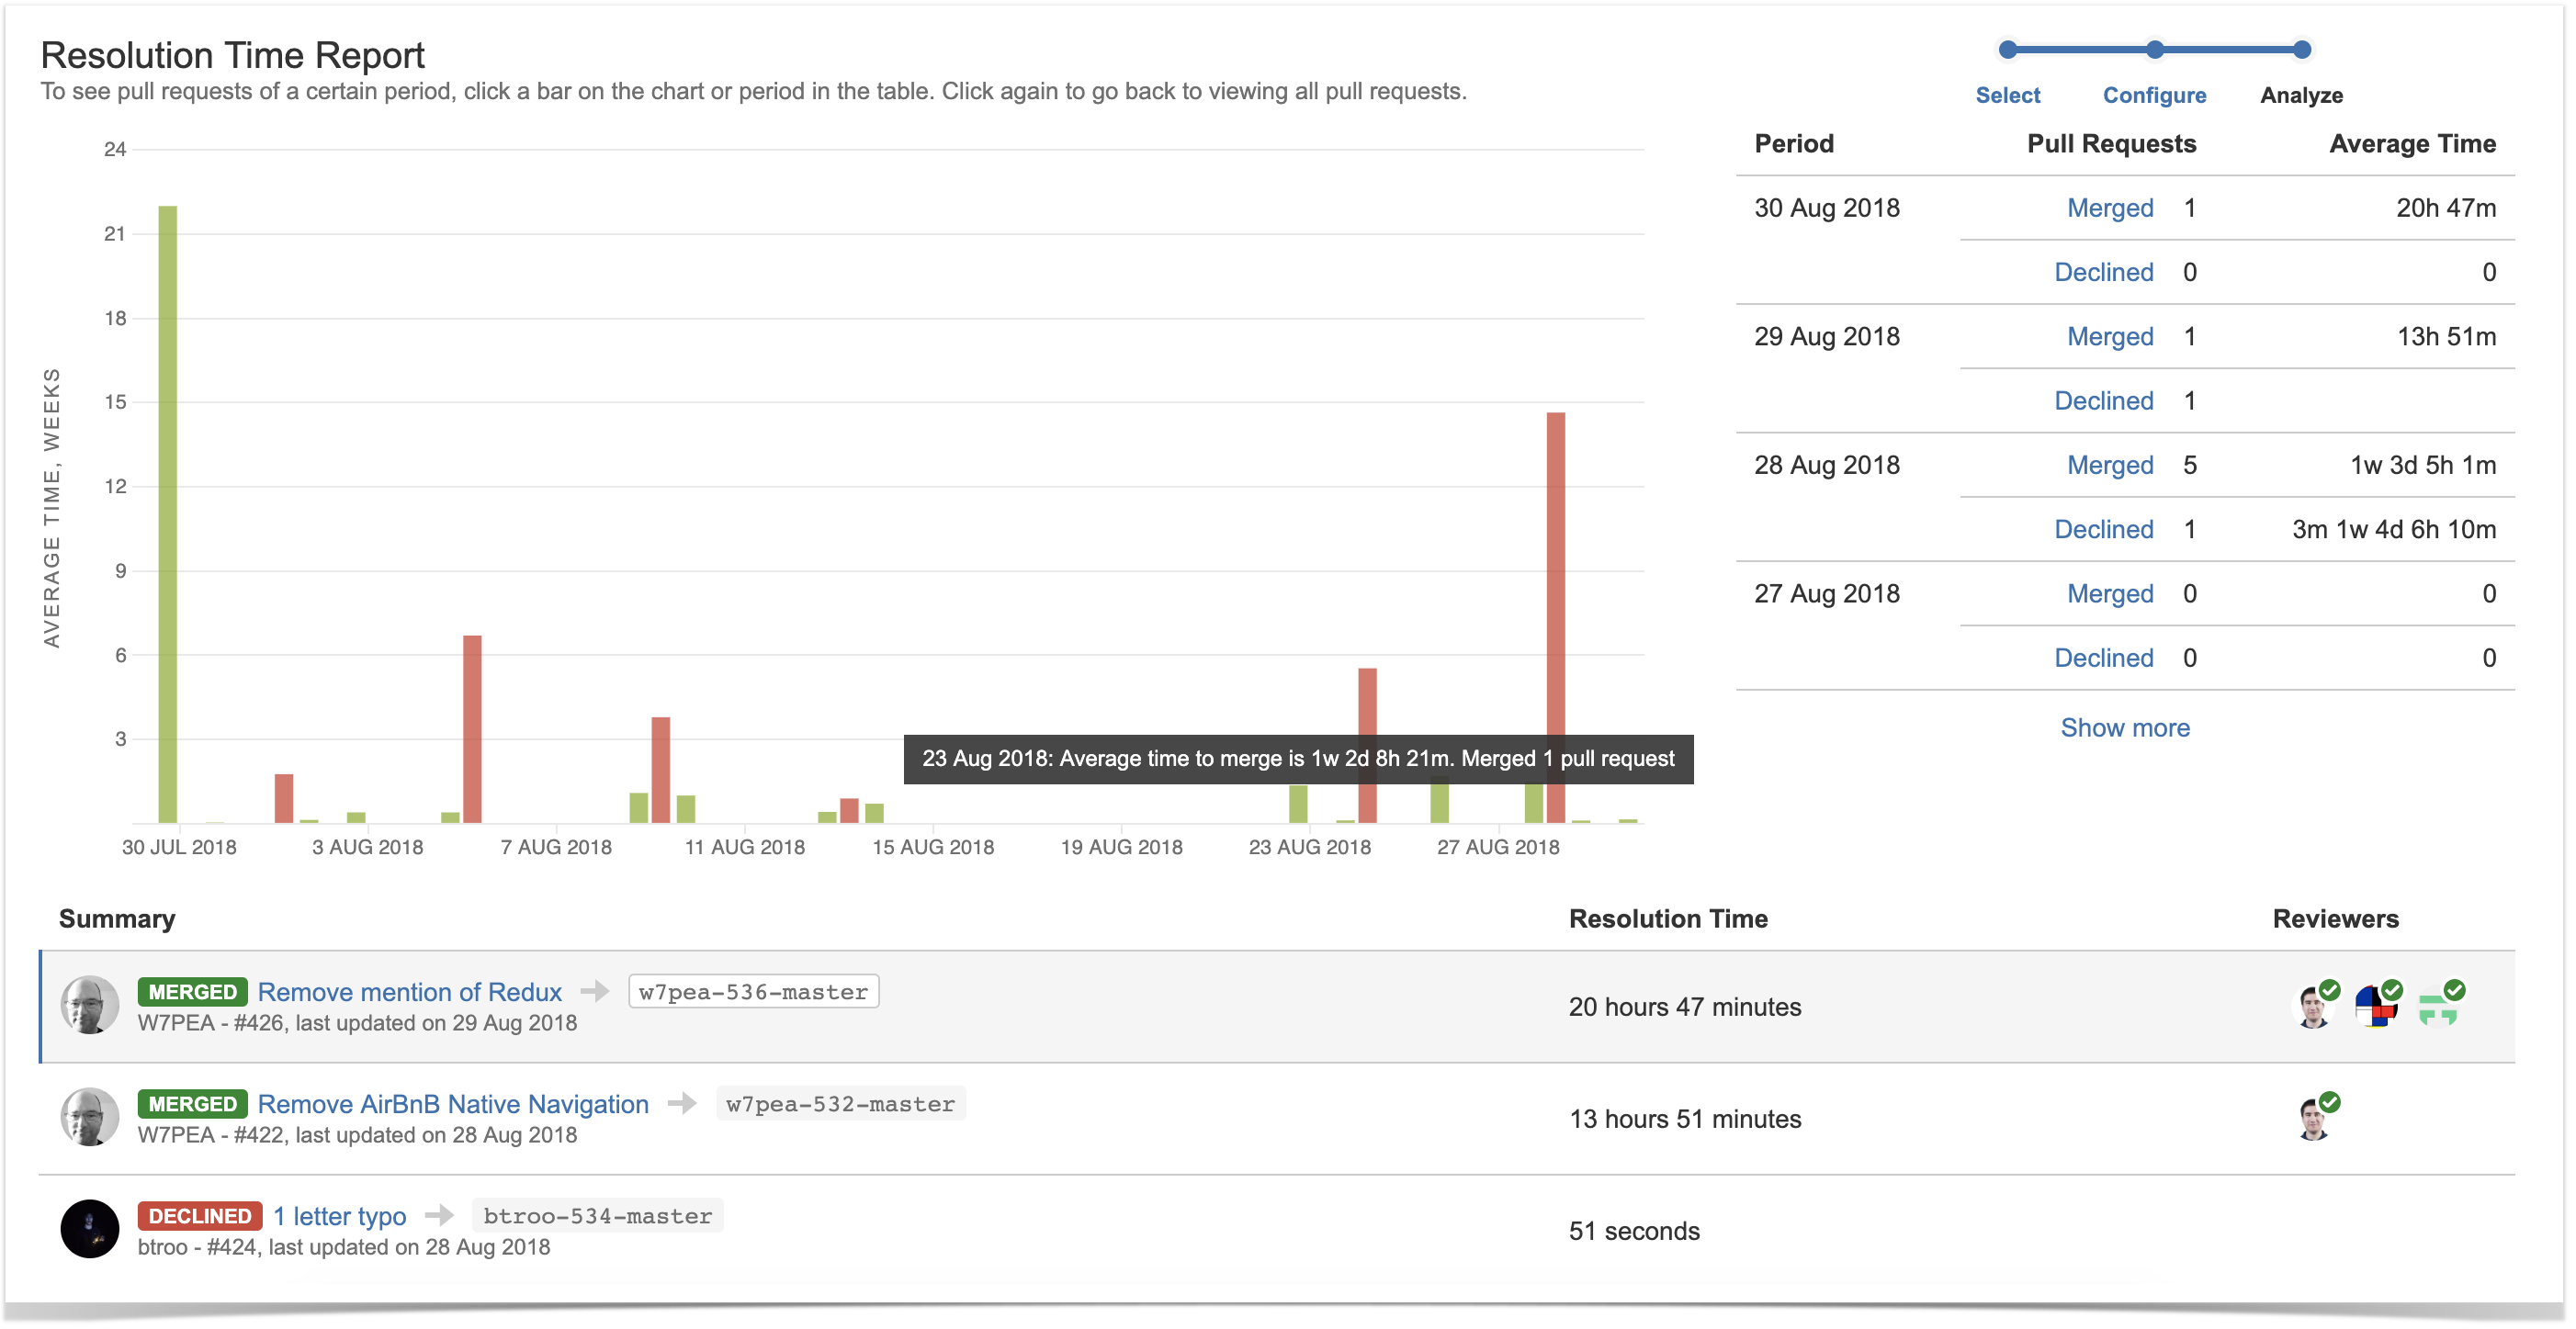
    Another report, Resolution Time Report, shows the average time taken to resolve pull requests. This is helpful to capture trends in resolution time. It displays resolution times of merged and declined pull requests separately. With this report you can:

    • Notice spikes in resolution time and then dive in to see what went wrong
    • See if an average resolution time is high for a long period of time – it can be a signal to look into your code review process and determine what causes delays
    • Monitor how changes in your processes affect the speed of code review.

    Learn more

    Knowledge sharing indicators

    reviewers of pull requests report in bitbucket

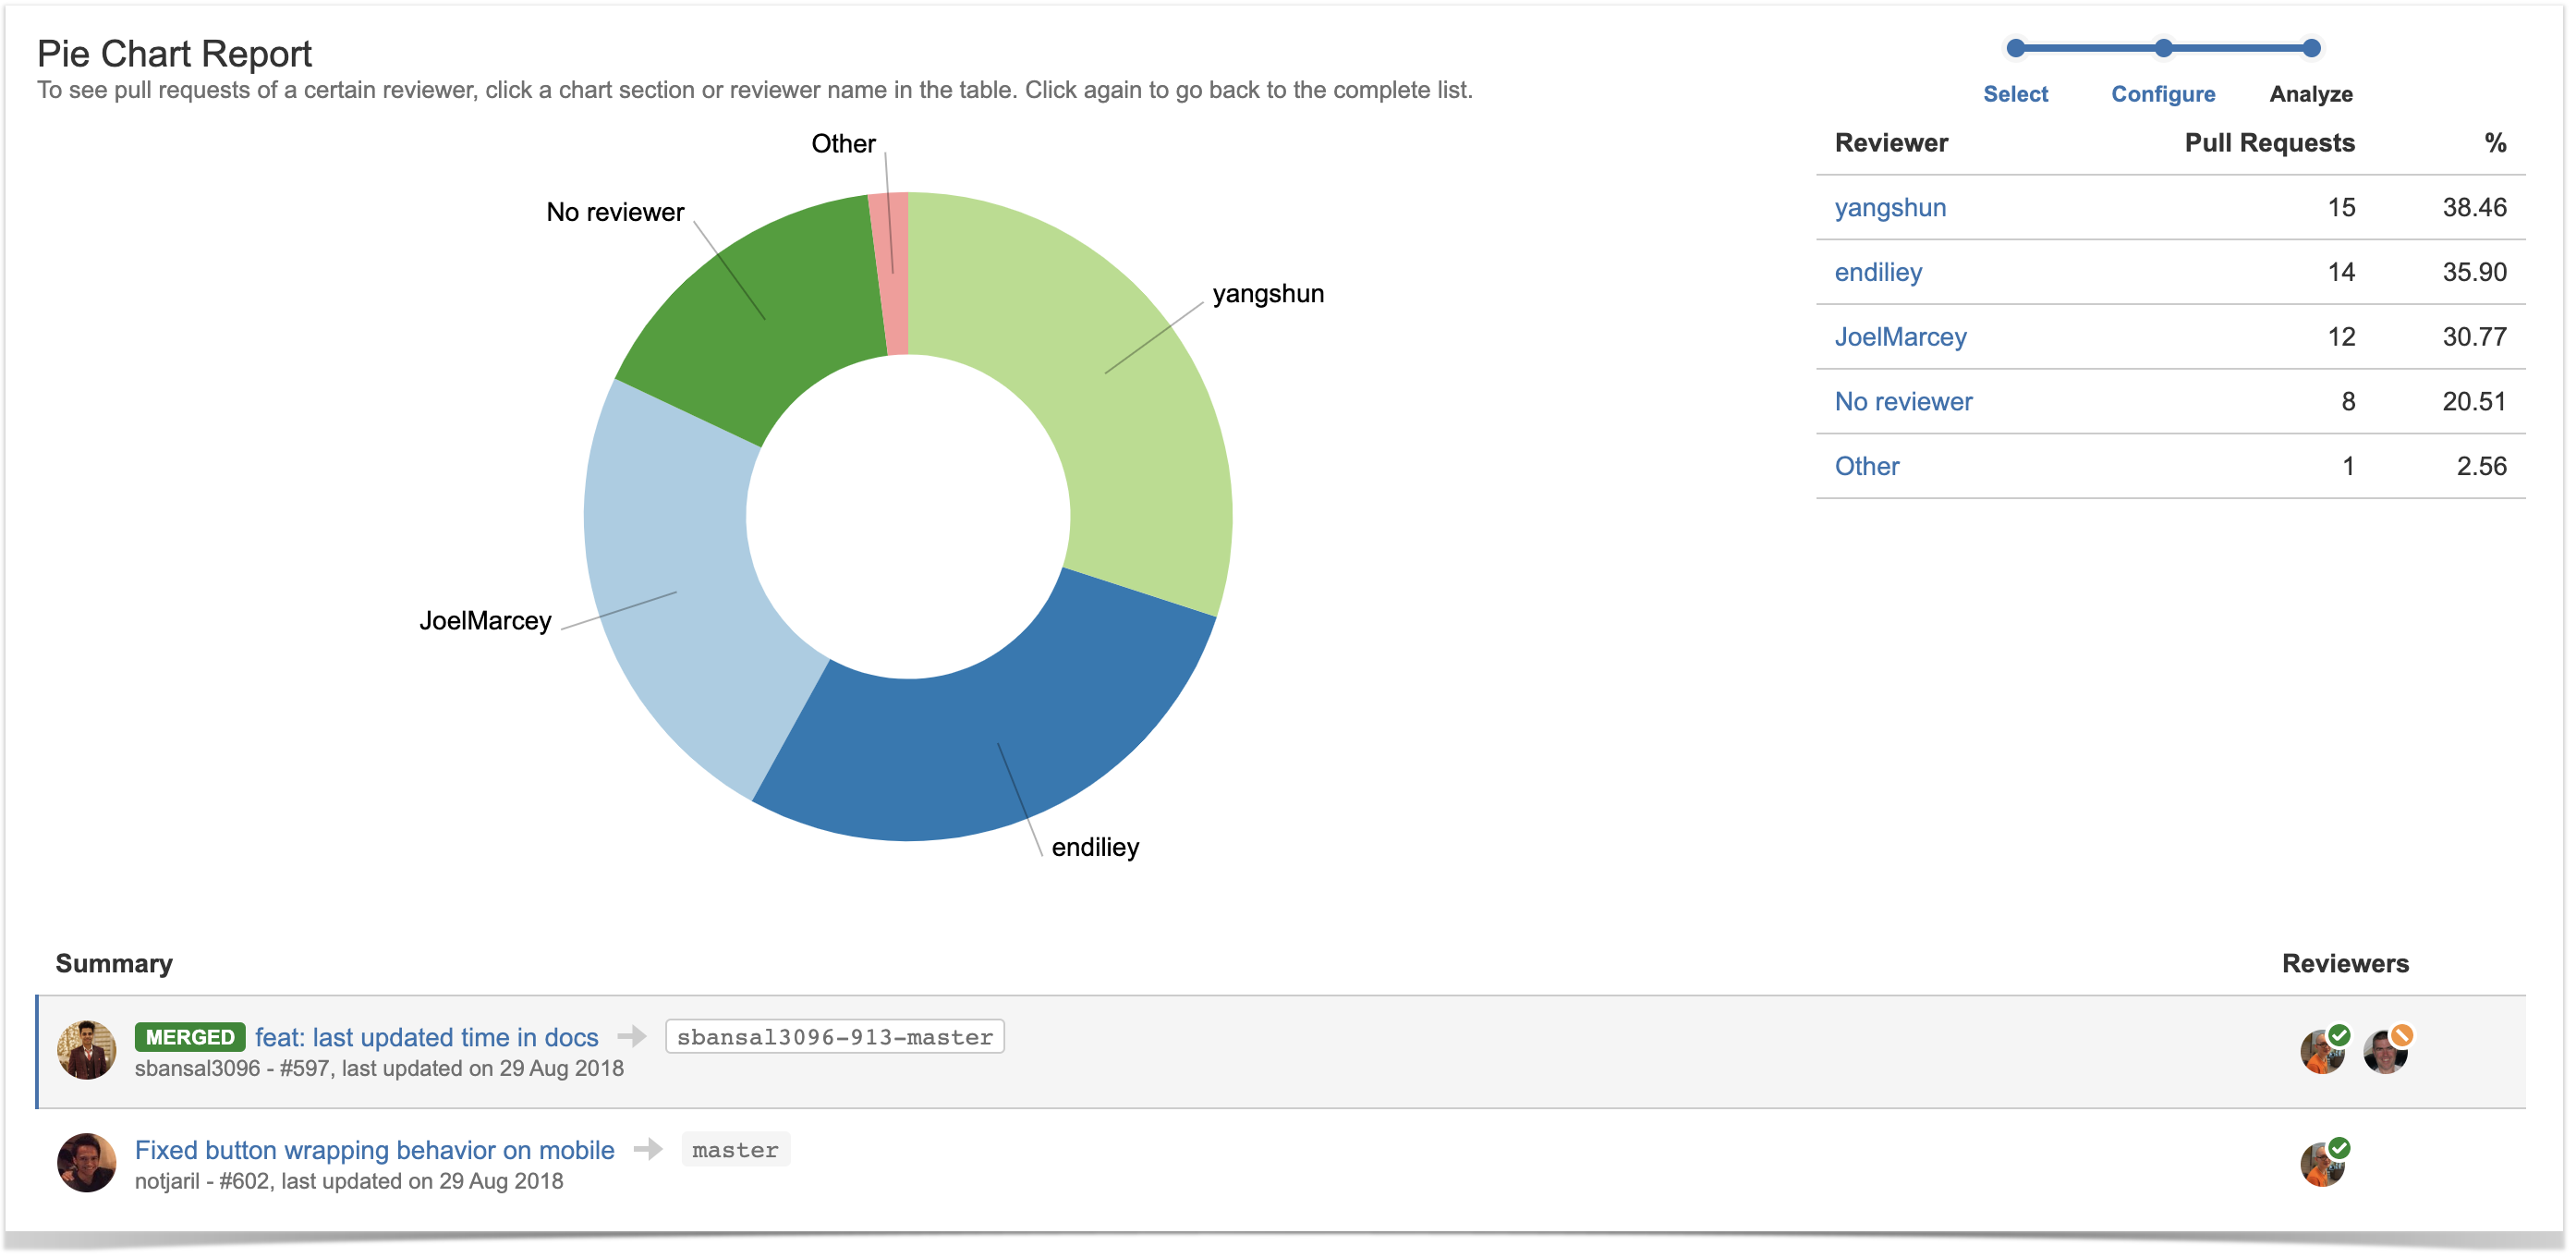
    The Pie Chart Report is a handy way to check if all developers in your team are involved in the code review. This report shows the breakdown of pull requests by different statistics types.

    Grouped by reviewer, the Pie Chart Report shows the following:

    • How many pull requests each person reviewed. These metrics help understand how much everyone contributes to the project.
    • Whether all people review code or there are one or two who are doing all job. This is an indicator of poor knowledge sharing.
    • Who is too busy reviewing all pull requests of their team. These people can become a bottleneck that slows the delivery time, because they’re not available for immediate review.

    Learn more

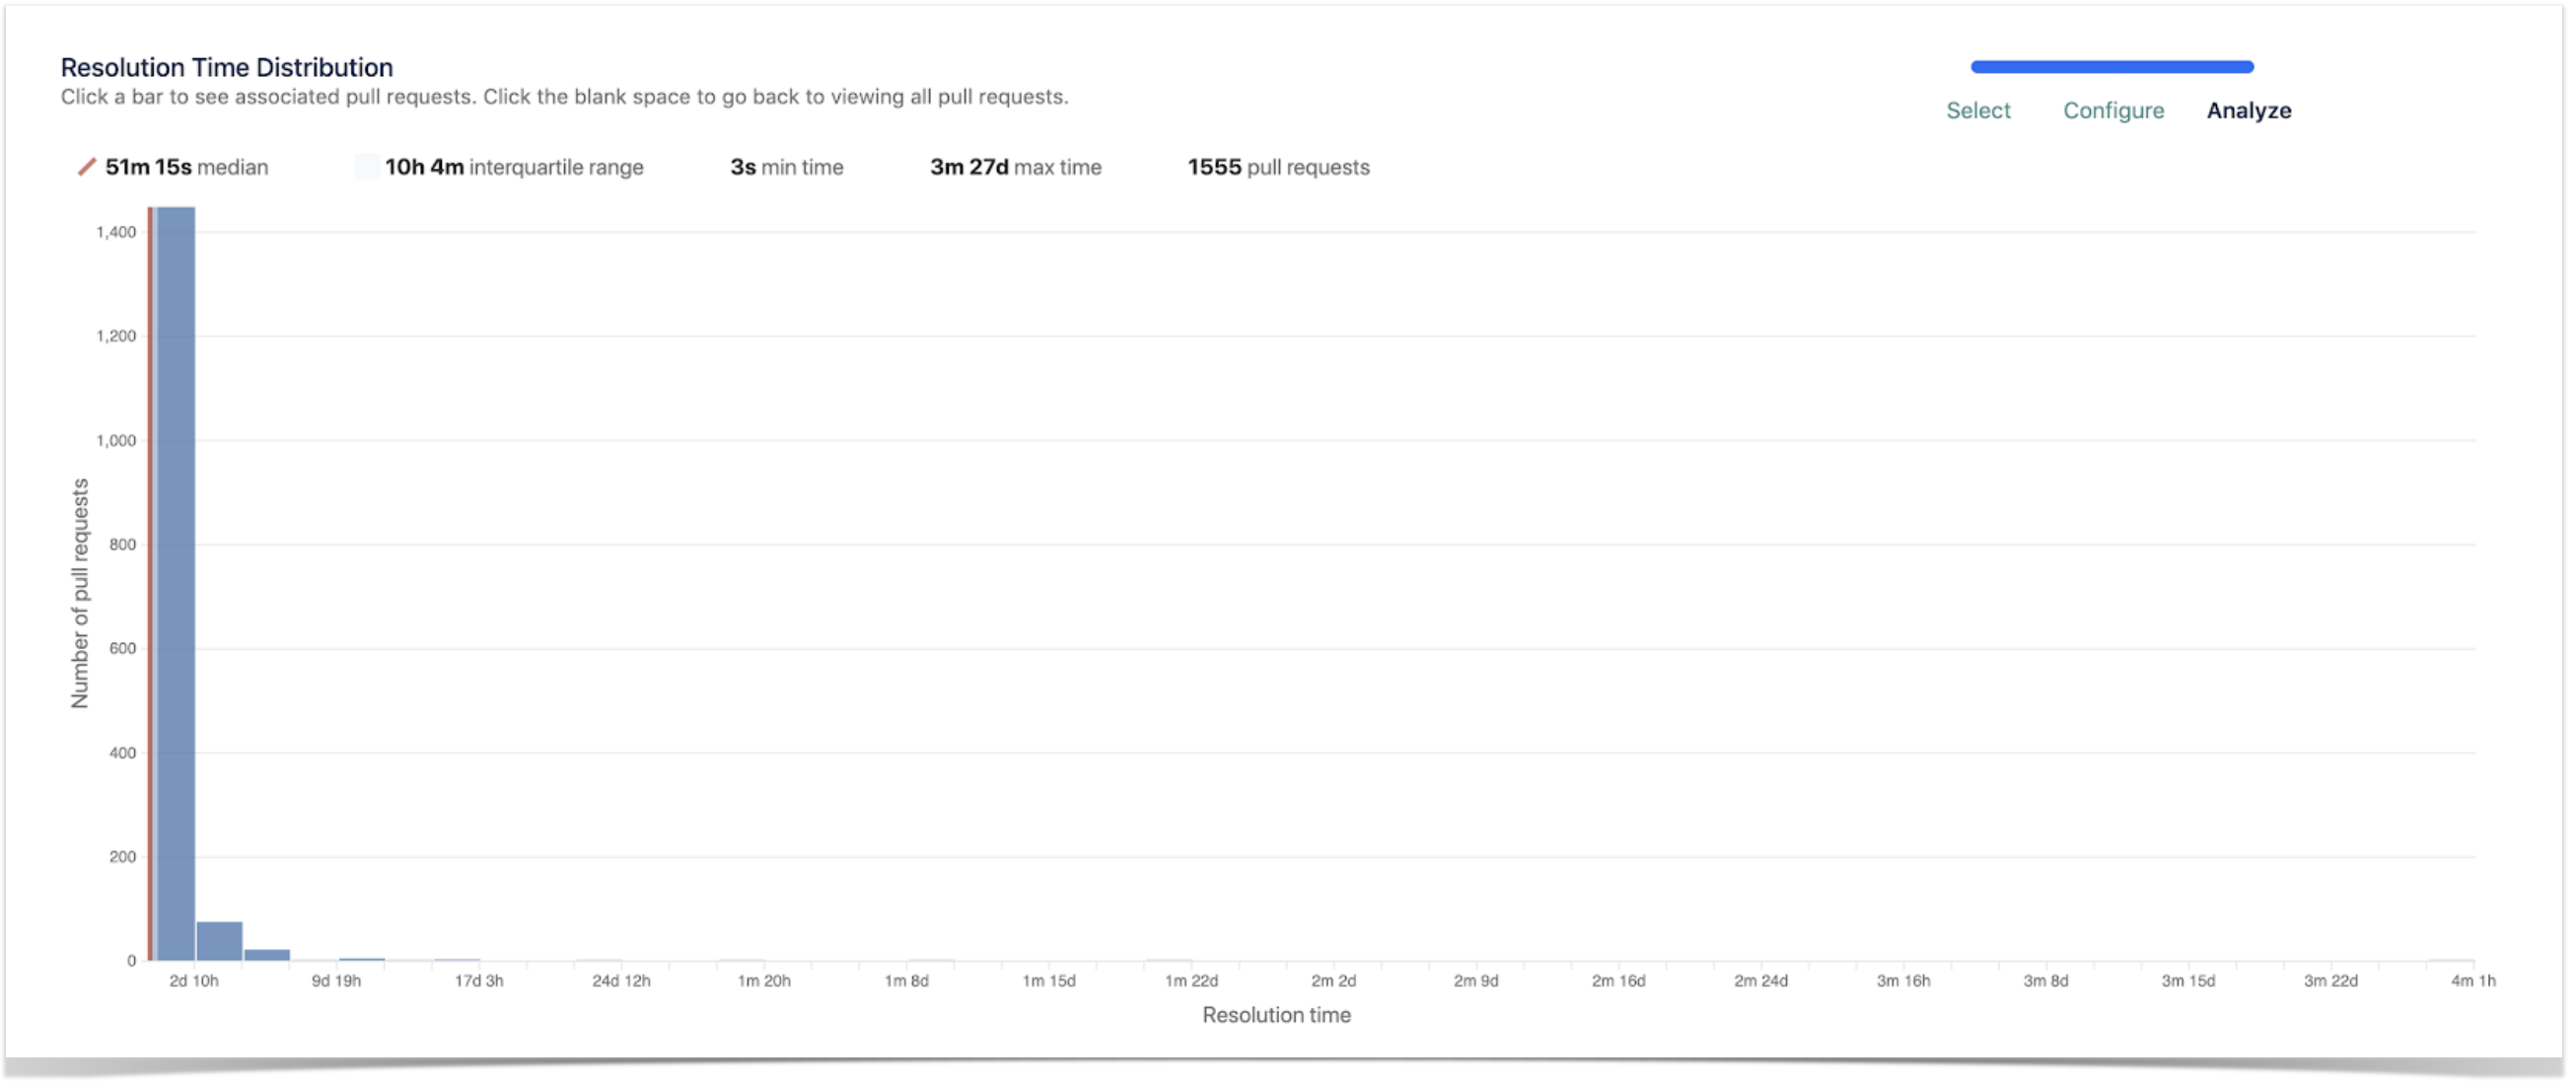
    Pull requests with a too long or too short resolution time

    pull requests resolution time report in bitbucket

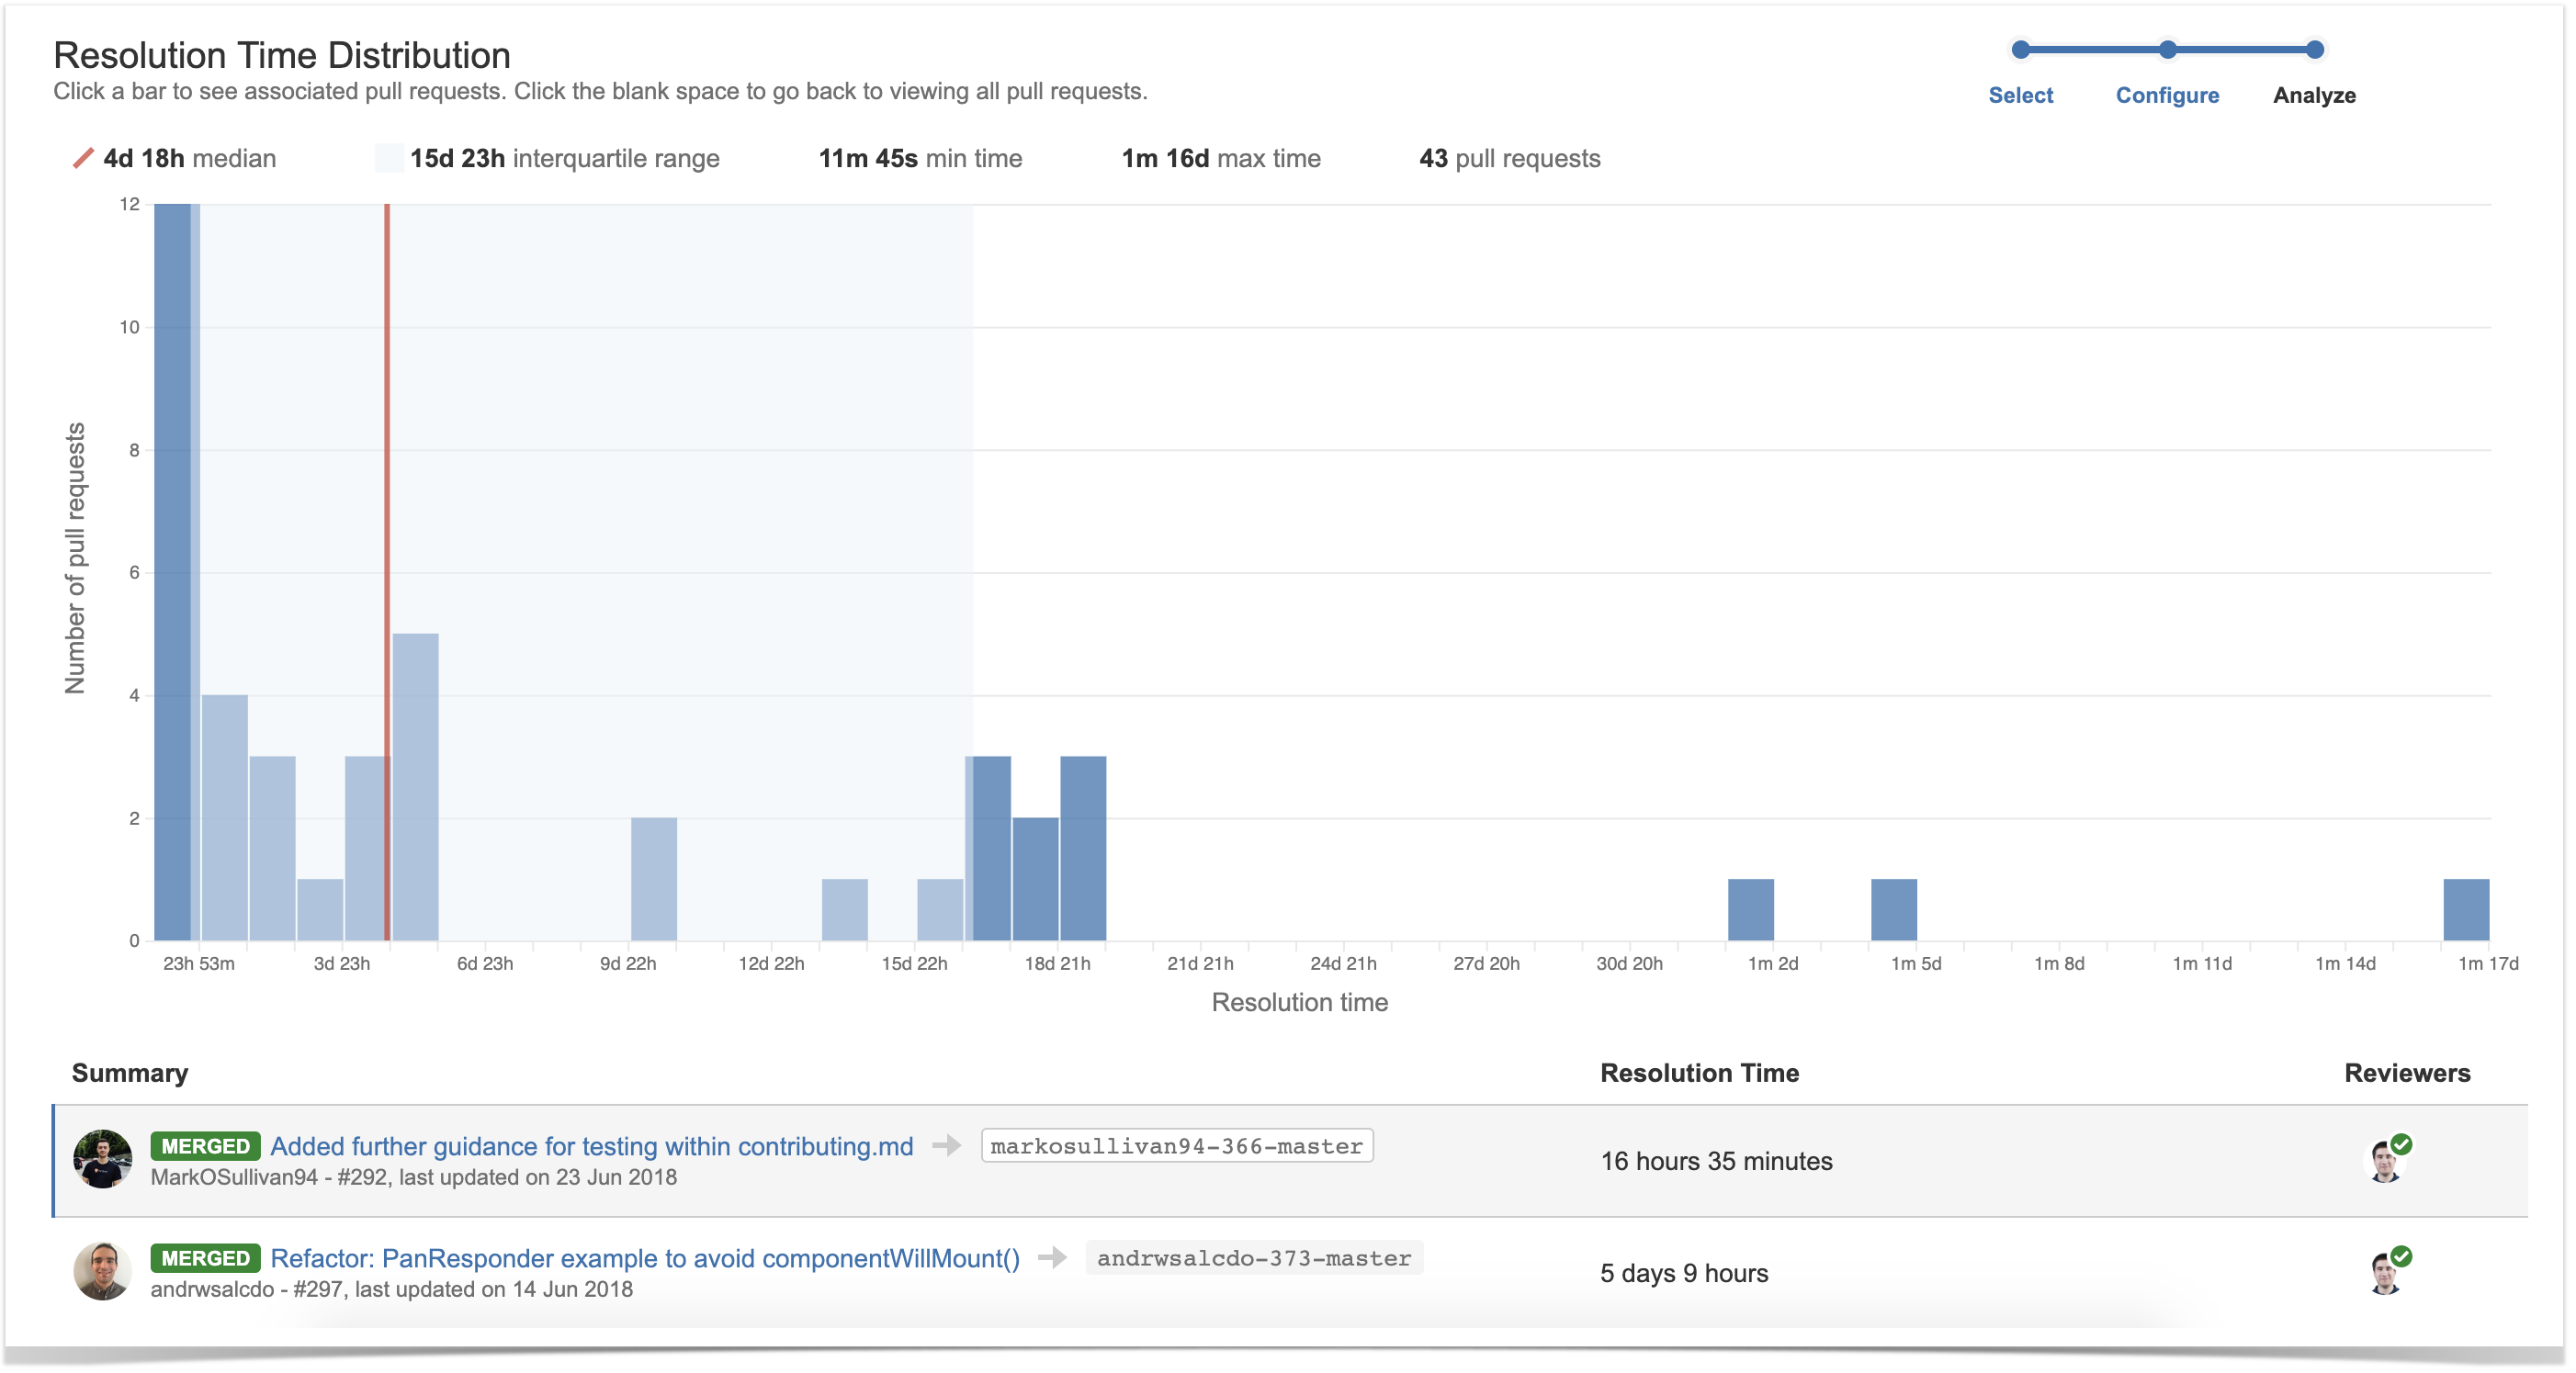
    The Resolution Time Distribution Report visualizes pull requests grouped by the time taken to merge or decline them and gives an idea of the most frequent resolution times on your project. Using this report. you can easily:

    • find pull requests with the longest resolution time to check the reasons for the delay
    • see pull requests with the shortest time to resolve them to investigate whether they were checked as appropriate
    • predict the resolution time for the future pull requests.

    Learn more

    Exporting pull requests for the future processing

    With Awesome Graphs, the historical data can be exported to a CSV file right on the People page.

    exporting pull requests from bitbucket

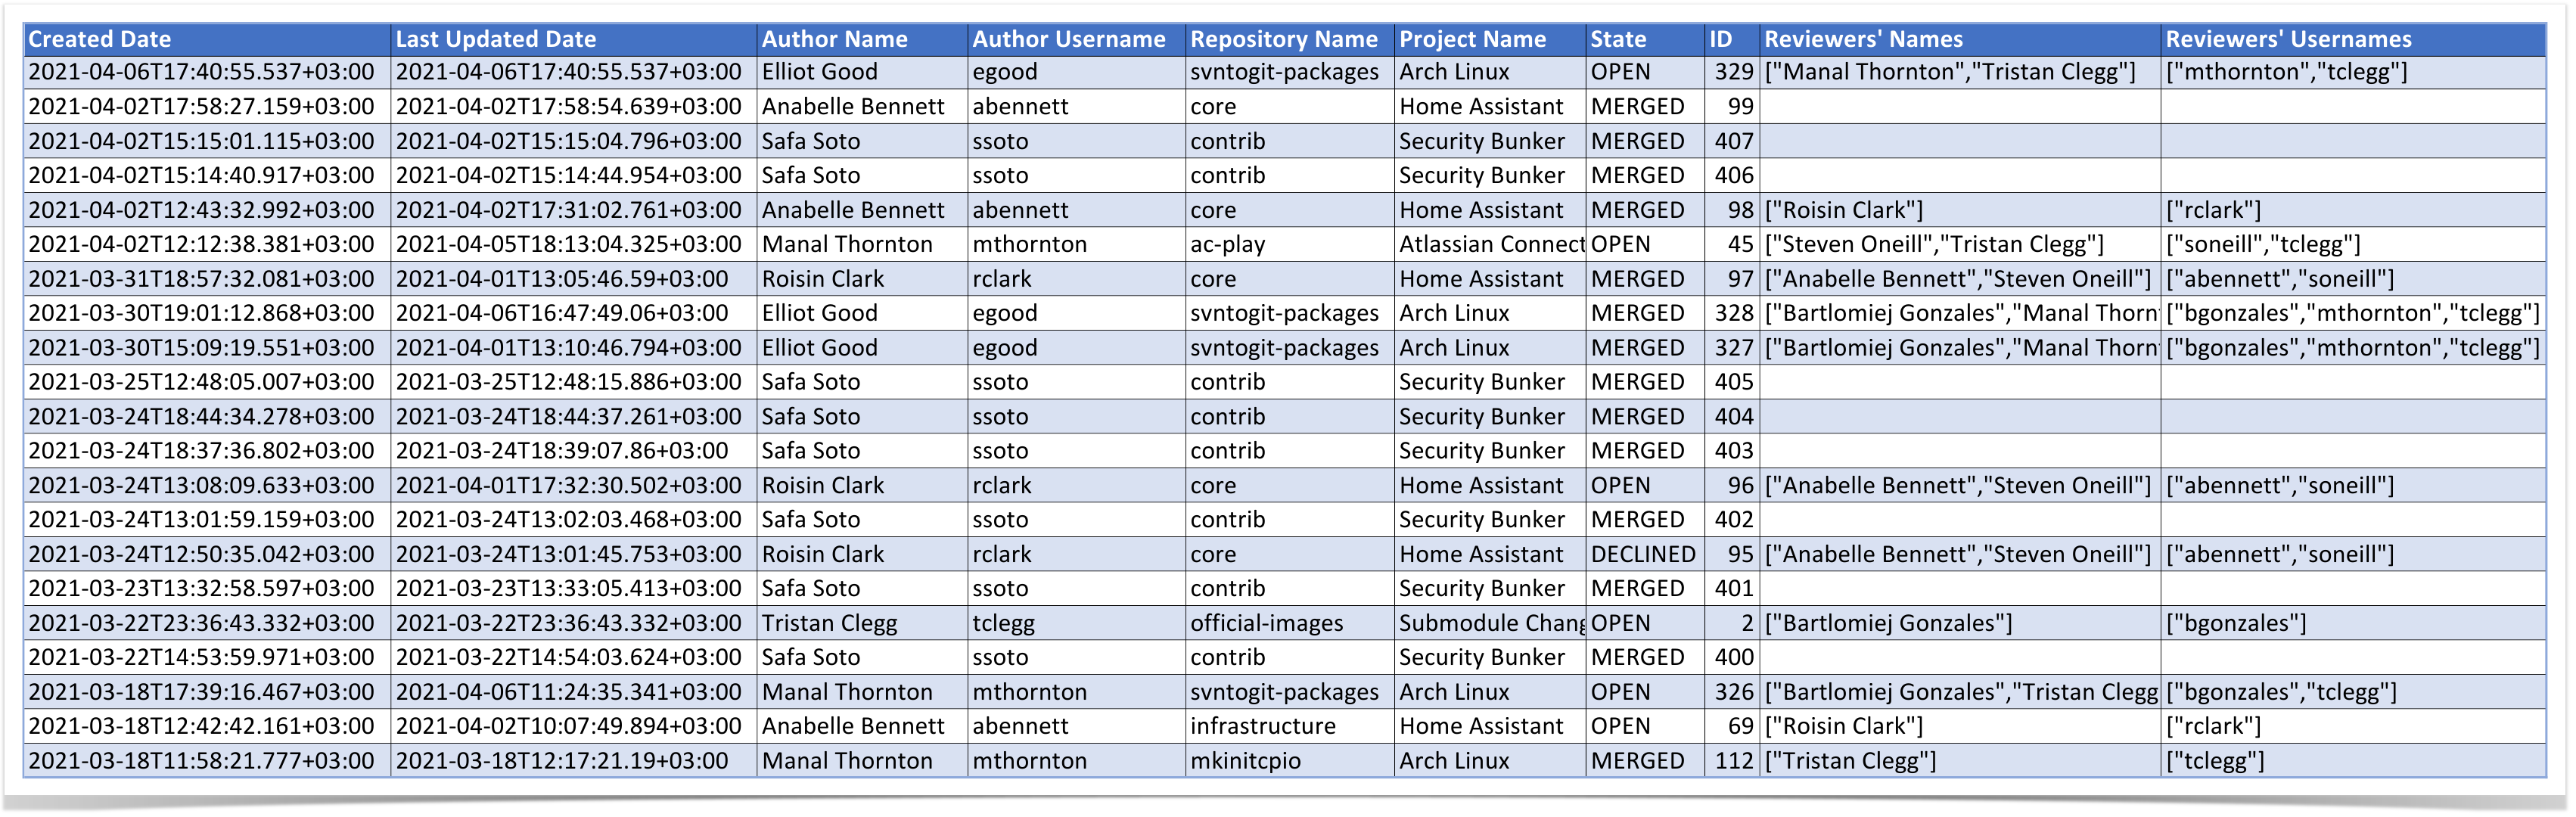
    As a result of the exporting, you receive the CSV file with the list of pull requests (alternatively, the list of commits) with their details about the author, reviewers, state, the date they were created and last updated. The files can be processed in Excel or integrated with analytics tools like Tableau, Power BI, etc. to create custom graphs and dashboards and merge with the data from other apps.

    Learn more

    What other reports do you need?

    Awesome Graphs already has a wide range of graphs and reports that help you answer various questions about project development and the work of your team in Bitbucket. We are open to your feedback and appreciate hearing about what you need. So if you have a problem that you think Awesome Graphs can help you with, contact us – we actually listen.

    Try Awesome Graphs for free


    Announcing New Stiltsoft Partner Program

    March 22, 2021
    #News
    2 min

    At Stiltsoft, we recognize how important both our partners and customers are, so we decided to launch our new Partner Program that will affect only the Awesome Graphs for Bitbucket app.

    We are building a new Partner Program to provide you with comprehensive training materials and resources, free app licenses, promo codes, and more. If you apply, you save time and effort of your sales team with the help of our training course and demos on demand.

    We want to inform you that Awesome Graphs for Bitbucket has Standard Atlassian Partner Discount until March 21st, 2021. From March 22nd, a 20% discount will only be available for Stiltsoft Partners.

    Other Stiltsoft apps participate in the Standard Discount scheme for Atlassian Marketplace Products.

    To get a 20% discount, you will need to become our partner. Moreover, you will get other partnership perks:

    • Free licenses
    • Demo on demand
    • Promo codes
    • Enablement materials
    • App training
    • Co-marketing activities

    To join, simply drop an email at partner@stiltsoft.com, and we will get you set up as soon as possible. For more details, please visit our website.

    We look forward to continued collaboration!

    Related posts

      Case Study: How a FinTech Company Improves Code Review Process

      June 30, 2020
      #Bitbucket#Case Study
      7 min

      We’ve got pretty good with our Pull Request and Code Review process, but initially, our PRs were complex, not very well documented, and difficult to read. The Resolution Time Distribution graph shows how better we are getting at this, being able to merge PRs much quicker than before.

      Pablo Reyes, VP Engineering at Strands

      Strands is one of our customers that has been using Awesome Graphs for Bitbucket for a couple of years so far. Since 2004, Strands has been developing highly customizable digital money management software for top-tier financial institutions worldwide. Our team is happy to help them reach their goals and improve their development processes with the statistics visualizations we provide.

      Pablo Reyes, VP of Engineering at Strands, shared best practices on how their team effectively uses our solution to:

      • identify bottlenecks in code review
      • track the process improvement with the implemented changes
      • increase developers’ motivation by keeping an eye on their performance trends.

      Code review process improvement

      In fact, they’ve got pretty good with their Code Review process so far. But initially, the PRs were complex, poorly documented, and difficult to read. The Resolution Time Distribution report shows how better they are getting at this, merging PRs much quicker than before. code review process improvement in Bitbucket

      Since they do a lot of code reviews at Strands, it’s always nice to see who and what teams are making the best use of it. It’s motivating for the team to see the progress, and the Pull Requests reports give them the perfect overview of these advancements.

      A couple of years ago, they started improving their code review process. For example, they introduced the practice of approving PRs by at least three people. Moreover, they encouraged developers to leave many comments and suggestions and only approve a PR once it’s good enough.

      As a result, PRs are resolved faster, not only because they are done better but also because the quality of suggested improvements rises constantly. The Contributions report gives an overview of code review activity and whether it improves or not.

      contributions report in Bitbucket

      Software development tracking

      At Strands, managers don’t use Awesome Graphs to control the number of commits per developer. Still, they find it useful to look at the dynamics of the overall activity to capture the code development trends. For example, if there’s a significant drop, the developer is probably stuck at difficult tasks or disturbed by various activities, helping other teams or communicating with customers.

      Most things are caught soon in the day-to-day communication and work, but mid-term changes in the trend (either a decrease or increase) give them a hint of something they may need to look at. This has been visible when people change projects or teams.

      The developer’s Contributions graph gives a clear view of this kind of drops and rises, and it’s handy to compare two periods before and after certain changes were implemented.

      developer contributions in Bitbucket

      Any emerging trend serves as a valuable point for discussion, enabling the team to identify potential bottlenecks or areas that can be enhanced within their software development process. Developers’ performance is complex and depends on lots of different things, some quantitative and some qualitative. Still, the aggregation of code contributions (comments, pull requests, tasks solved, commits, etc) gives some good indicators of how a team evolves with time.

      Along with the others, the Contributors graph provides insights into the dynamics of code contributions by different teams and helps with software development tracking.

      software development tracking

      Try the best teams’ practices for your company

      Awesome Graphs for Bitbucket has become a helpful tool for Strands to identify problem areas  in their processes and track whether the implemented changes improve them. Besides, it is a handy instrument for regular monitoring of software development.

      Try Awesome Graphs for Bitbucket for free and discover how it can benefit your workflow.

      Read more case studies to see how our customers benefit from using Awesome Graphs for Bitbucket in their work:

      Related posts

        Remote Teams Management: How to Turn Data into Code Review Insights

        March 17, 2020
        #Reporting#Analytics#How To#Bitbucket
        12 min

        Remote teams management can be quite challenging. Distance makes it more difficult to monitor your distributed team activity. So, you have to either rely on them, hoping it won’t end up as a disaster, or annoy developers with overcontrol.

        Fortunately, there’s no need to go blindly as you can go data-driven and use the statistics of developers’ activity to your advantage.

        In this article, we focus on pull requests metrics as a way to identify bottlenecks in the code review process and check if it’s healthy or not. You will find the answers to the following questions:

        • What metrics to choose as a subject to analyze and how to organize them.
        • How to retrieve them using Bitbucket REST API.
        • How to interpret metrics to get as many insights as possible.

        Pull Requests status dashboard

        If you want to keep in touch with the pull requests on your project status, you may find it useful to create a dashboard that visualizes the statuses of pull requests. This helps you see:

        • the number of pull requests your team created for the last week/month/sprint
        • how many pull requests are already merged and which of them are still open
        • if there are any pull requests open long ago and are not merged yet.

        You can retrieve this data using this Bitbucket REST API request:

        https://your-bitbucket-url/rest/api/1.0/projects/{projectKey}/repos/{repositorySlug}/pull-requests?state=all

        Get the following information from the returned results: pull request ID, state, and the date it was created and merged in the Unix time format.

        {
            "size": 25,
            "limit": 25,
            "isLastPage": false,
            "values": [
                {
                    "id": 13,
                    "version": 13,
                    "title": "Looking for Sarah Connor",
                    "description": "Trying to save the Future",
                    "state": "MERGED",
                    "open": false,
                    "closed": true,
                    "createdDate": 1583837364846,
                    "updatedDate": 1583843660283,
                    "closedDate": 1583843660283,
                    "fromRef": {},
                    "toRef": {},
                    "locked": false,
                    "author": {
                        "user": {
                            "name": "arnie",
                            "emailAddress": "arnie@stiltsoft.com",
                            "id": 3,
                            "displayName": "Arnie",
                            "active": true,
                            "slug": "arnie",
                            "type": "NORMAL",
                            "links": {},
                        "role": "AUTHOR",
                        "approved": false,
                        "status": "UNAPPROVED"
                    },
                    "reviewers": [
                        {
                            "user": {
                                "name": "sarahconnor",
                                "emailAddress": "sarahconnor@stiltsoft.com",
                                "id": 4,
                                "displayName": "Sarah Connor",
                                "active": true,
                                "slug": "sarahconnor",
                                "type": "NORMAL",
                                "links": {},
                            "lastReviewedCommit": "",
                            "role": "REVIEWER",
                            "approved": true,
                            "status": "APPROVED"
                        }
                    ],
                    "participants": [],
                    "properties": {
                        "resolvedTaskCount": 3,
                        "commentCount": 1,
                        "openTaskCount": 0
                    },
                    "links": {}
                        ]
                    }
                },

        Then create a script that parses these data and turns it into a pull requests status dashboard. 

        There are some possible difficulties you may face due to the REST API restrictions:

        • The number of returned results is limited, so you’ll have to make several requests to retrieve all data.
        • It’s only possible to run the query on a repository level, so the more repositories you have, the more requests you’ll need to make.
        • The Bitbucket performance may be affected in large instances.

        The same can be done using the Pie Chart report in Awesome Graphs for Bitbucket. Grouped by state, it shows the number of pull requests created during the chosen time span with their current statuses. 

        Pull request metrics - check status of pull requests

        Tip: find pull requests created long ago and not merged yet by selecting a previous week or month as a period to analyze.

        Reviewers’ involvement

        Another pattern to watch is whether all team members participate in the code review. If not, there are some possible consequences:

        • knowledge sharing in a team is poor, and junior developers miss the opportunity to grow their skills without watching the examples of more experienced programmers’ work
        • pull requests resolution may be slow if there are more pull requests created than people who can review it
        • those who review all pull requests may have no time to write new code.

        The same REST API request from the previous paragraph retrieves the data about the participants of pull requests. Organize these data as a list of reviewers and the number of pull requests they reviewed to get insights about the developers’ involvement in the peer review. 

        The Pie Chart report grouped by reviewer serves the same purposes and gives you a breakdown of pull requests reviewed by all members of your team.

        Analyze how your team is involved in the code review process

        Tip: pay attention to pull requests that are merged without reviewing. Those are the areas where you may have a risk as the code was not checked as appropriate. 

        Reviewers’ activity chart

        The difference between just being assigned as a reviewer and truly reviewing the new code and suggesting improvements to it is huge. Luckily, there are a couple of metrics to watch that may help you get a clear view of the thoroughness with which developers check each other’s work.

        Use this REST API request and retrieve the data about the number of tasks, comments, needs work, or approved actions per pull request and group it by user:

        https://your-bitbucket-url/rest/api/1.0/projects/{projectKey}/repos/{repositorySlug}/pull-requests/{pullRequestId}/activities

        The example of the returned results with the data that needs to be parsed:

        {
            "size": 5,
            "limit": 25,
            "isLastPage": true,
            "values": [
                {
                    "id": 46766,
                    "createdDate": 1574762295000,
                    "user": {
                        "name": "sarahconnor",
                        "emailAddress": "sarahconnor@stiltsoft.com",
                        "id": 3,
                        "displayName": "Sarah Connor",
                        "active": true,
                        "slug": "sarahconnor",
                        "type": "NORMAL",
                        "links": {}
                    },
                    "action": "MERGED",
                    "commit": {}
                },
                {
                    "id": 46756,
                    "createdDate": 1574690608000,
                    "user": {
                        "name": "johnconnor",
                        "emailAddress": "johnconnor@stiltsoft.com",
                        "id": 652,
                        "displayName": "John Connor",
                        "active": true,
                        "slug": "johnconnor",
                        "type": "NORMAL",
                        "links": {}
                    },
                    "action": "APPROVED"
                },
                {
                    "id": 46688,
                    "createdDate": 1574431693000,
                    "user": {
                        "name": "arnie",
                        "emailAddress": "arnie@stiltsoft.com",
                        "id": 4,
                        "displayName": "Arnie",
                        "active": true,
                        "slug": "arnie",
                        "type": "NORMAL",
                        "links": {}
                    },
                    "action": "COMMENTED",
                    "commentAction": "ADDED",
                    "comment": {
                        "properties": {},
                        "id": 6569,
                        "version": 0,
                        "text": "i need your jacket, boots, and motorcycle",
                        "author": {}
                        },
                {
                    "id": 46668,
                    "createdDate": 1574418254000,
                    "user": {
                        "name": "sarahconnor",
                        "emailAddress": "sarahconnor@stiltsoft.com",
                        "id": 3,
                        "displayName": "Sarah Connor",
                        "active": true,
                        "slug": "sarahconnor",
                        "type": "NORMAL",
                        "links": {}
                    },
                    "action": "OPENED"
                }
            ],
            "start": 0
        }

        The visualization of the developers’ activity in pull requests provides you with the following insights:

        • Most active reviewers in your team. These people check the code thoroughly. On the other hand, this pattern may have negative sides if the perfectionism slows down the feature delivery too much.
        • Infrequent participants in the code review. These developers are not involved in the knowledge sharing process for some reason. Do they skip this part of work intentionally, or are they afraid to criticize their colleagues’ work? 
        • Periods with unusual activity. Check the values that go beyond the trend to find the answer to why the reviewer had to leave too many or too little comments. For example, there can be bad code or the pull request was too large, and nobody wanted to check it. These are the patterns that you’d definitely like to avoid.

        The Contributions report provides the same view across projects and repositories with the swift access to each pull request in Bitbucket so you could check its content.

        Apply a data-driven approach in remote teams management

        Tip: group this report by author to see who receives the largest number of tasks and comments in their pull requests. This may be a sign of a code that took lots of re-writing and may lead to bugs in the future. Besides, looking at the dynamics of these numbers makes it obvious if developers are improving their working patterns or not.

        Try the data-driven approach to bring transparency into your code review processes

        Tracking developers’ activity may be especially important in remote or distributed teams where it’s impossible to reach each other physically. 

        However, the benefits that software development metrics bring are valuable for any company as they help:

        • find areas to improve in code review processes
        • optimize peer review practices
        • avoid slowdowns and poor quality code. 

        Create your dashboard using the Bitbucket REST API or try Awesome Graphs for Bitbucket for free to discover how you can benefit from it!

        Related posts

          Introducing New Feature: Graphs for Teams in Awesome Graphs

          December 3, 2019
          #Reporting#Analytics#News#Bitbucket
          7 min

          There is no doubt that effective working and communication processes in a team greatly influence the overall success of a product or company. Atlassian products like Bitbucket, Jira, and Confluence aim to improve collaboration and bring distributed colleagues together.

          Awesome Graphs for Bitbucket app is our contribution to the teamwork of more than 2,000 companies, as its primary goal is to help identify the bottlenecks in the development workflow and increase the speed. We are eager to make the processes transparent for both developers and managers and, thereby, improve the communication and narrow the gap between them.

          We’ve discovered that lots of our clients use similar workflows: they have multiple teams working on the same project or repository. Therefore, tracking the productivity of a particular group that a project or delivery manager, or team lead manages can be tricky as the app showed graphs for all the activity across a project or repository that included the statistics about all the teams together. That’s why we decided to implement a feature that can make their lives easier: graphs for teams.

          View the statistics for your team

          Teams feature is designed to visualize the statistics about your team performance if there’s a lot of people working on a project or repository. It excludes the contributions of the members of other teams and helps get rid of noisy data.

          Configure your teams in the settings and choose it in the All contributors drop-down menu on the Graphs page and analyze how much commits, pull requests, and lines of code a team produces apart from others.

          Compare the activity of different teams

          If you manage multiple teams working on the same project or repository, you may find it useful to separate their statistics from each other.  For example, compare their impact in a codebase of your repository using the Code Frequency graph. That’s what you can easily do with our new feature!

          Let’s say you manage two teams: back-end and front-end developers. Open a graph for each team in different tabs and compare their performance.

          From the screenshot below, you may identify that your back-end team is continuously deleting the lines of code. They are probably involved in some bug fixing or refactoring activities or implement changes in the API.

          Meanwhile, the front-end team has to rewrite some pieces of code to adjust the changes in the backend.

          Exclude automated users from the statistics

          If you use automation in your repositories, the graphs may show the information that is not related to the activity of your team. Lots of commits and lines of code added by CI/CD users and automated scripts may complicate the performance analysis since it’s not obvious which contributions are made by real people and which of them are not.

          Use teams feature to solve this problem by creating a team with all the people you need except for the automated users.

          Teams management

          A team can be made on the global, project, and repository level by the user with administrative permissions on this level. A team can include whole Bitbucket groups or individual users.

          It’s possible to create a global team in the Teams tab in the Administration page and view graphs for it in all projects and repositories.

          There’s no need to disturb your Sys Admins from their work to create a team. If you’re a project or repository admin, you may do it in the Teams tab in the settings. In this case, your teams’ graphs will be available only in your repository or project and higher.

          Improve your teams’ activity tracking

          At the moment, graphs for teams are available only for the Graphs page, but we’ll add this feature to the People page and Reports soon in the next releases.

          Try a new version of Awesome Graphs for Bitbucket to get even more useful insights on your team productivity and compare the activities of different teams!

          We are delighted to implement the team feature that our customers were asking for, and we hope to make their working process a bit easier and better! So, we appreciate any feedback on the app and suggestions that could help you get the most benefit from Awesome Graphs. If you have any, please, feel free to write to us here as we’re looking forward to learning about your needs!

          Related posts