Analyze How Code Review is Going in Bitbucket Data Center

September 27, 2021
#Analytics#How To#Bitbucket
9 min

Awesome Graphs is one of our most popular apps. It’s a solution that extends Bitbucket, a platform that teams use to host Git repositories and collaborate on code.

Awesome Graphs helps engineering leaders and software teams improve their own processes and deliver products faster by transforming invisible development activities into easy-to-understand insights and reports.

One of the keys focuses of the app is the code review processes analytics. We would like to tell you which features support this use case and how you can benefit from the app. Keep reading if you are interested in:

  • Seeing how actively your team members review code
  • Analyzing what developers may need to improve their work patterns and who’s doing a great job
  • Learning what reviewers are most active and diligent
  • Knowing the average time taken to resolve pull requests.

Code review analysis

code review analysis in bitbucket

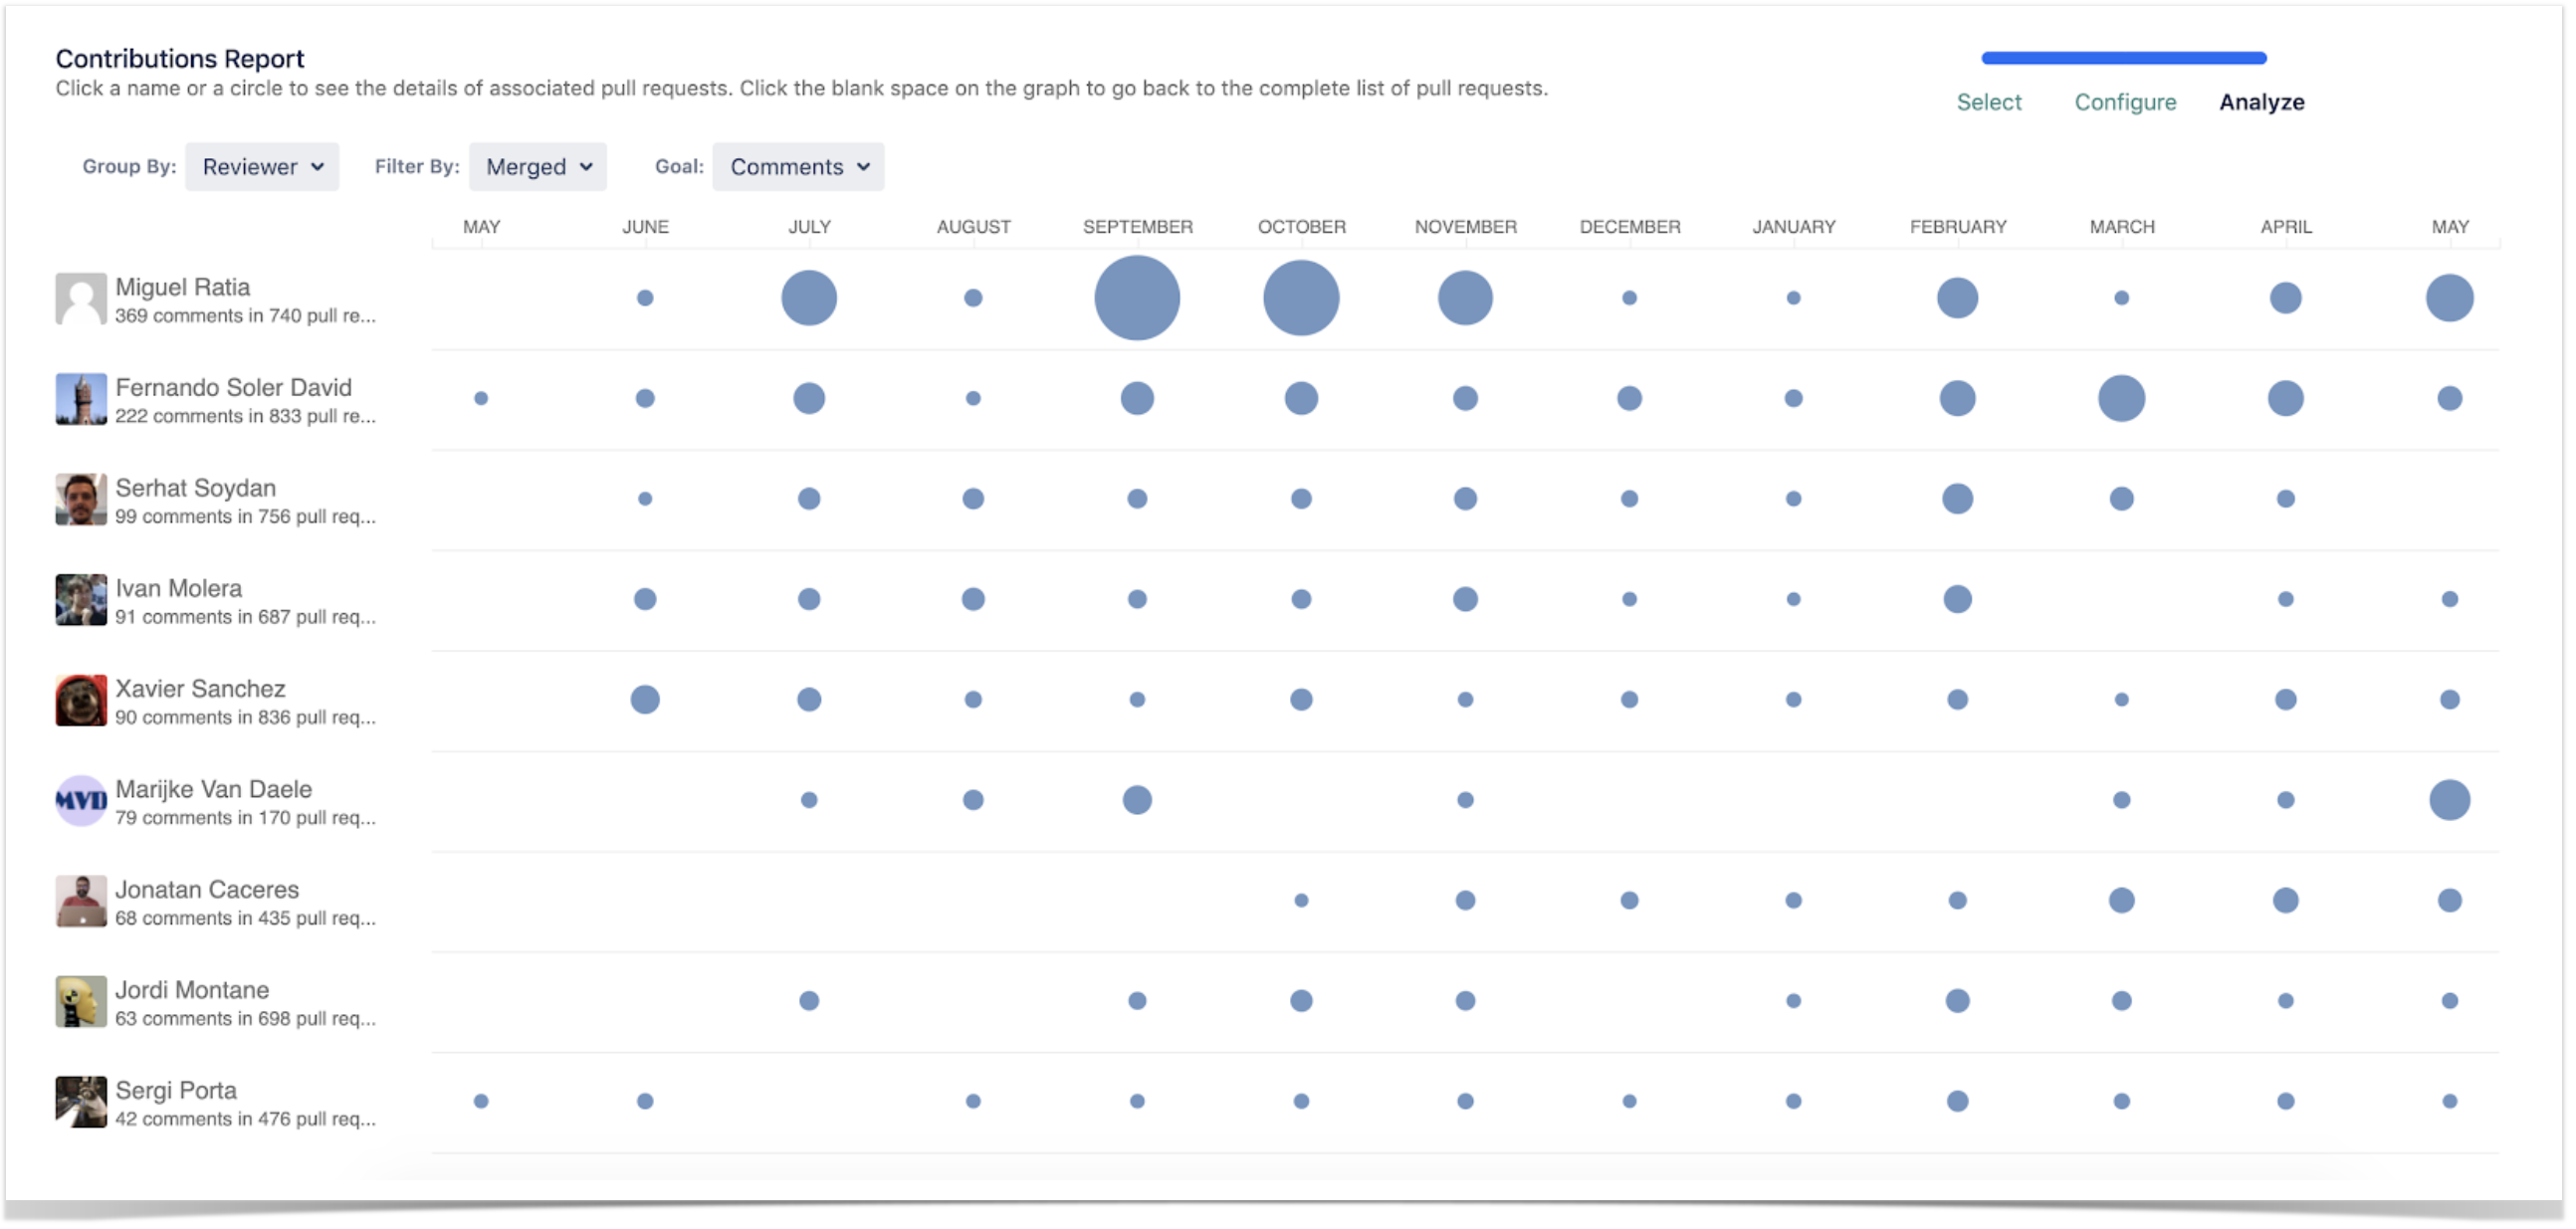
The Contributions Report analyzes activity in pull requests (tasks, comments, needs work/approved/declined statuses). It helps you understand:

  • What developers create high-quality code and who might need to improve their approach to work. E.g. when an engineer has fewer taskscomments, and needs work flags in their pull requests, it suggests his work is approved as it is or with minor changes and he creates code of high quality.
  • What reviewers are thorough when they review the work of developers. E.g. diligent reviewers come up with suggestions and improvements, so they have more tasks and comments than others.
  • How the dynamics of code review changes over time. E.g. you can see if the number of pull requests with Needs work flags is getting bigger or smaller if the number of tasks in pull requests is increasing or decreasing over time.

Learn more

The average time taken to resolve pull requests

pull requests resolution time report in bitbucket

Another report, Resolution Time Report, shows the average time taken to resolve pull requests. This is helpful to capture trends in resolution time. It displays resolution times of merged and declined pull requests separately. With this report you can:

  • Notice spikes in resolution time and then dive in to see what went wrong
  • See if an average resolution time is high for a long period of time – it can be a signal to look into your code review process and determine what causes delays
  • Monitor how changes in your processes affect the speed of code review.

Learn more

Knowledge sharing indicators

reviewers of pull requests report in bitbucket

The Pie Chart Report is a handy way to check if all developers in your team are involved in the code review. This report shows the breakdown of pull requests by different statistics types.

Grouped by reviewer, the Pie Chart Report shows the following:

  • How many pull requests each person reviewed. These metrics help understand how much everyone contributes to the project.
  • Whether all people review code or there are one or two who are doing all job. This is an indicator of poor knowledge sharing.
  • Who is too busy reviewing all pull requests of their team. These people can become a bottleneck that slows the delivery time, because they’re not available for immediate review.

Learn more

Pull requests with a too long or too short resolution time

pull requests resolution time report in bitbucket

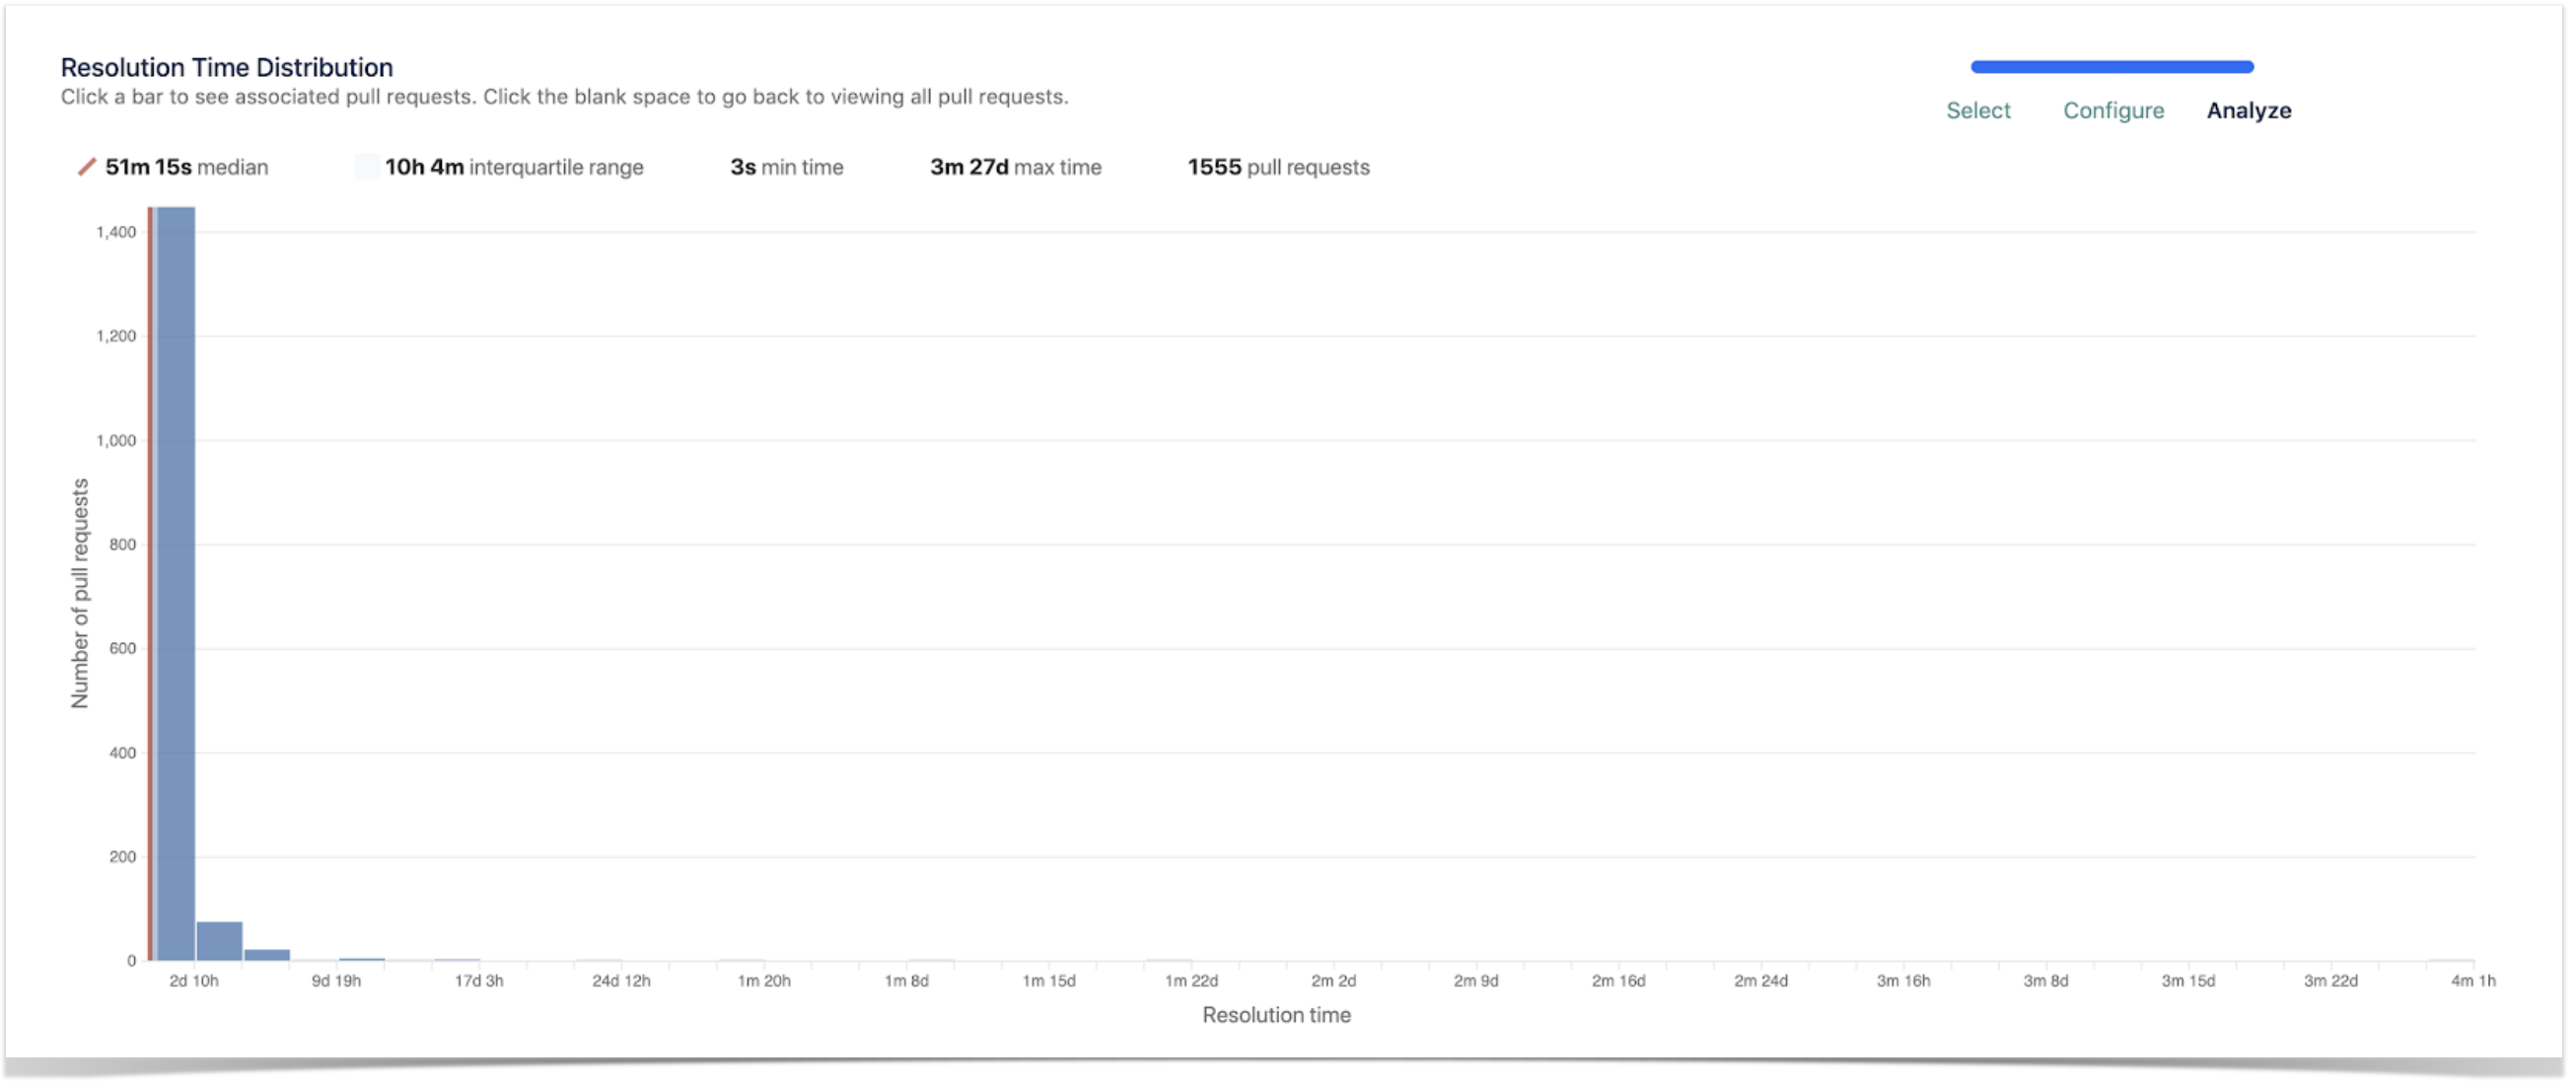
The Resolution Time Distribution Report visualizes pull requests grouped by the time taken to merge or decline them and gives an idea of the most frequent resolution times on your project. Using this report. you can easily:

  • find pull requests with the longest resolution time to check the reasons for the delay
  • see pull requests with the shortest time to resolve them to investigate whether they were checked as appropriate
  • predict the resolution time for the future pull requests.

Learn more

Exporting pull requests for the future processing

With Awesome Graphs, the historical data can be exported to a CSV file right on the People page.

exporting pull requests from bitbucket

As a result of the exporting, you receive the CSV file with the list of pull requests (alternatively, the list of commits) with their details about the author, reviewers, state, the date they were created and last updated. The files can be processed in Excel or integrated with analytics tools like Tableau, Power BI, etc. to create custom graphs and dashboards and merge with the data from other apps.

Learn more

What other reports do you need?

Awesome Graphs already has a wide range of graphs and reports that help you answer various questions about project development and the work of your team in Bitbucket. We are open to your feedback and appreciate hearing about what you need. So if you have a problem that you think Awesome Graphs can help you with, contact us – we actually listen.

Try Awesome Graphs for free


Related posts

    Case Study: How a FinTech Company Improves Code Review Process

    June 30, 2020
    #Case Study#Bitbucket
    7 min

    We’ve got pretty good with our Pull Request and Code Review process, but initially, our PRs were complex, not very well documented, and difficult to read. The Resolution Time Distribution graph shows how better we are getting at this, being able to merge PRs much quicker than before.

    Pablo Reyes, VP Engineering at Strands

    Strands is one of our customers that has been using Awesome Graphs for Bitbucket for a couple of years so far. Since 2004, Strands has been developing highly customizable digital money management software for top-tier financial institutions worldwide. Our team is happy to help them reach their goals and improve their development processes with the statistics visualizations we provide.

    Pablo Reyes, VP of Engineering at Strands, shared best practices on how their team effectively uses our solution to:

    • identify bottlenecks in code review
    • track the process improvement with the implemented changes
    • increase developers’ motivation by keeping an eye on their performance trends.

    Code review process improvement

    In fact, they’ve got pretty good with their Code Review process so far. But initially, the PRs were complex, poorly documented, and difficult to read. The Resolution Time Distribution report shows how better they are getting at this, merging PRs much quicker than before. code review process improvement in Bitbucket

    Since they do a lot of code reviews at Strands, it’s always nice to see who and what teams are making the best use of it. It’s motivating for the team to see the progress, and the Pull Requests reports give them the perfect overview of these advancements.

    A couple of years ago, they started improving their code review process. For example, they introduced the practice of approving PRs by at least three people. Moreover, they encouraged developers to leave many comments and suggestions and only approve a PR once it’s good enough.

    As a result, PRs are resolved faster, not only because they are done better but also because the quality of suggested improvements rises constantly. The Contributions report gives an overview of code review activity and whether it improves or not.

    contributions report in Bitbucket

    Software development tracking

    At Strands, managers don’t use Awesome Graphs to control the number of commits per developer. Still, they find it useful to look at the dynamics of the overall activity to capture the code development trends. For example, if there’s a significant drop, the developer is probably stuck at difficult tasks or disturbed by various activities, helping other teams or communicating with customers.

    Most things are caught soon in the day-to-day communication and work, but mid-term changes in the trend (either a decrease or increase) give them a hint of something they may need to look at. This has been visible when people change projects or teams.

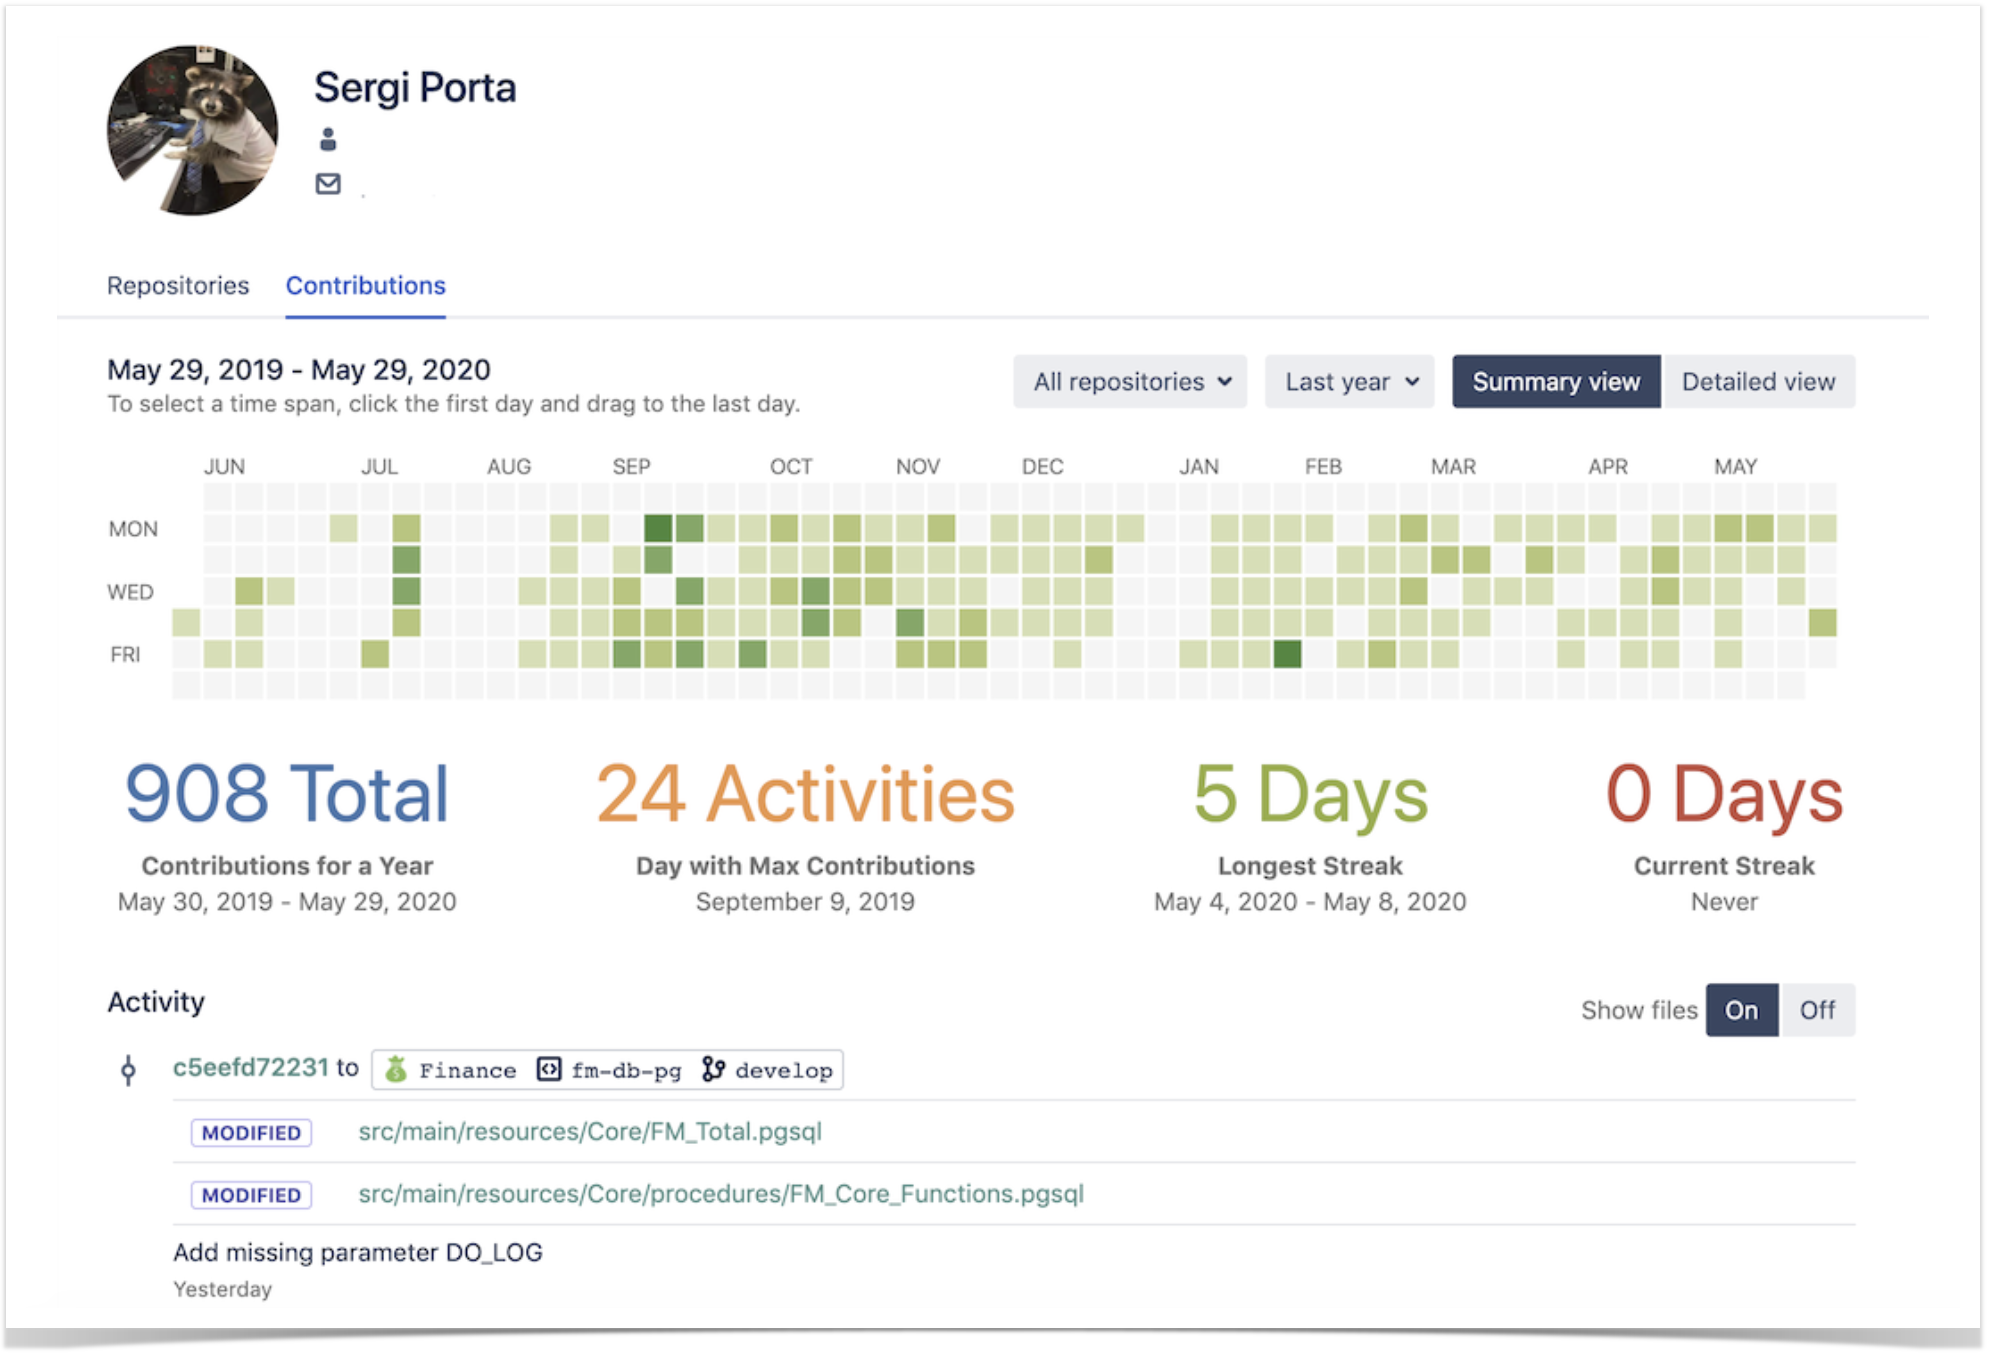
    The developer’s Contributions graph gives a clear view of this kind of drops and rises, and it’s handy to compare two periods before and after certain changes were implemented.

    developer contributions in Bitbucket

    Any emerging trend serves as a valuable point for discussion, enabling the team to identify potential bottlenecks or areas that can be enhanced within their software development process. Developers’ performance is complex and depends on lots of different things, some quantitative and some qualitative. Still, the aggregation of code contributions (comments, pull requests, tasks solved, commits, etc) gives some good indicators of how a team evolves with time.

    Along with the others, the Contributors graph provides insights into the dynamics of code contributions by different teams and helps with software development tracking.

    software development tracking

    Try the best teams’ practices for your company

    Awesome Graphs for Bitbucket has become a helpful tool for Strands to identify problem areas  in their processes and track whether the implemented changes improve them. Besides, it is a handy instrument for regular monitoring of software development.

    Try Awesome Graphs for Bitbucket for free and discover how it can benefit your workflow.

    Read more case studies to see how our customers benefit from using Awesome Graphs for Bitbucket in their work:

    New App Release: Submodule Changes for Bitbucket

    September 17, 2019
    #News#Bitbucket
    4 min

    We have recently released a new app – Submodule Changes for Bitbucket. This free app is created to improve the experience with the Git submodule workflow. No more unreadable pull requests with changes to submodules and skipping the code review process!

    Dealing with submodules can be annoying

    Our company develops Awesome Graphs for Bitbucket – the app that provides the statistics for projects and repositories and helps to analyze and evaluate development team performance, code review practices and personal activity of each team member. Awesome Graphs for Bitbucket is very popular and has more than 2600 installs on the Marketplace at the moment. It’s available for Bitbucket Server, Data Center and Cloud. We use Git submodules that contain features which are similar for all the versions in order to achieve the fastest delivery.

    If you use it in your projects too, you may face the situations when the commits made to a submodule are shown as two hashes in the Diff tab instead of displaying the lines of code, folders, and files that have actually been modified.

    1

    It creates the greatest difficulty to the reviewers of pull requests since there’s no chance to review changes and leave comments on the commits of the submodule repository.

    Review Pull Requests Easily

    If you don’t want to skip such an important part of the development process as the code review, you can try the solution we created: Submodule Changes for Bitbucket. At first, this app came as software that we were using internally, but then we discovered that lots of other developers face similar issues.

    Submodule Changes for Bitbucket replaces two commit hashes with the files modified in a commit or pull request. It highlights the changes with a submodule update in the Diff tab as if all of them were made to a parental repository.

    2

    The app also gives you the possibility to watch the Blame view, leave comments and suggest improvements in pull requests. It makes the process similar to reviewing changes in the original repository.

    3

    Submodule Changes for Bitbucket is a completely free app that can simplify the code review process for the teams that use Git submodules for their projects.

    Try it and see how it fits your workflow!

    Related posts

      New in Awesome Graphs for Bitbucket Cloud: Lines of Code Statistics and Aggregated Stats for All Repos

      December 6, 2018
      #News#Bitbucket
      3 min

      Awesome Graphs for Bitbucket Cloud visualizes statistics of Git repositories. View this video to see the new features and the improvements we’ve recently made to the app or keep reading.

      Lines of code statistics

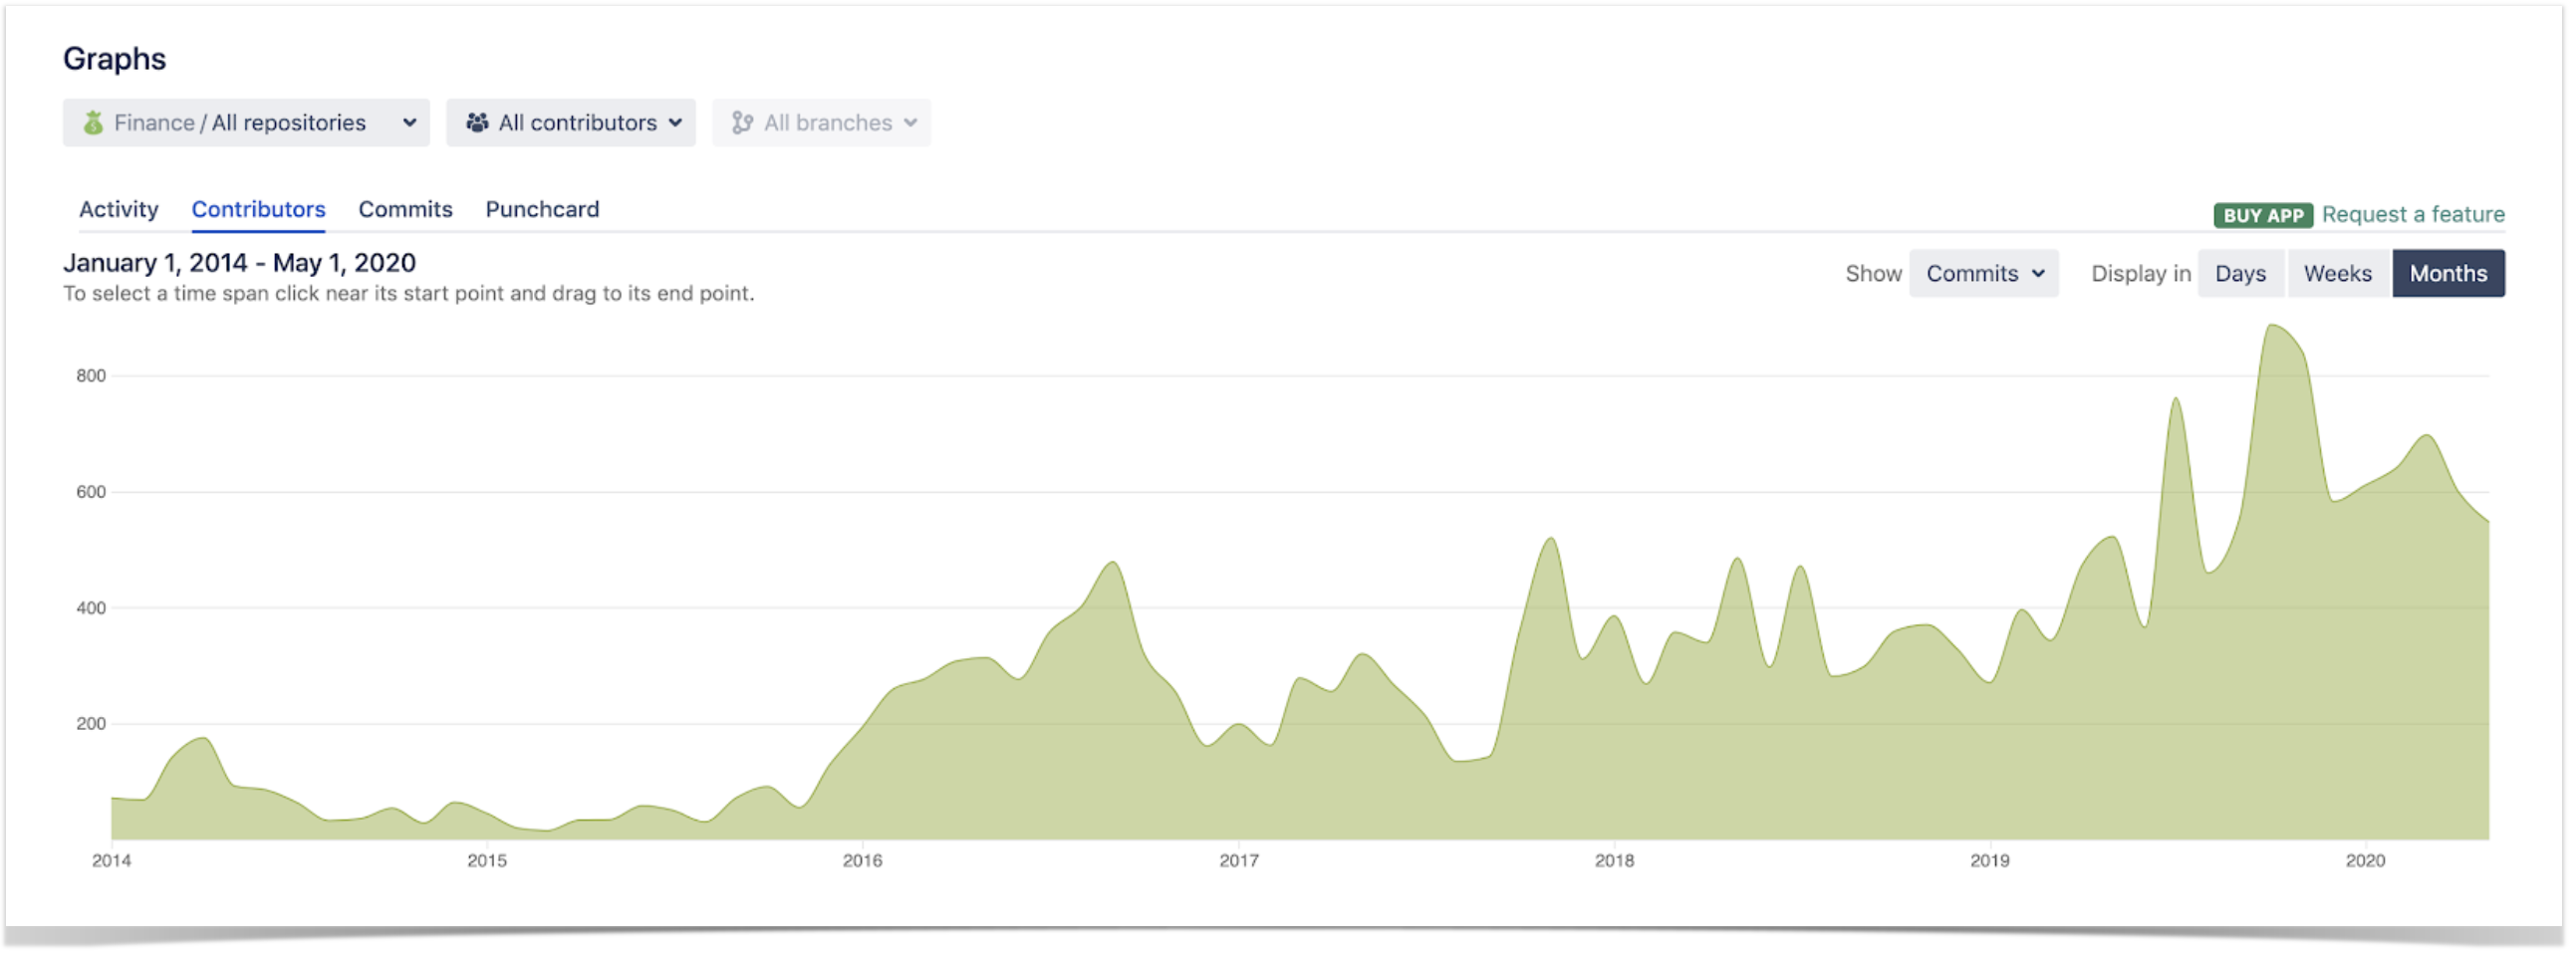
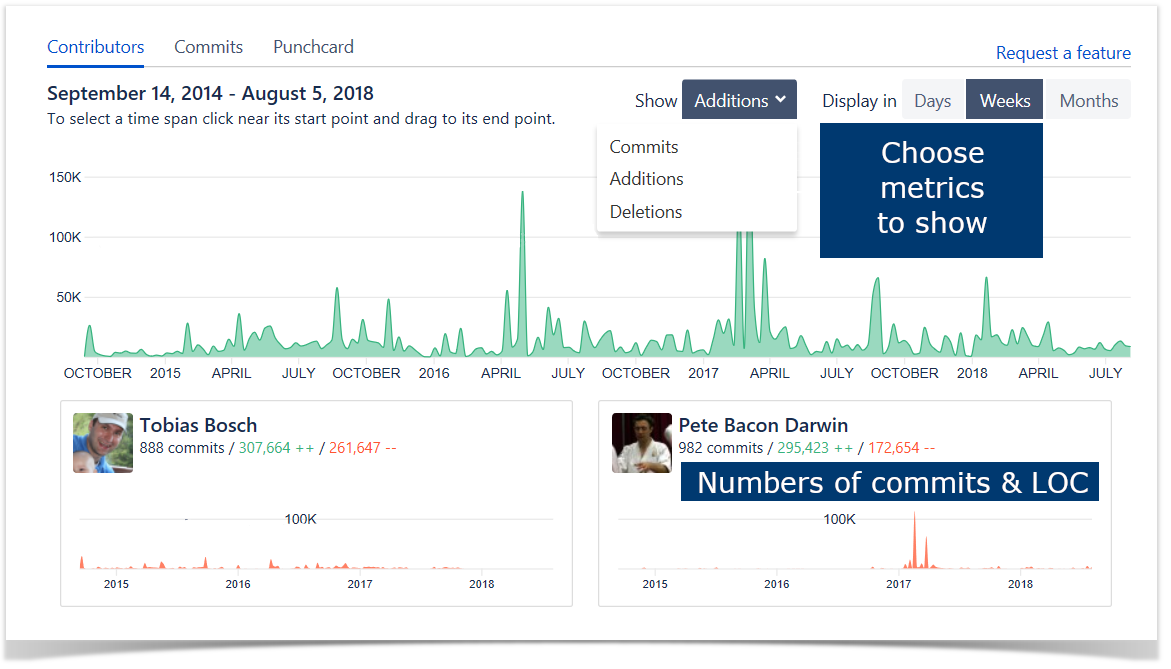
      Previously Contributors graph showed only commits statistics. Now it visualizes repository and user activity in terms of lines of code (LOC).

      You can choose what data to show on the summary graph and individual contributor graphs:

      • commits
      • added lines of code
      • deleted lines of code

      Lines of code metrics are more informative than the number of commits. They will help you to get a better understanding of project activity and efficiency of your team members.

      Contributors graph

      Aggregated stats for all repositories

      Now Awesome Graphs can show ContributorsCommits, and Punchcard graphs with aggregated statistics across all repositories of a user or a team.

      This feature will help you to:

      • see your personal progress
      • monitor performance of your team
      • evaluate work of your team members

      Aggregated stats in Contributors graph

      Awesome Graphs for Bitbucket Cloud is an analytical tool visualizing repository and user activity. With it, you can evaluate team’s performance, track process improvements, and deliver products faster by eliminating guesswork. Try the app now for free!

      Learn more about how to install Awesome Graphs or click here to install the app.

      Related posts

        New in Awesome Graphs: Analyzing Pull Requests Resolution Time, Monitoring Repository Indexing, and More

        November 1, 2018
        #News#Bitbucket#Analytics
        6 min

        Our app Awesome Graphs for Bitbucket visualizes statistics of commits, pull requests, and lines of code helping to monitor and analyze code development and code review.

        During the past year we’ve added new great features and made significant improvements. Let us tell you how you can benefit from them.

        Pull requests’ resolution time distribution

        We’ve created a new pull requests report – Resolution Time Distribution.

        This report helps you to answer such questions:

        • How long does it usually takes to resolve pull requests?
        • Are there more pull requests with a long or short resolution time?
        • What is an expected resolution time for future pull requests?
        • What pull requests of the period had the shortest/longest resolution times?
        • How long it took to resolve a particular pull request?

        Resolution time distribution report

        In the report you will see pull requests grouped by time taken to resolve them (merge or decline).

        You will see median, 25 and 75 percentile of pull requests’ resolution time. This data can help you to estimate resolution time of future pull requests.

        For any time interval (blue bar on the chart) you will be able to see a list of all pull requests with their resolution time and reviewers. For more detailed analysis you can easily switch to a particular pull request to see code changes and discussion during review.

        List of pull requests in Resolution time distribution report

        Learn more about this report

        Admin tools for monitoring repository indexing

        We’ve created powerful tools helping to administer Awesome Graphs. These tools are helpful when monitoring Awesome Graphs performance during repository indexing and troubleshooting app related issues.

        JMX Metrics

        Performance of Awesome Graphs can be monitored via JMX. It provides administrators with the way to understand what is happening in the app. You can estimate how much time repository indexing will take, see if there are any issues while indexing repositories or refs, monitor resource consumption.

        JMX metrics of Awesome Graphs

        More information in logs

        Awesome Graphs creates comprehensive logs. It helps to easily investigate app related issues.

        In Bitbucket UI and in support zip admins can see information about data indexed by Awesome Graphs:

        • total number of indexed contributors
        • total number of indexed commits
        • number of repositories in indexing queue

        Detailed information about repository indexing is recorded in awesome-graphs.log file located in the Bitbucket home directory.

        Alerts to admins

        If a repository could not be indexed admins will get a notification via Bitbucket alerts. It helps to quickly detect and solve problems.

        Alert to admins in Bitbucket

        Learn more about administering Awesome Graphs

        Improved performance

        We’ve significantly improved performance of Awesome Graphs during repository indexing:

        • Commit data are indexed in batches to decrease memory usage.
        • While indexing forks only unique commits are stored in the database. If the same commit exists both in a fork and an original repository, it is not duplicated. This change helps to improve performance and reduce database size. For one of our customers with 10.000+ repositories the size of the table was reduced by four times.
        • Awesome Graphs uses adaptive throttling. With it Bitbucket examines the total physical memory on the machine and determines a maximum ticket number that the machine can safely support. This approach improves the system performance during repository indexing. Learn more about adaptive throttling.

        We are always happy to receive feedback from customers. Feel free to contact us if you have any questions or would like to suggest new features.

        Awesome Graphs has become more awesome. Try this app for free

        Related posts

          Smart Attachments for Confluence Released!

          June 7, 2018
          #Document management#News#Confluence
          5 min

          Over the past years, we were continuously receiving your requests about implementation of our Jira app for attachment management in Atlassian Confluence. We got different ideas and did our best to figure out what kind of a solution would satisfy your needs and improve your experience with attachments in Confluence.

          We reviewed tons of requests at Atlassian Community trying to find problems that our customers encounter every day. After that we created two prototypes which we further discussed with existing Confluence users and chose the proven variant.

          Ladies and gentlemen, StiltSoft team is happy to announce release (here goes the roll of drums) – Smart Attachments for Confluence!

          Our new app was designed to simplify your experience with storing attachments in project spaces and getting quick access to the required document at once.

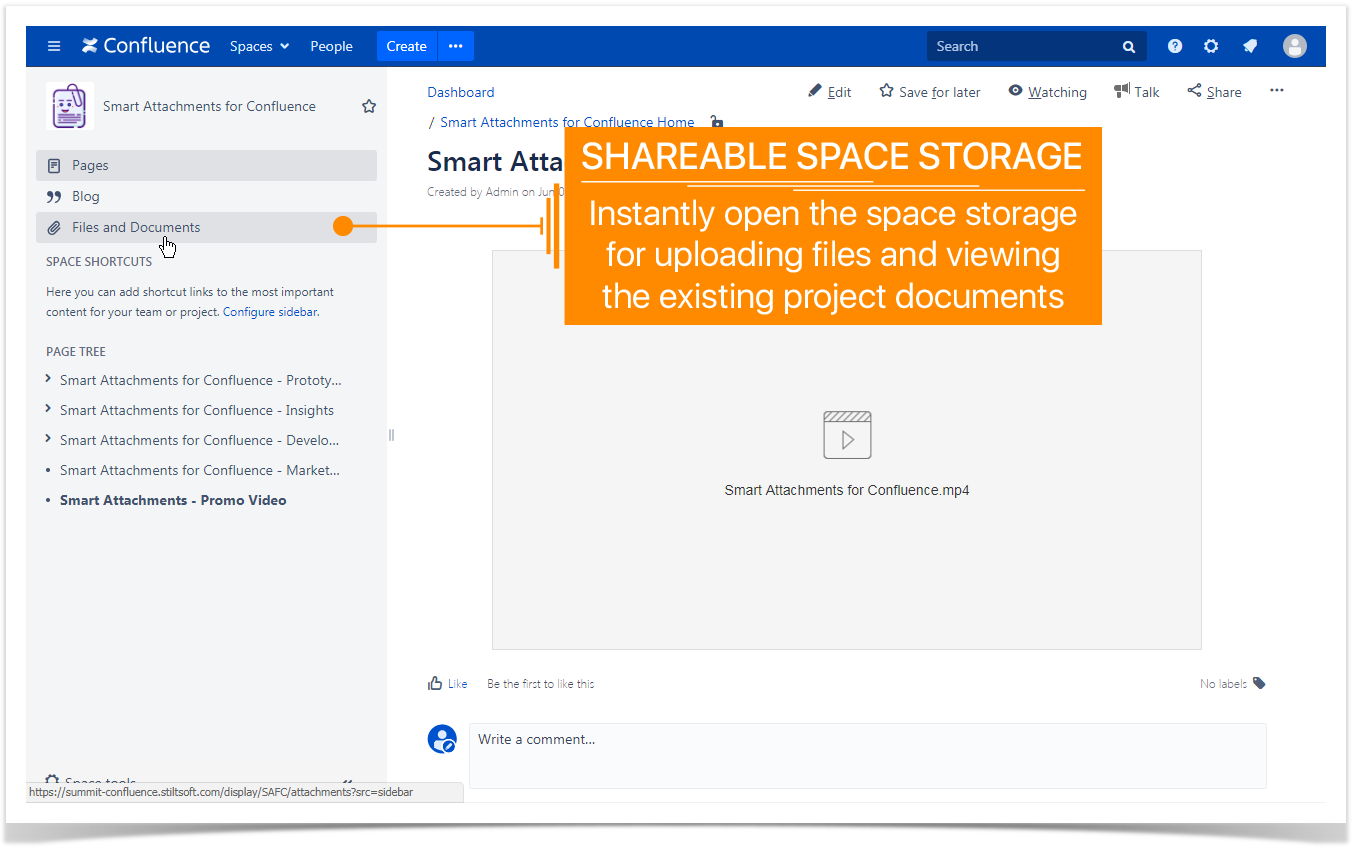
          Shareable space storages

          People who are actively attaching files to Confluence pages, after a short period of time usually encounter a problem of finding the right attachment. They need to browse through Confluence pages or search for a specific file in Confluence. The problem grows extremely faster when multiple team members are adding files.

          Just for such cases we have created the solution which allows you to have a centralized space storage shared across your whole team. Instead of keeping your important project files across different pages, you can store them in dedicated folders and reference these files on the appropriate pages in Confluence.

          shareable space storage confluence attachments 1

          Now you can keep all your plans, reports, reviews, presentations, and other documents in one shareable place.

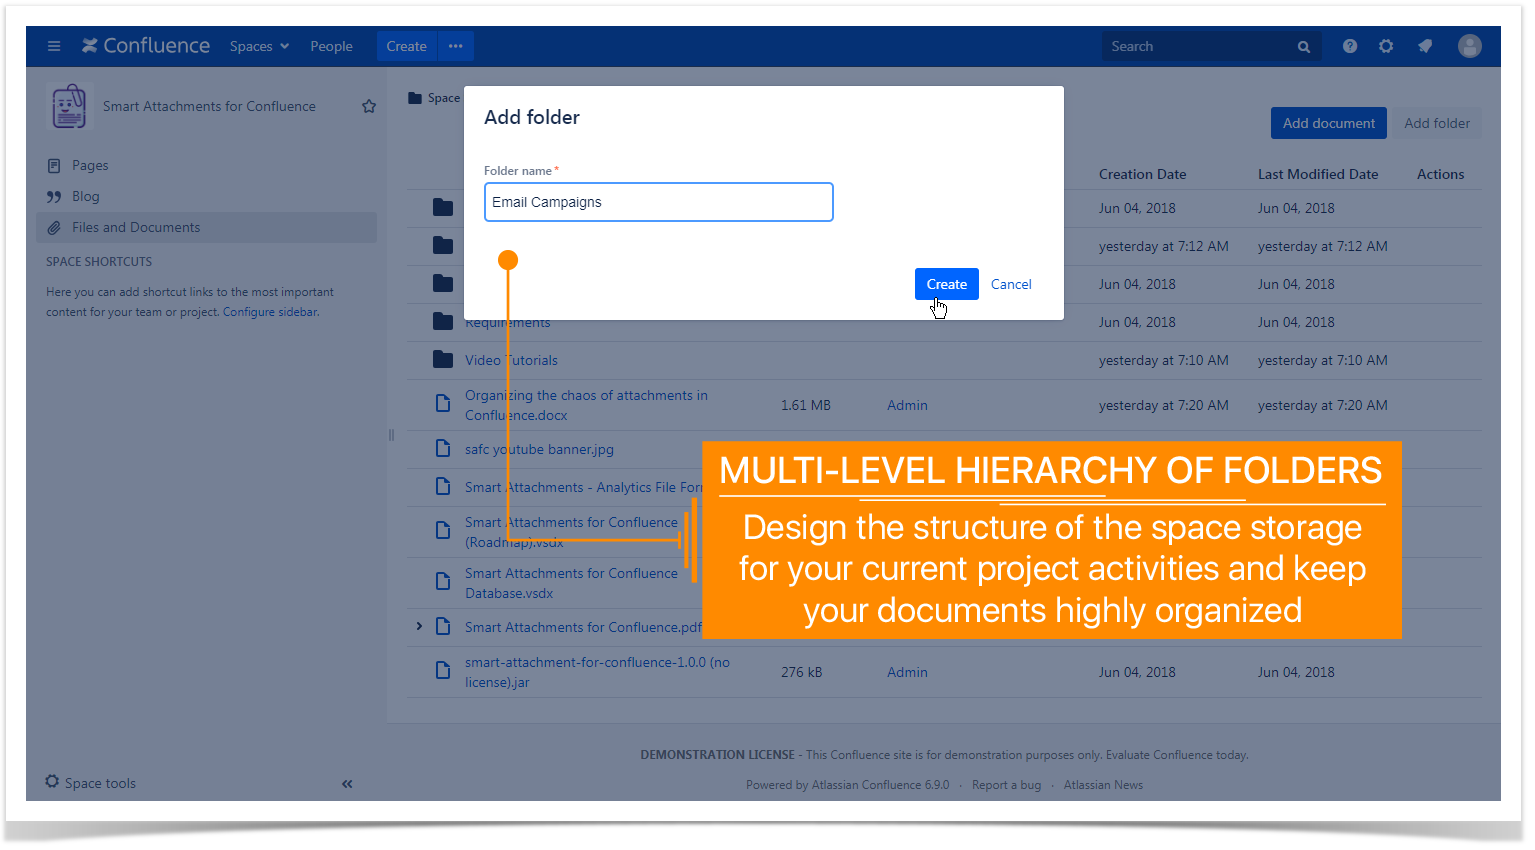
          Multi-level folder structure

          Get used to standard folder structure of your operating system? Do the same in Confluence. Create multiple levels for storing your project artifacts, design files, promotion materials, documentation guides, and other files needed for successful accomplishment of your project.

          multilevel folder heirarchy confluence

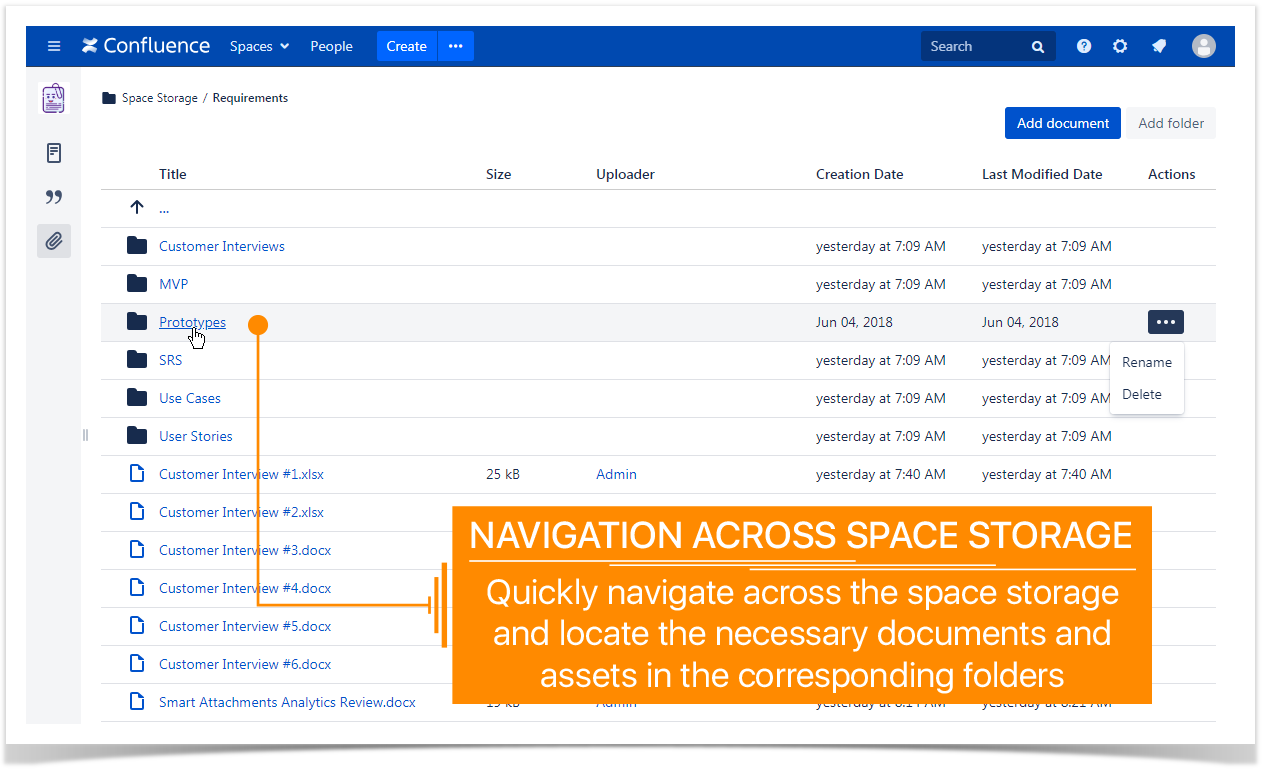
          Quickly navigate across your folders and add new folders wherever needed for keeping your files in hierarchy.

          navigation across folders with attachments

          Comprehensive control over documents and revisions

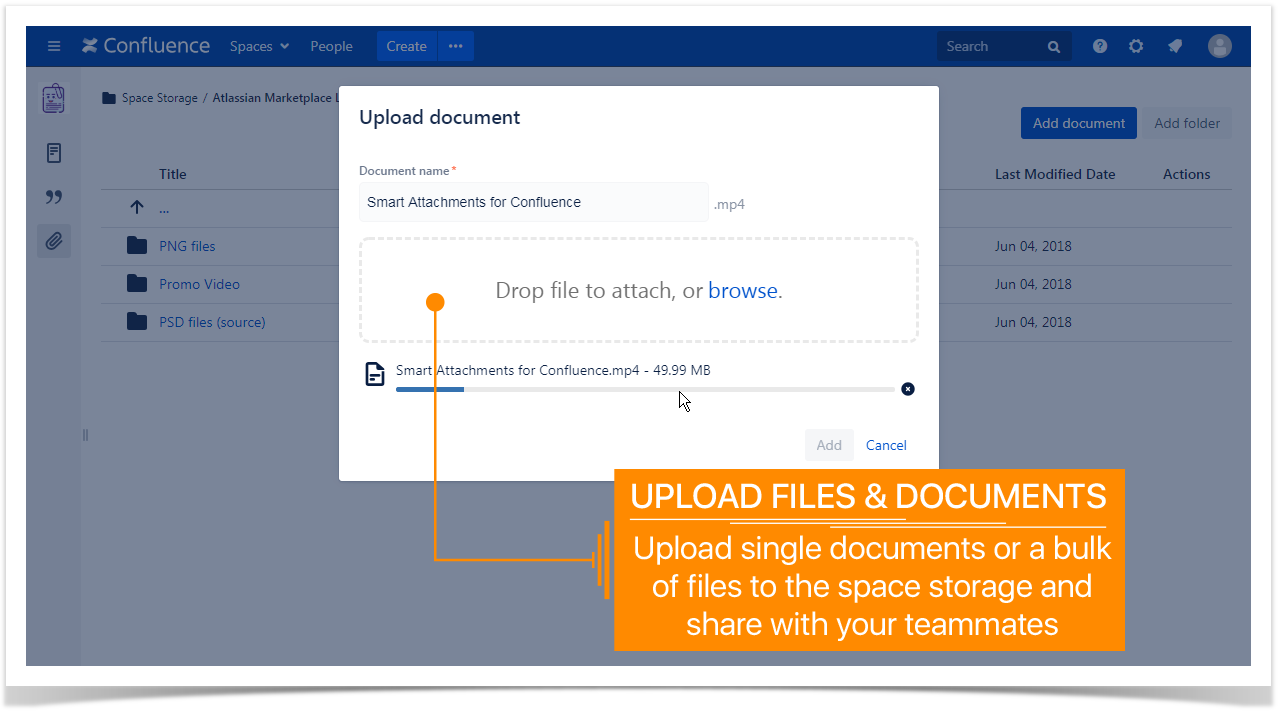
          Upload single documents or a bulk of files into the appropriate folder by drag-n-drop. Instantly locate the necessary files in folders and use them for running your project activities.

          upload files and documents

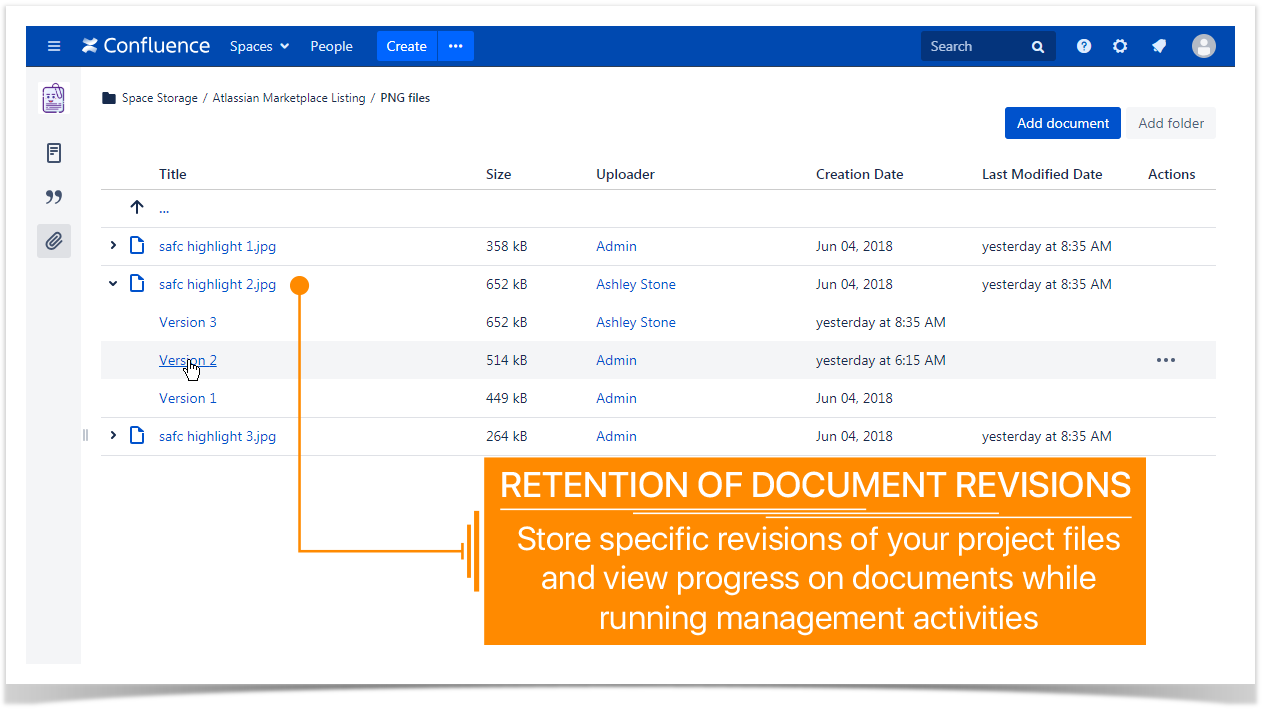
          Keep track of specific document revisions and get back to the appropriate version at once.

          retention document revisions confluence

          Embedding documents and assets into Confluence pages

          Use the already uploaded project documents and files and quickly integrate them into your Confluence pages. Add links to specific folders and artifacts and collaborate on them with your teammates.

          Start a free trial of the app right now and take your experience with attachments in Confluence to the next level.

          Related posts