Collaboration on Backlog With External Users in Jira

You can find a lot of information about how team collaboration delivers results and helps organizations meet their goals. At the same time, companies should not overlook their collaboration with customers and partners. This type of cooperation refers to the way a company uses customer feedback to improve its performance, service, and products.
In this blog post, we will highlight different solutions that will help you share Jira projects, collaborate on backlog, and effectively interact with your external users (clients, contractors, partners, or colleagues from other departments).
Issue overview
For example, your company is looking for new opportunities to collaborate with your customers on your current projects in Jira.
As a project manager, you have a lot of projects with different customers. Some of your clients are rival companies. This means that you do not want them to know about each other so that they could access only their projects. At the same time, you also cooperate with your colleagues from other departments that are non-Jira users.
Of course, you want to keep all the required information in a single well-prioritized backlog. Because by always working in priority order in the same Jira instance, your team can maximize the value of the product or service being developed.
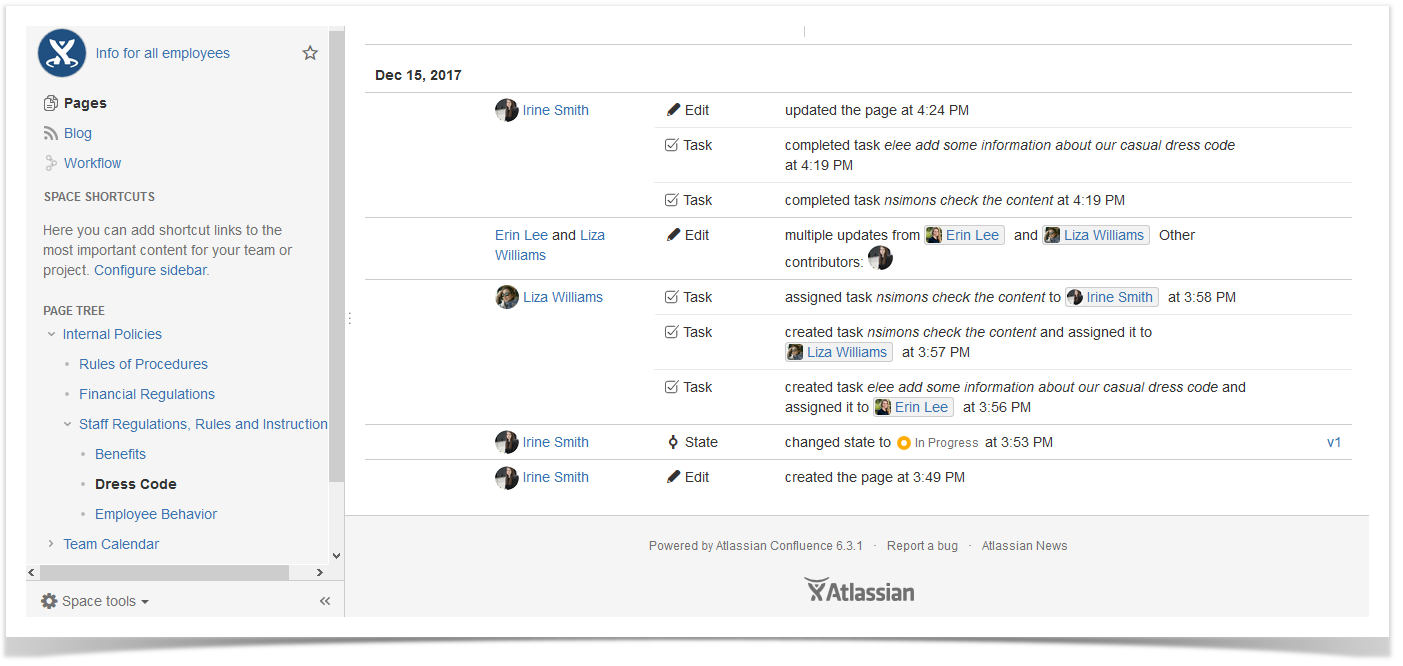
You want to get timely feedback from your colleagues and customers to optimize everyone’s workload and product delivery.
So the key takeaways are the following:
- Collaborate on your projects together with external users in your Jira instance.
- Allow your customers/partners to create new issues, prioritize them, and share ideas with non-Jira users.
- Get input and feedback from customers, stakeholders, and partners right in Jira.
Now let’s find the best solution to this challenging task.
Options to choose from
Shared instance in Jira
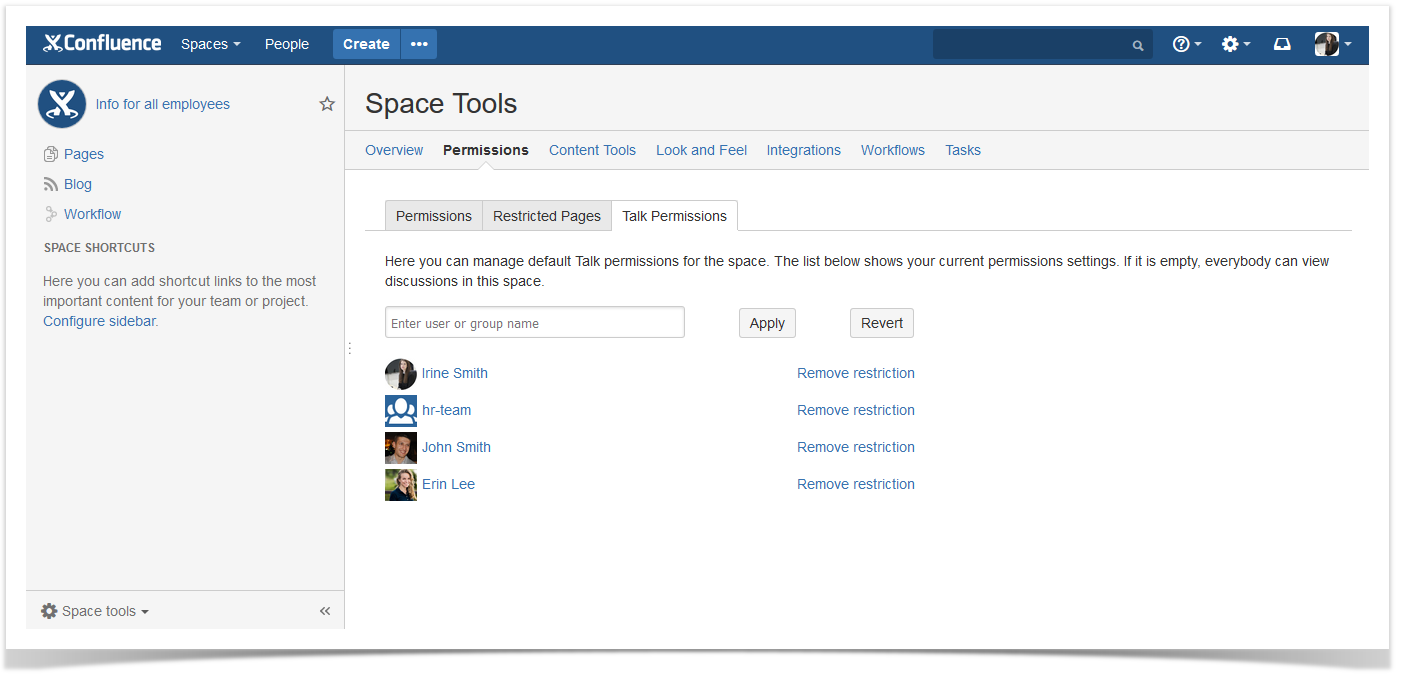
If you want to give your clients access to the work stream, you can create a shared Jira instance. Given how much sensitive information can be kept in your Jira instance, the first thing you need to do is to make sure that your system is as secure as possible.
Your Jira administrator will need to think over the structure of your projects, create groups and roles for all the external users, and more.
However, making each customer a new Jira user can be not very scalable for some companies. Except that you’d need to administer your Jira for external users, every user of your shared Jira instance will count towards the Jira license.
Jira support & feedback forums
Another solution is to install the Customer Case app for Jira Cloud that allows you to communicate with external users or within departments via web portal or by email. This app helps you facilitate external collaboration through ticketing, backlog sharing without making each customer a licensed Jira user.
The Customer Case add-on allows you to manage the interaction of external users between themselves and with internal Jira users.
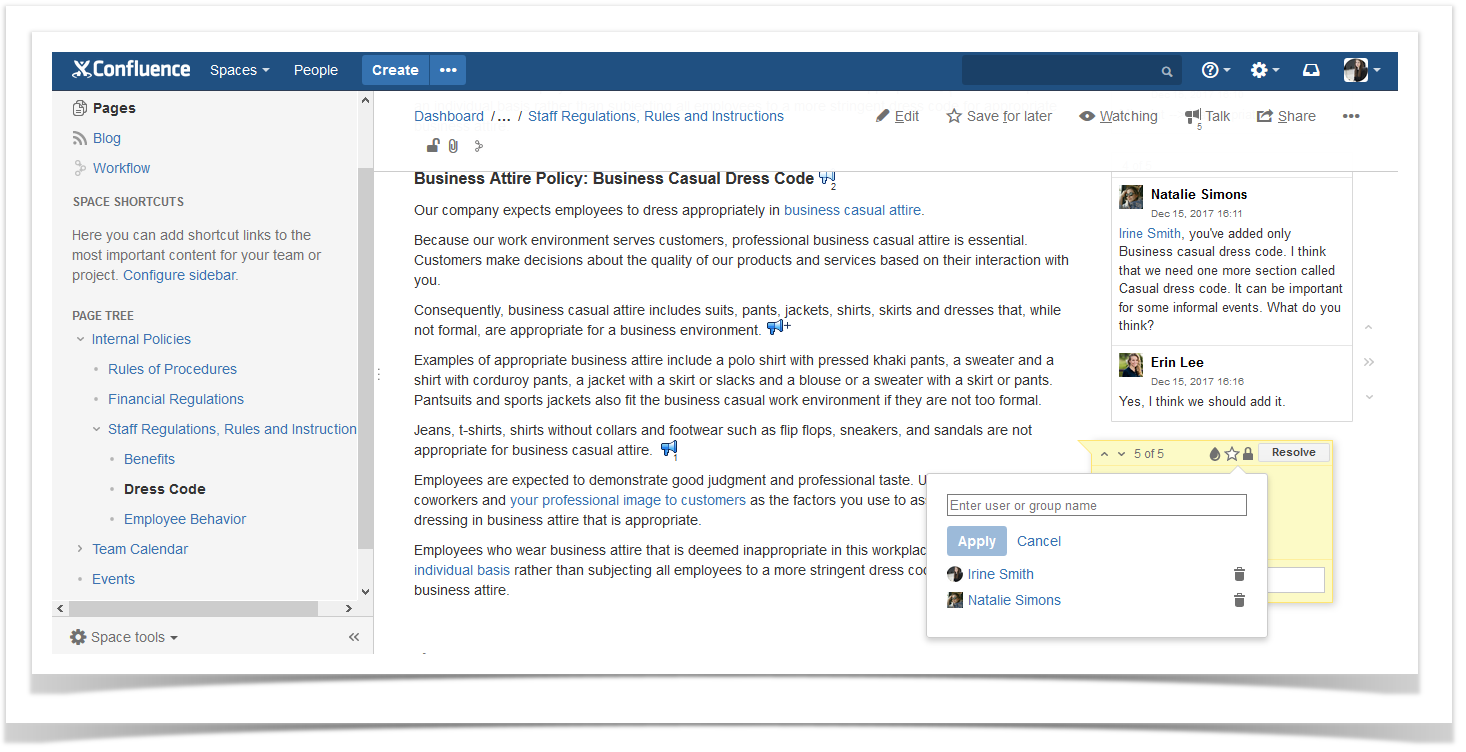
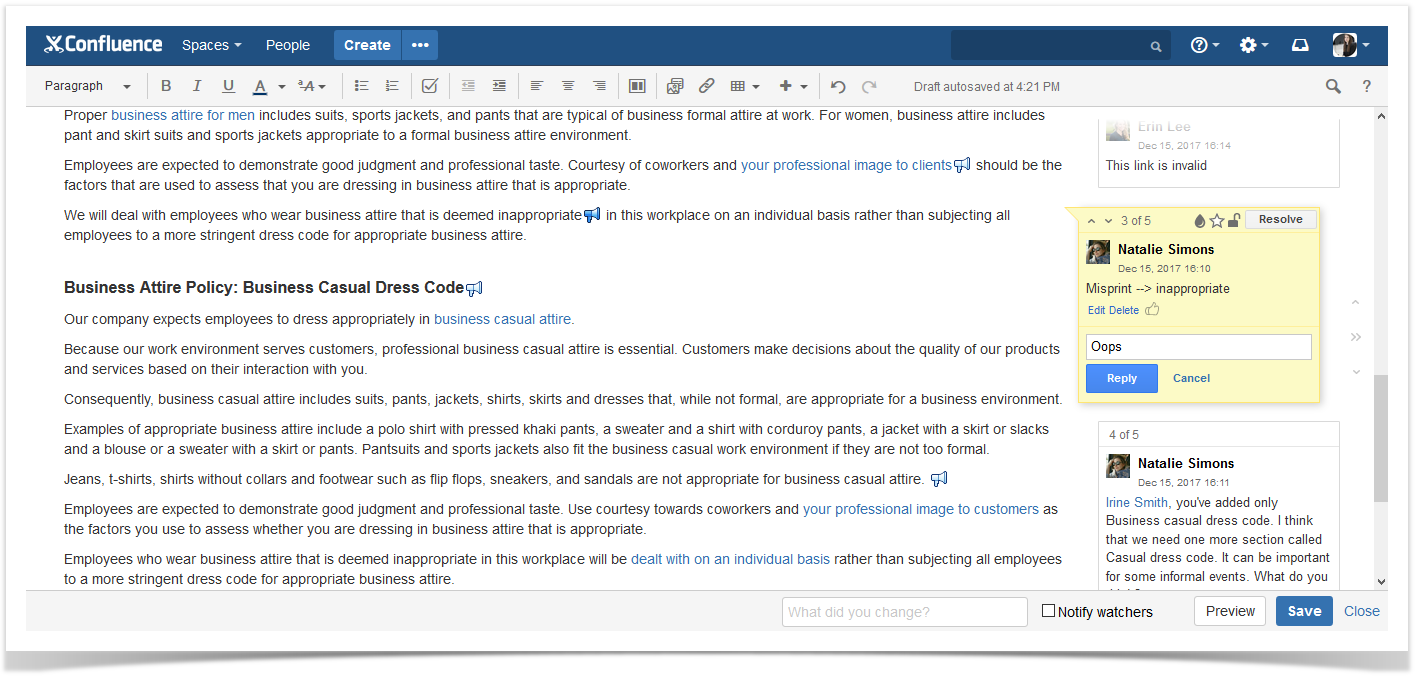
Your customers can discuss the existing ideas and add new ones. They just need to sign in with the help of their Google, Facebook, or Jira accounts. Your team will get notifications about any issues your clients experience with your products or services.
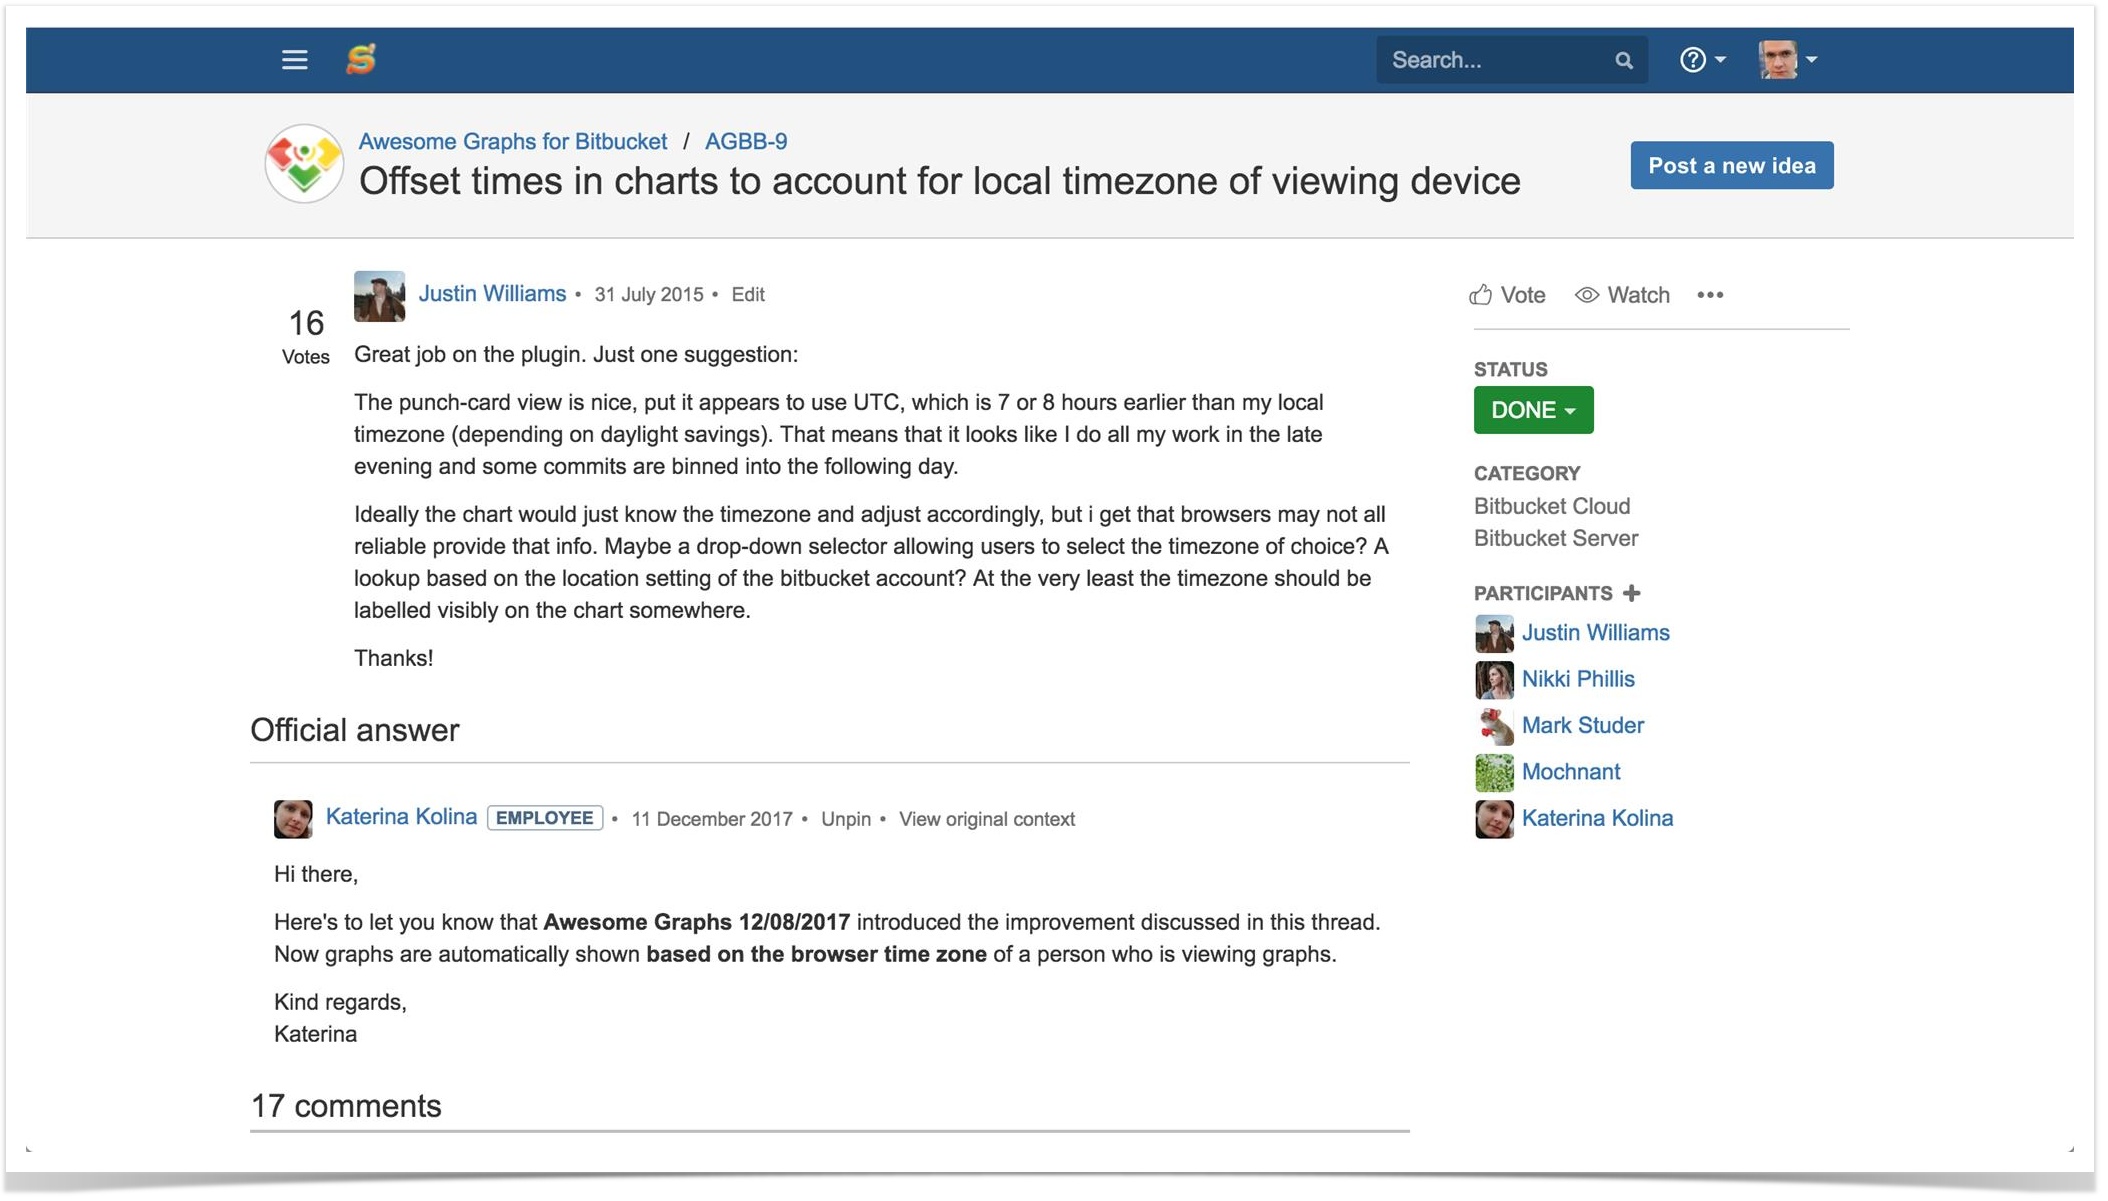
You can create private or public forums for your clients, colleagues, and contractors. Any user can post new ideas to the public forum, vote for the existing ideas, comment and watch them. Users can also sort ideas by status, priority, and popularity.
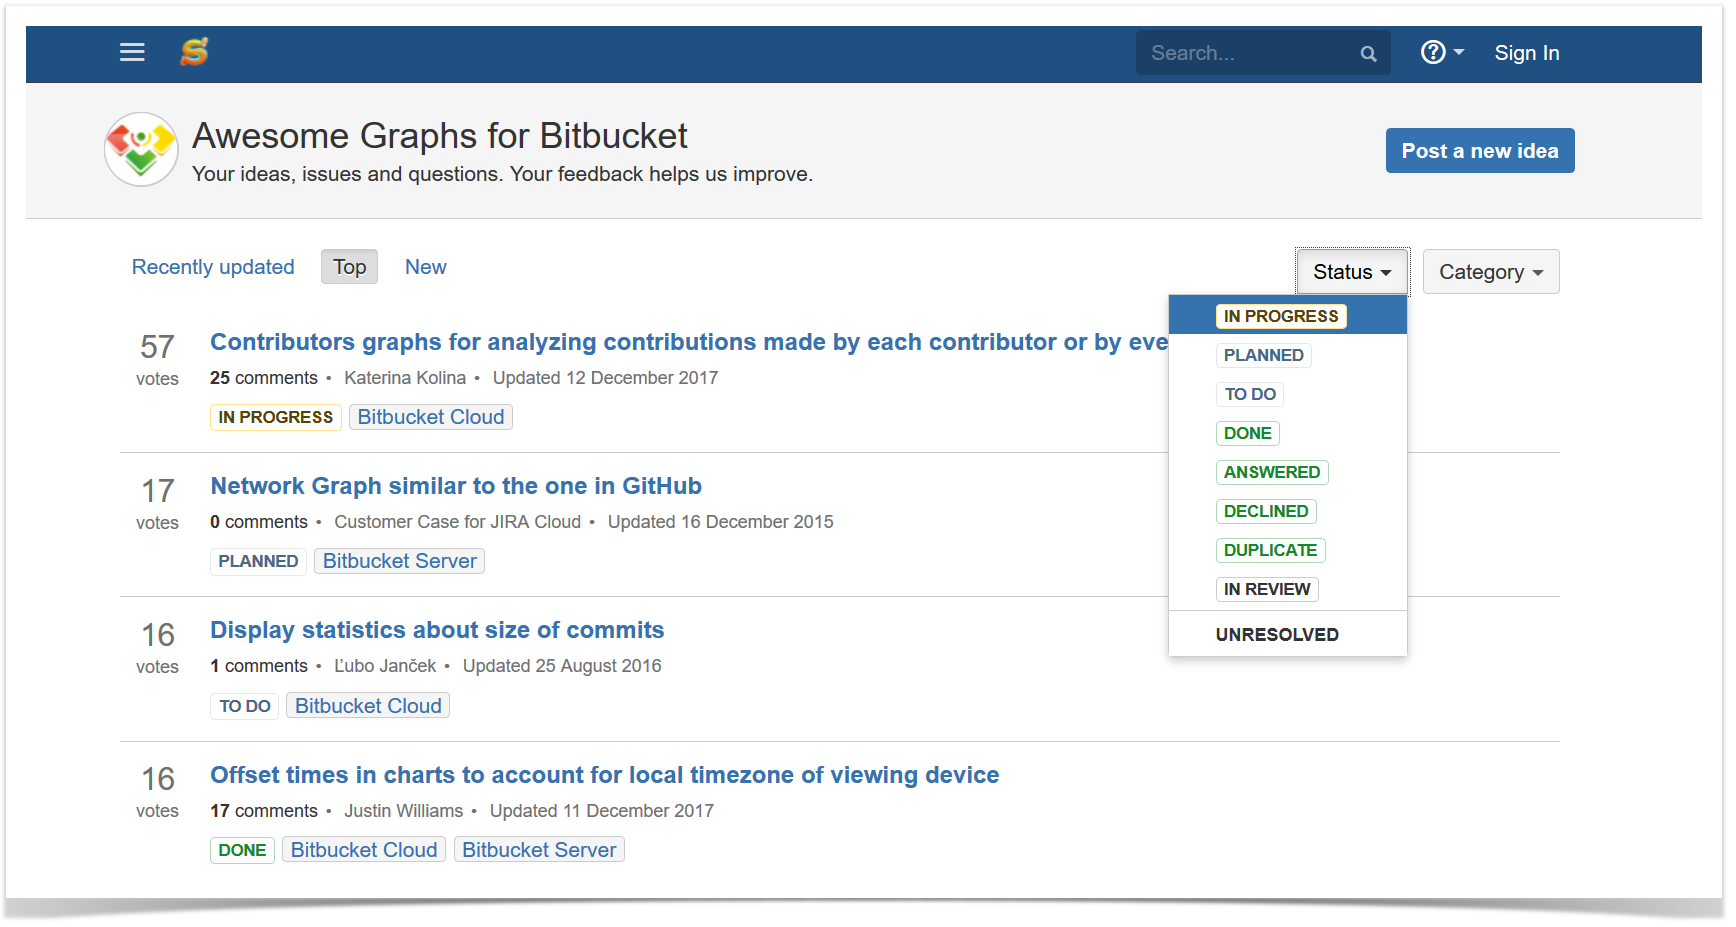
If you want to receive feedback on the same product from several rival companies, you can create a separate private forum for each company. Your clients can easily work with ideas using Jira or Customer Case portals.
So Customer Case – Jira Support & Feedback allows you to organize the interaction with your external users avoiding issues with Jira administration and licensing.
Jira Service Desk capabilities
With Jira Service Desk, your team can take your customer service to a whole new level.
This solution provides you with bundled customer service templates, built-in email support, and suggested business automation rules.
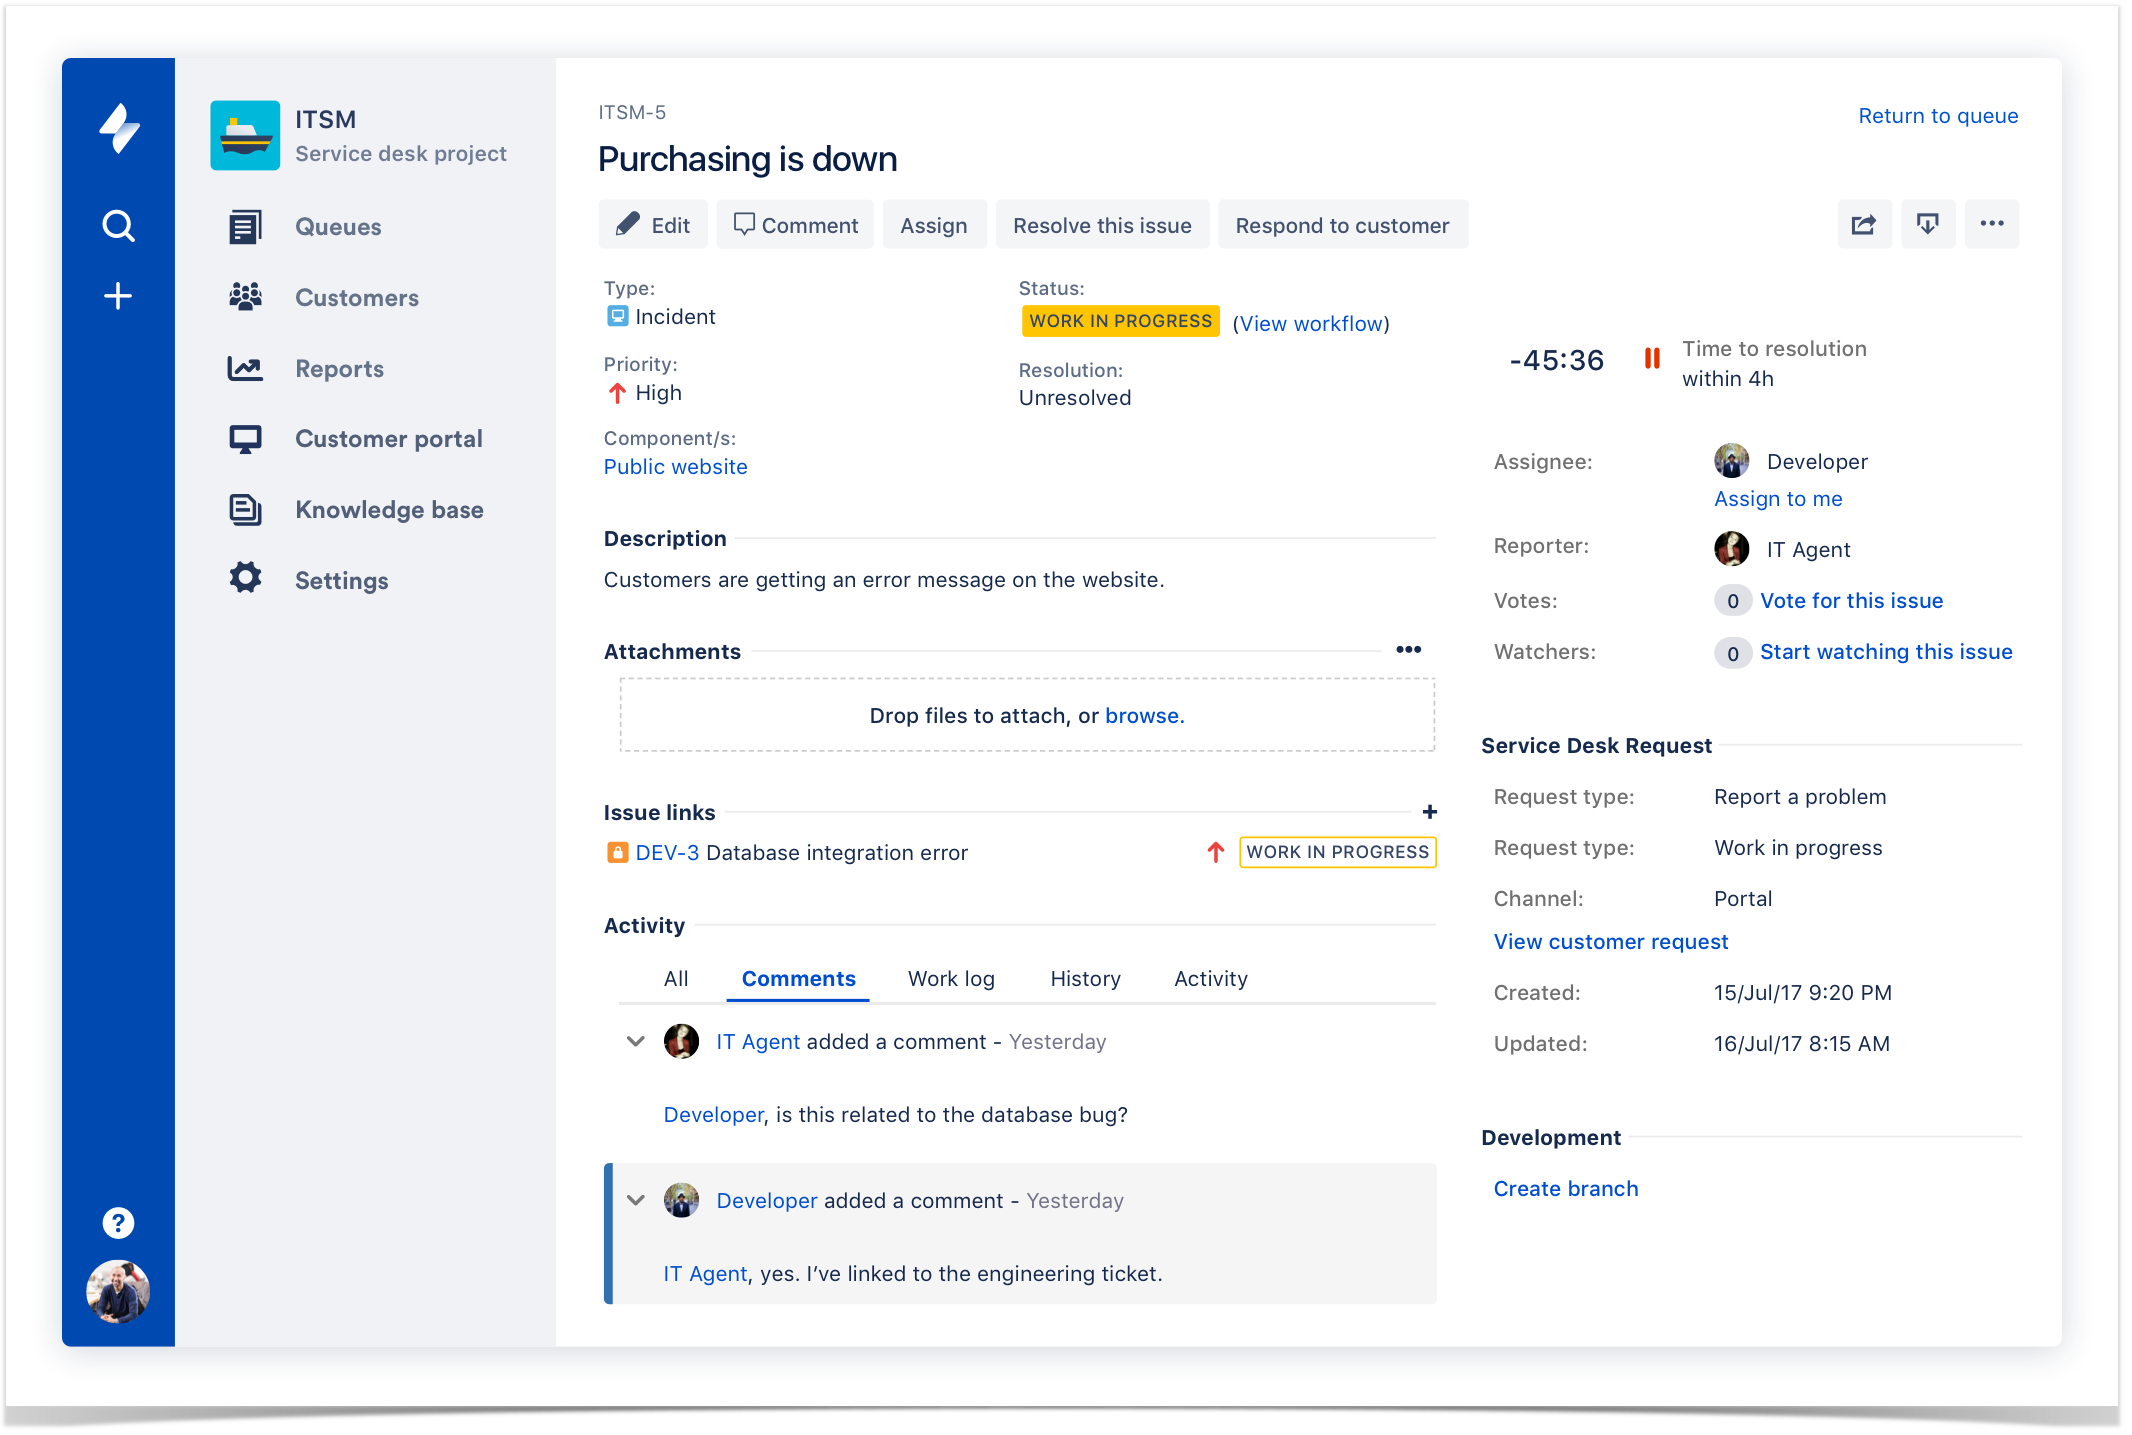
You can group customers from one company by their domain and create a private portal to get timely feedback from them. So your clients from this company can easily share information with each other. However, Jira Service Desk might not be suitable for gathering customer feedback and collaboration on requests from users of public projects (where users can not be grouped).
Jira Service Desk integrates with Jira Software and Confluence that extends the functionality of your customer service portal. However, some organizations may find its pricing a bit high.
Resume
If you organize the process of collecting feedback with the help of a shared Jira instance, your business will benefit. However, your administrator needs to make sure that everything behind the scenes is running smoothly when it comes to permissions and licensing issues.
Customer Case – Jira Support & Feedback enables gathering valuable information from external and internal users that can interact with each other in many ways. It can be helpful both for your private and public projects.
Jira Service Desk is a useful solution for the companies that interact with the employees of their partners or contractors and can easily share their tasks and ideas with each other.
Of course, it’s up to you to decide which of the suggested options to choose from.
Please, tell us about your way to get feedback from your external users. You may also ask us any questions you have about Jira Service Desk and Customer Case for Jira Cloud. Feel free to comment below.