How to Assess Software Developers in Confluence: Easy Guide for HR

Understanding your skills is vital both for the employee and the HR. Your professional level influences your tasks and responsibilities, but also your income level and your position in a team.
While many methods help HRs draw the line between Middle and Senior software engineers, you can name a few hard and soft skills that are crucial in understanding the level of a particular team member.
We want to show you a simple way to assess each employee using the tools available in Confluence.
Middle vs. Senior
HRs can consider a few parameters while estimating the developer’s level.
Clear code, testing, quality control
A Middle developer writes functional and efficient code, which is less clear and consistent than the senior developer’s. Middles write basic tests, while Seniors make tests broader, including unconventional scenarios.
Middles can participate in code review, but Seniors must give clear and constructive feedback.
Communication with stakeholders
Middles can know the stakeholders and their expectations without going into details. They communicate with stakeholders to receive certain requirements or opinions, but they don’t manage the expectations of the parties concerned.
Senior engineers communicate with stakeholders efficiently and understand their demands, goals, and issues. They can also manage business requirements and negotiate the work, the time, the price, and the quality.
Understanding of system architecture
Middle developers understand system architecture just enough to work with existing architectural patterns but don’t make any architecture-related decisions.
Seniors have a deep and broad understanding of the project’s system architecture. They can design scalable, safe, and sustainable solutions aligning with business and technical requirements. Seniors can document and aggregate their solutions for other engineers and business representatives.
Critical thinking and problem-solving
Middle engineers regularly solve simple issues using safe and trusted methods. They can apply their knowledge and skills to familiar situations and let Seniors handle new and unexpected problems.
Seniors demonstrate high critical thinking and can analyze, estimate, and synthesize information to adapt to ever-changing requirements. They can solve complex issues using logical, creative, or systemic approaches.
System design knowledge
Middle engineers usually only see part of the picture. They rarely notice connections between several problems and try to solve them separately.
To design complex yet safe systems, Seniors must understand system design and explain their architectural decisions to subordinate team members.
Communication within a team
While team communication is equally essential for a developer of any level, some things distinguish Seniors from Middles. Middle engineers communicate with a team to clarify the goals and keep up-to-date with project dynamics.
Seniors get more involved in the processes and are more proactive. They monitor the progress of other developers and can offer help or advice if needed.
How to assess software engineers in Confluence
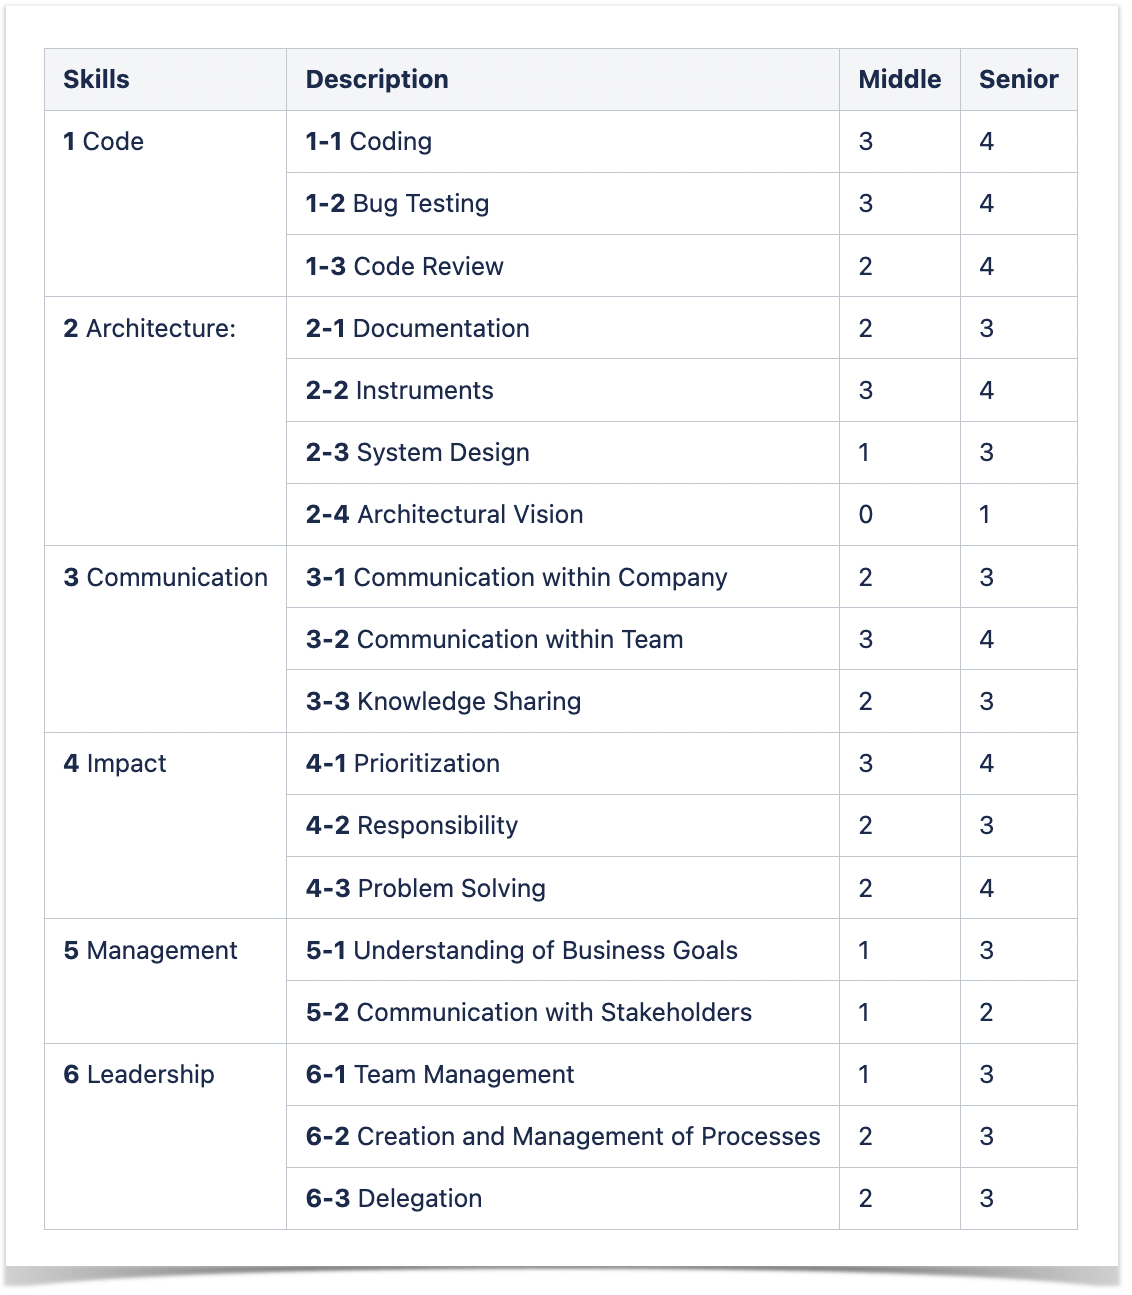
To distinguish your developers by their level, you first need to understand their proficiency in each skill. You can use the list of the skills above to create a matrix. If needed, go into even more detail and break down each skill into more particular abilities or regroup the skills in a way that suits you better.
Set a minimum score for each skill for the Middle and Senior levels. A simple 0-5 system is enough in this case.
Now, assess the skills of each team member.
This is the moment when third-party apps come in handy. We’ll show you how to automate the assessment process with the help of the Table Filter, Charts & Spreadsheets for Confluence app.
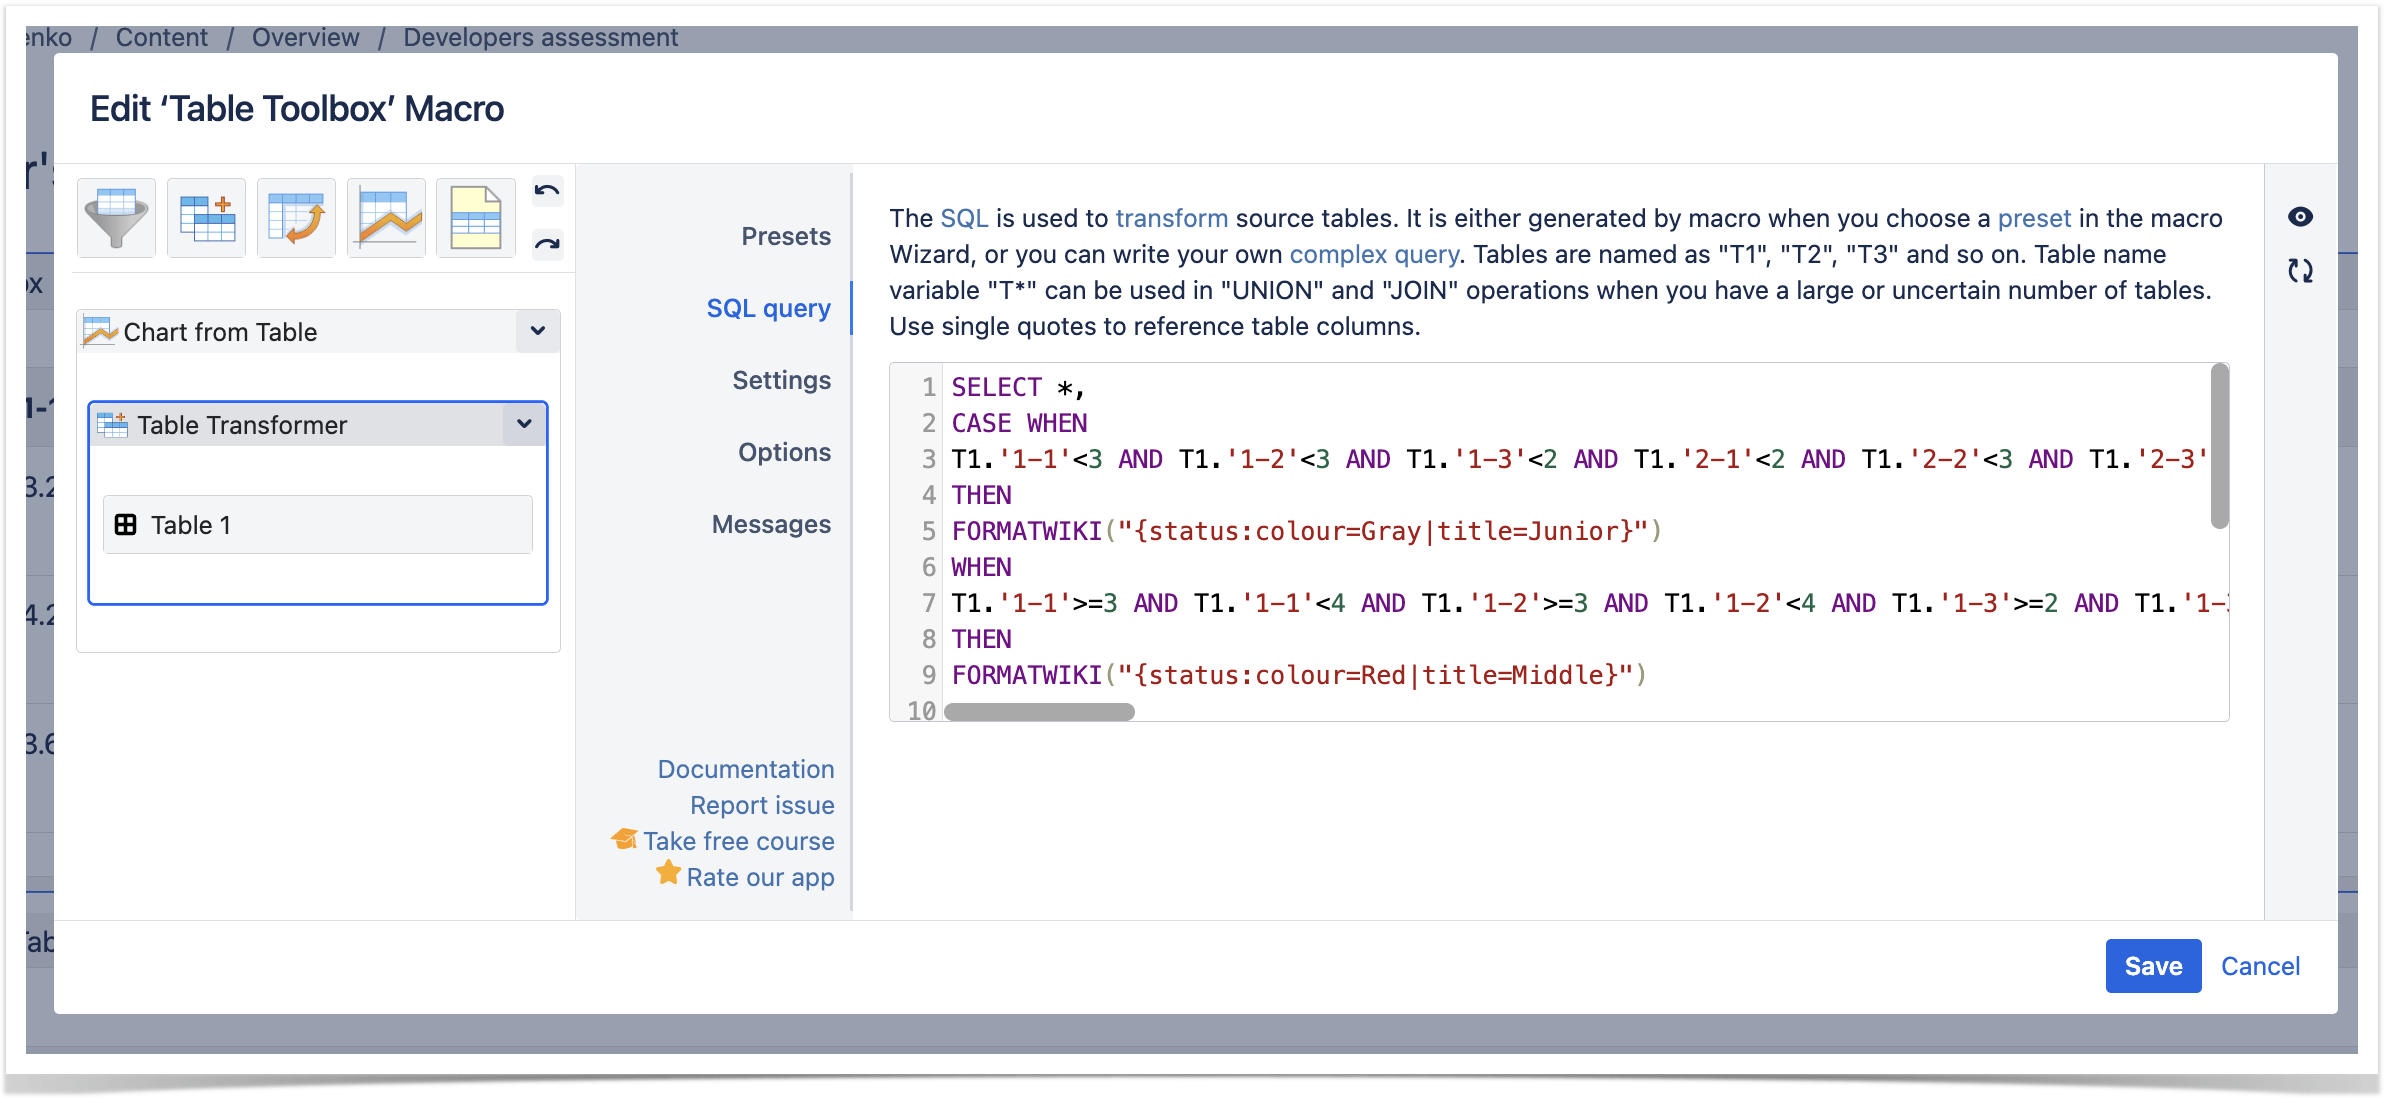
After you fill the table with scores for each employee, you can wrap it up into the Table Transformer macro. With its help, you don’t have to count the results manually – instead, it will perform the calculations and automatically assign a relevant status depending on the outcome.
The macro requires writing a simple SQL query.
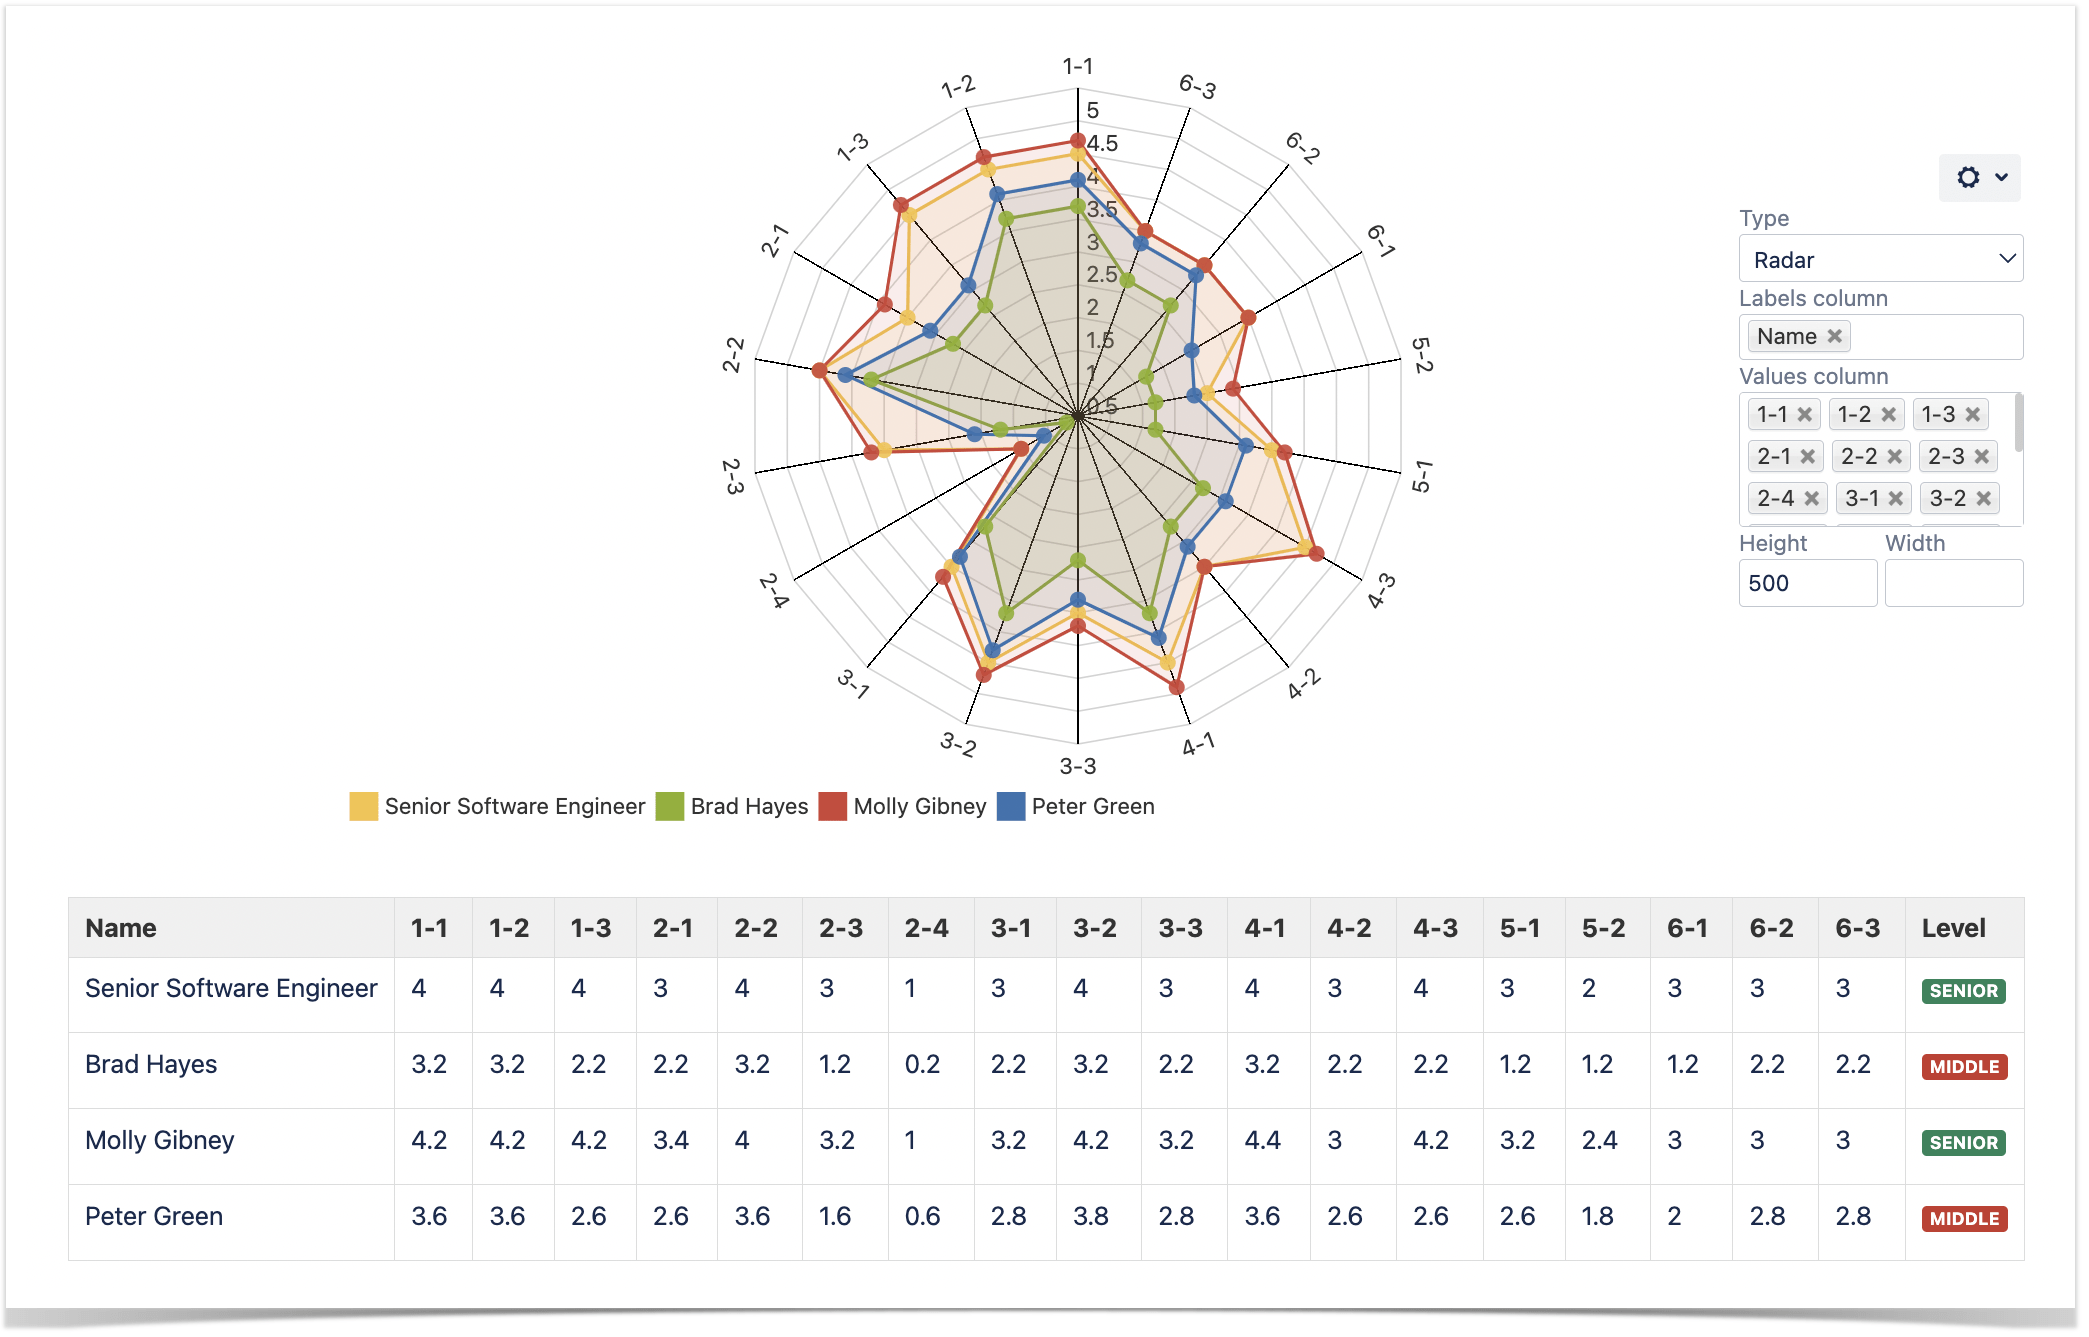
To see the distribution of skills and the differences in level more clearly, build a radar chart. The Chart from Table macro bases the look of the chart on the data from the table. Visualizing table data can help you analyze the skillset of each employee better and understand the path for their future development.
If you work in Confluence Cloud, use the Table Toolbox macro to combine Table Transformer and Chart from Table.
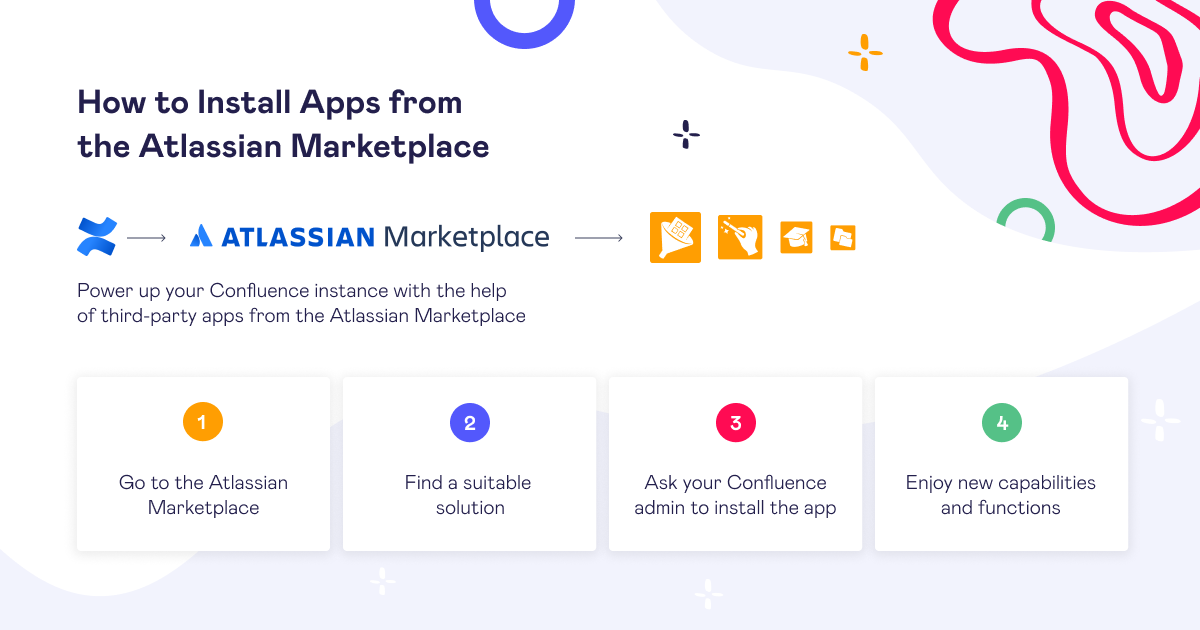
If you want to assess your employees in Confluence with the help of the Table Filter, Charts & Spreadsheets app, you can get it from the Atlassian Marketplace by following the instructions below.
Don’t hesitate to contact us with any questions or ideas.


