Excel vs. Confluence Tables: Five Reasons to Switch
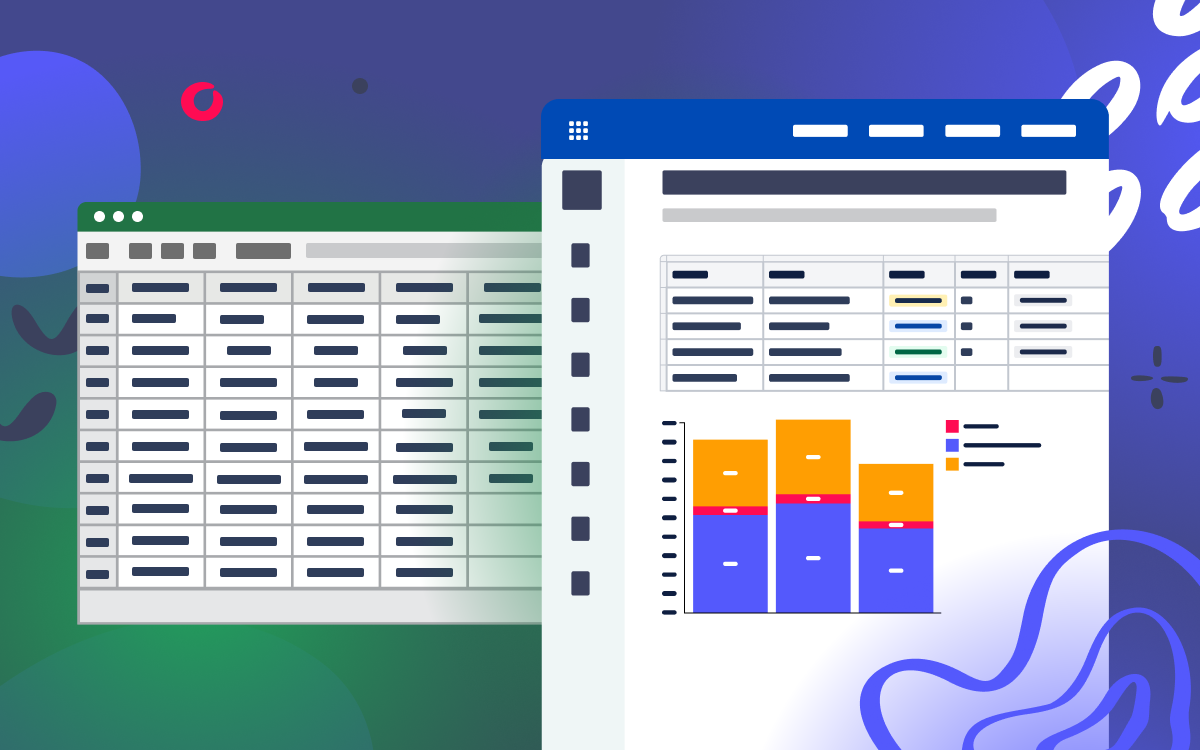
As companies develop and their teams grow, adjusting to the new processes becomes vital. Optimizing a workspace and workflow influences productivity, allows more efficient data sharing, and increases transparency.
Confluence covers most of the aspects needed to plan and organize your work effectively. But many companies use Excel or Google Sheets as the primary tool for creating tables. Though these instruments are great for personal usage or smaller teams, there are still many peculiarities, making them inconvenient for collective work. And that can be a huge disadvantage for a company, considering the amount of time and effort it consumes.
Confluence is a convenient workspace that helps you get the job done. This article will compare MS Excel, Google Sheets, and Confluence tables on several parameters:
- Why sharing information is more practical in Confluence.
- How to analyze and visualize data in one click.
- How to transfer your data to Confluence if you have used other tools before.
Why switch to Confluence
Here is why switching to Confluence tables from MS Excel and Google Sheets is a good idea.
1. Time-efficient process of sharing information
If you work with Excel, you know how time-consuming it can be to share data with colleagues. If you have a subscription or use SharePoint, working together on the same spreadsheet is easy. Otherwise, you need to send the document you are working on to your co-worker and then expect the file back. There are more convenient ways to work on the task together.
With Google Sheets, it’s easier – you only need to share the document link. But you also have to grant some of your colleagues a certain kind of access. And if you give access to anyone on the internet with the link, the data can eventually get into the wrong hands.
Confluence is a collaboration tool that helps organize a workspace and store data, so you can easily share any information with your team. Your colleagues will find the required tables in the corresponding space. You can limit access to the pages for specific users, but generally, everyone who can access the space can view the data.
2. Collaboration
As it follows from the previous section, collaboration in MS Excel or Google Sheets is not always possible. If a few people work on the same document using Excel, they can’t add new data simultaneously. It comes to exporting and sending the document again, so it takes a lot of time for all the colleagues to commit and get the job done.
With Confluence, all of the teammates share the same workspace. If working on the same task is requested, it is possible to join a space simultaneously and make changes or add anything, thanks to collaborative editing.
3. Page history
There are some situations where you need to restore the information to the state it used to be before the changes. With Excel files, it is just not possible. Once you finish working on the document, save it and send it to your colleague, there is no way of returning to the previous version.
Google Sheets lets you look through the page history and see the changes. But usually, it is time- and energy-consuming to find the necessary version. If your internet connection fails at some point, Google Sheets won’t save the changes at all.
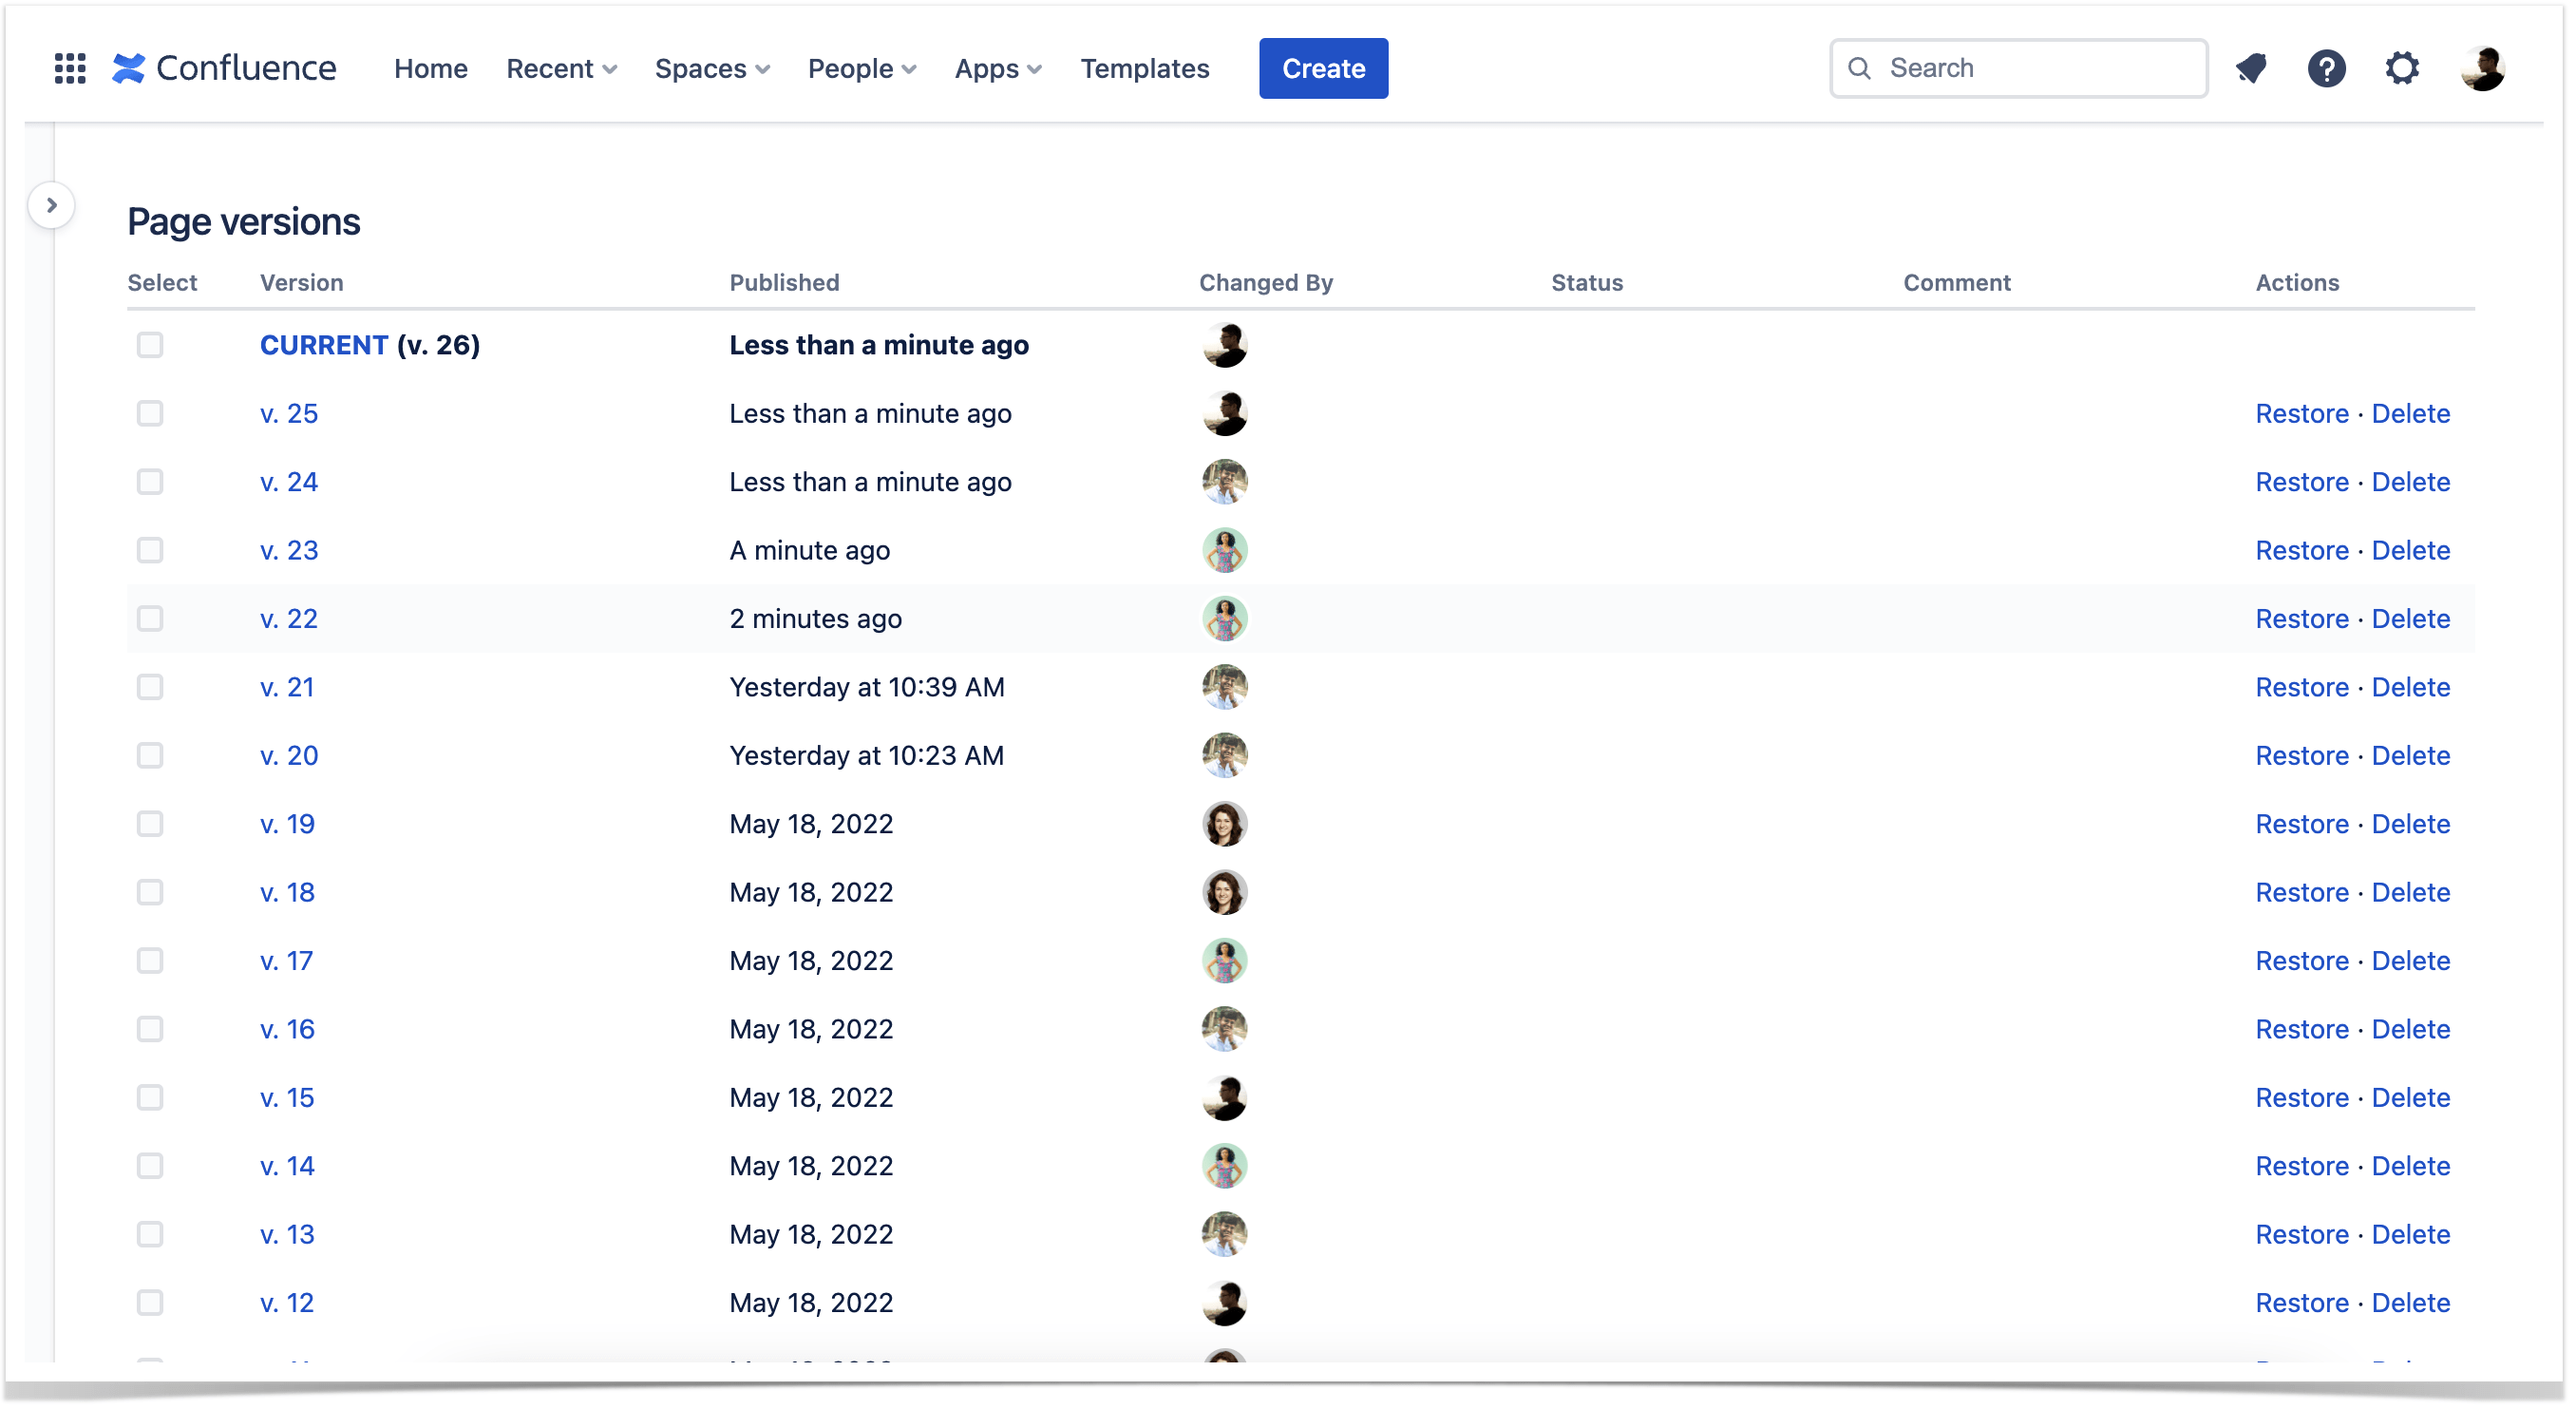
Working with Confluence, you have access to the page history. It is easy to find in the view mode in the toolbar menu. You can easily track any change made to the content and correct the page if an important piece is lost or easily compare two chosen versions.
4. Creating tables
The replacement of MS Excel or Google Sheets should help users create tables and work with them on the fly. If you need to transfer the data you have in various files to your current workspace, Confluence will help you with no effort.
There are a few methods of creating tables in Confluence without exporting to Excel.
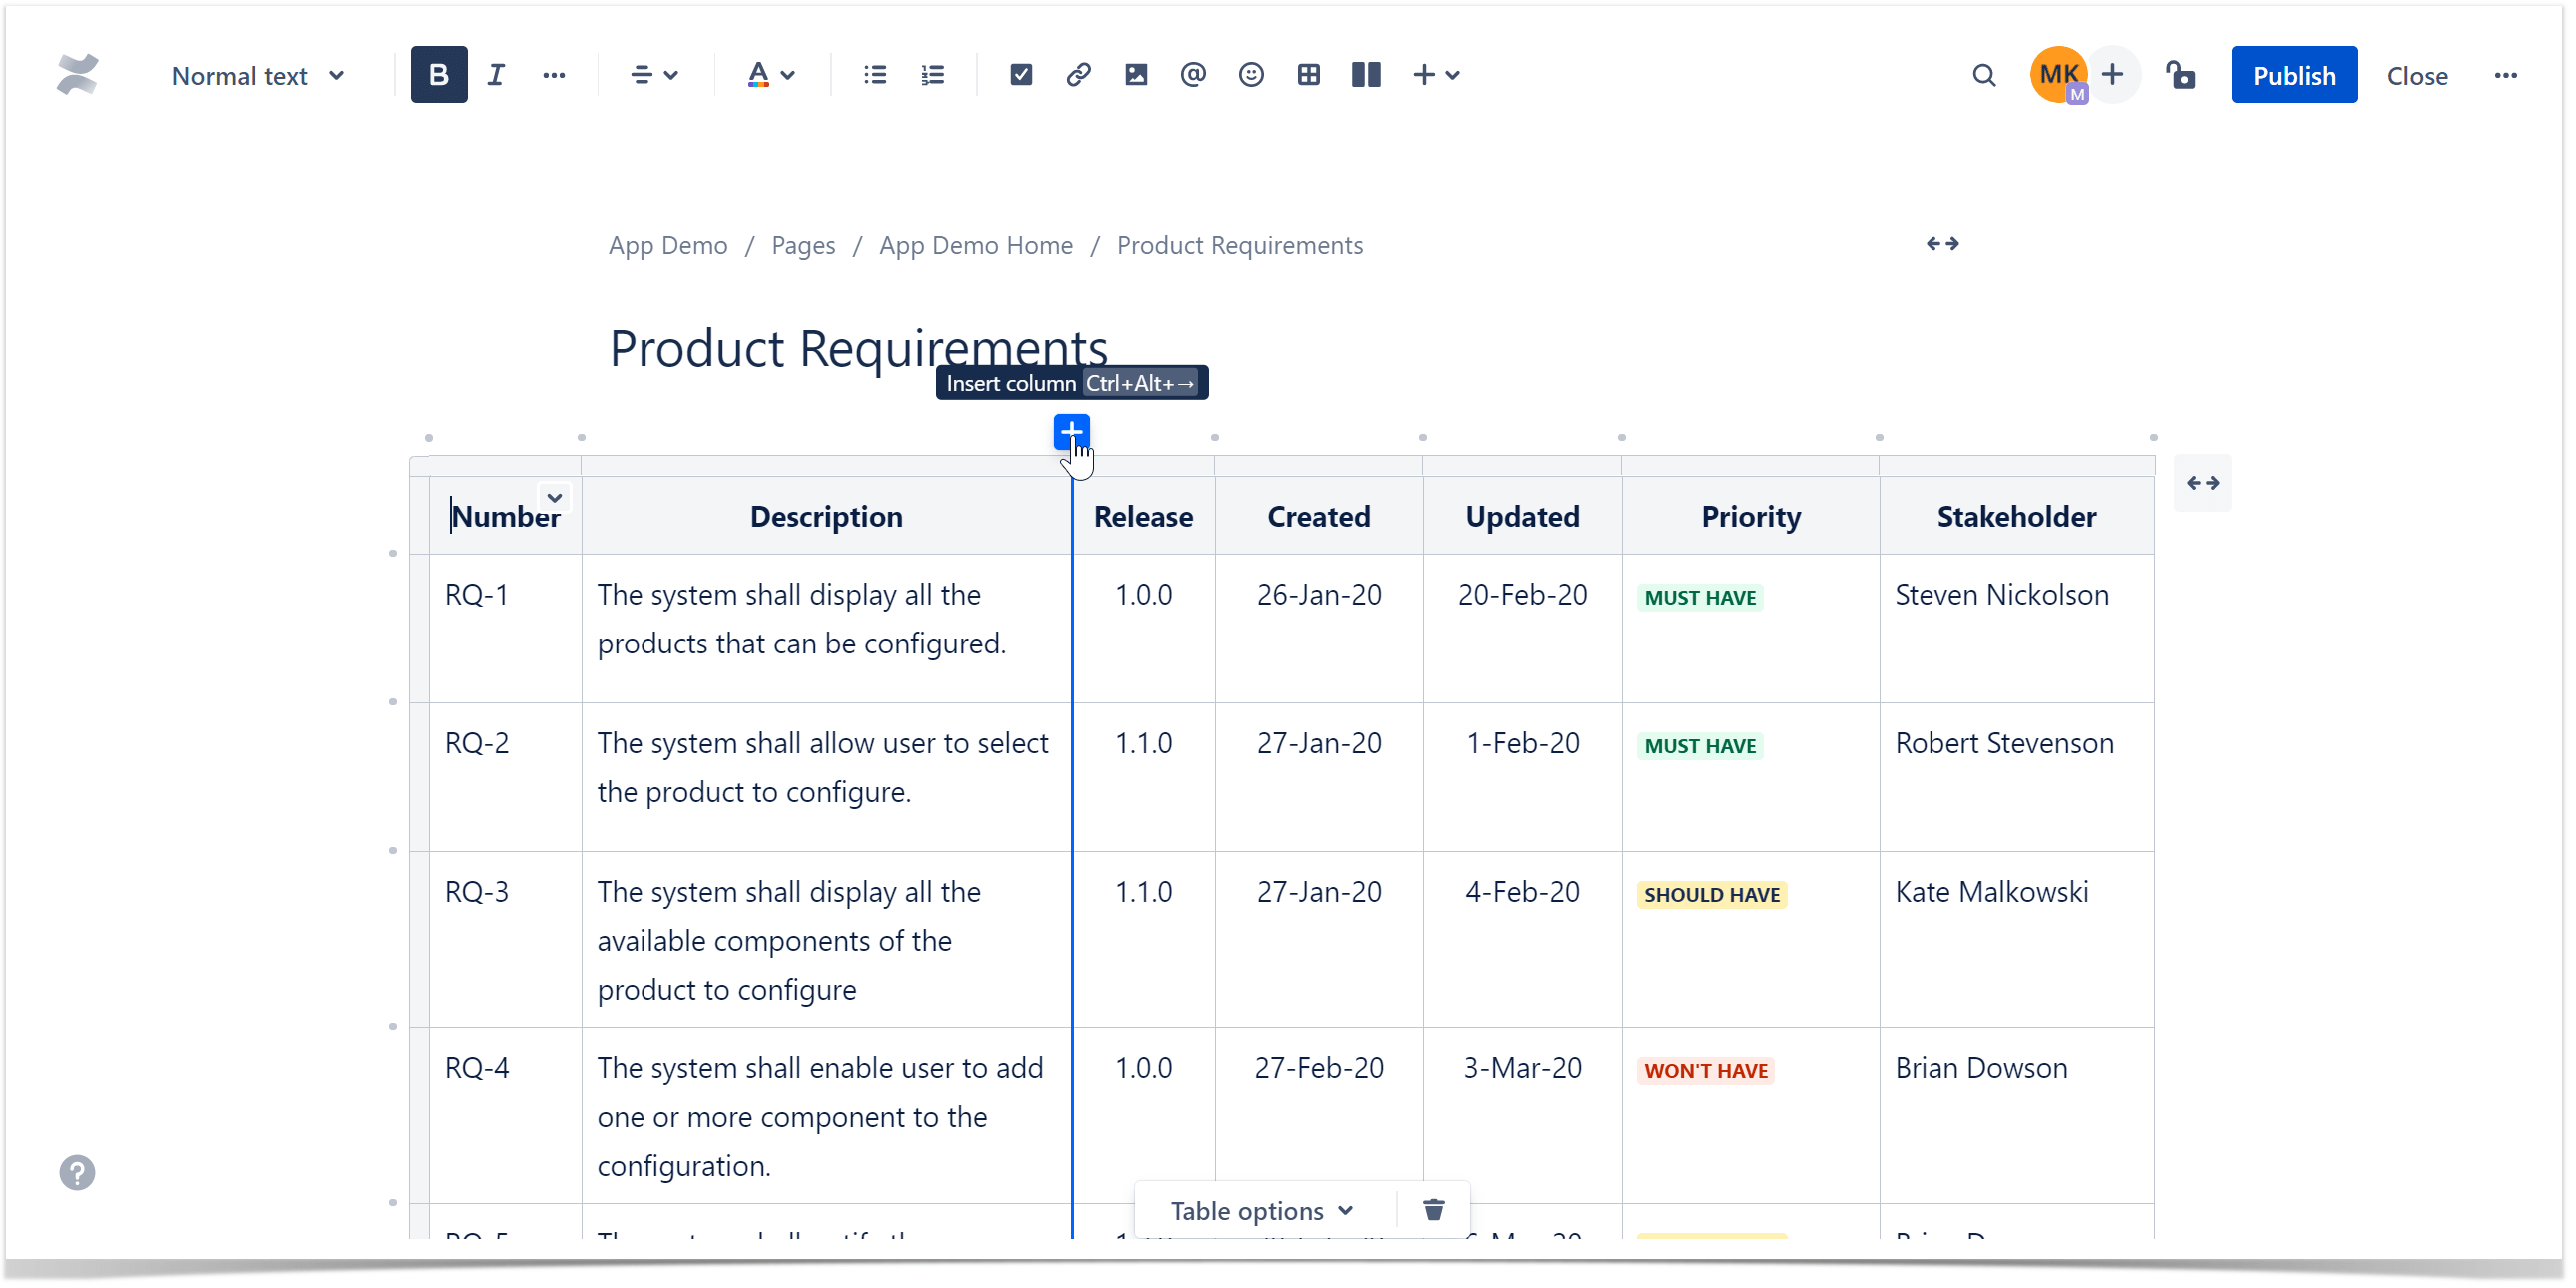
Manually. While editing a page, insert a table of the necessary size. You can add more rows and columns as you go, select a heading row or heading column, and generally organize the table the way you want.
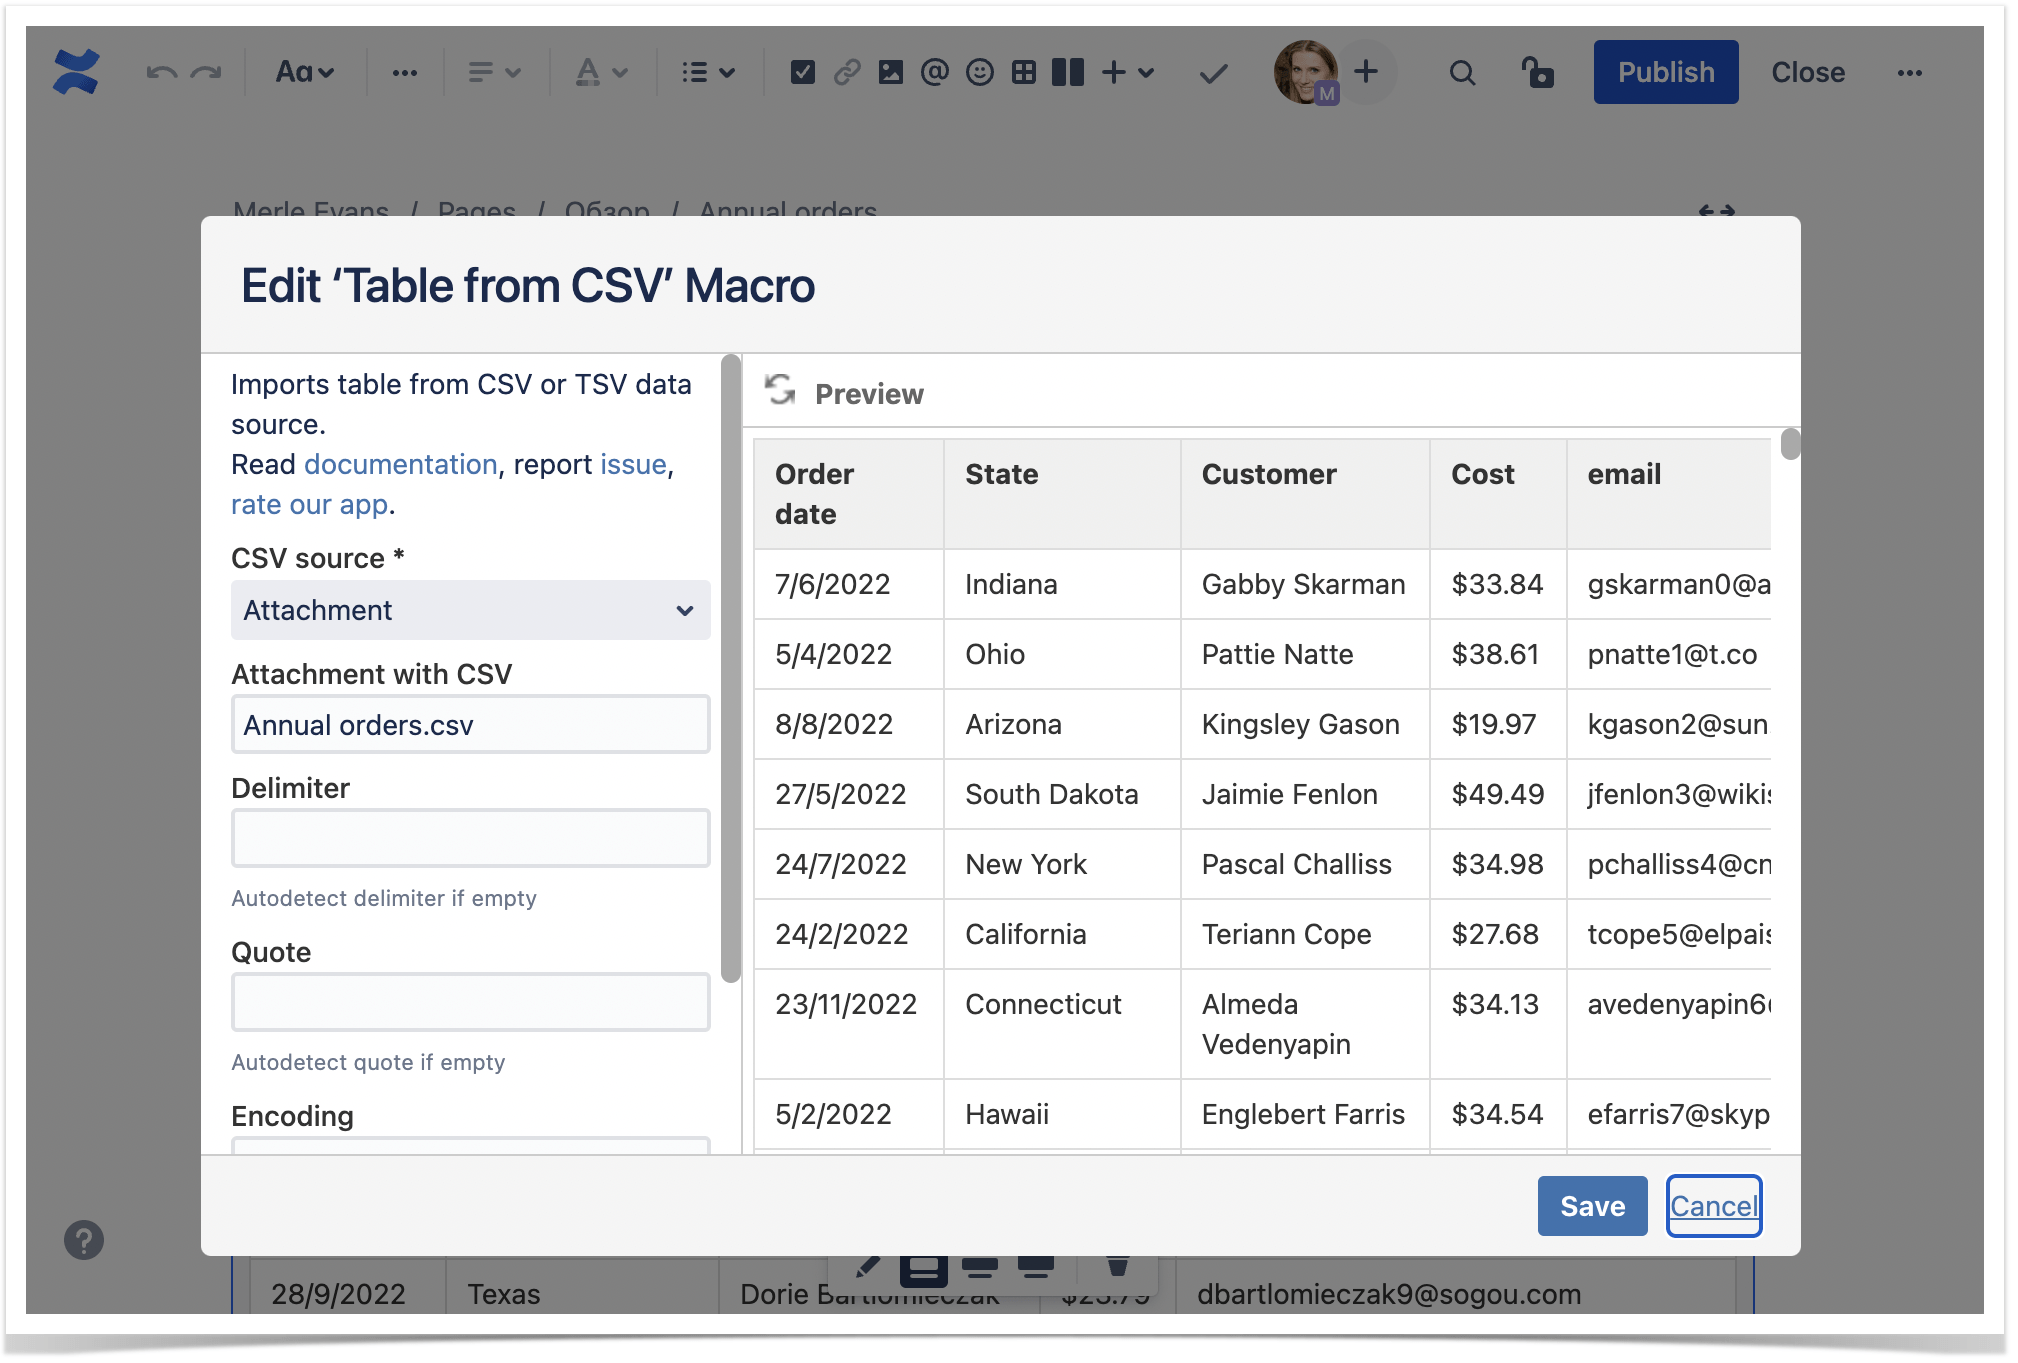
Output the table from CSV or JSON file. If you previously stored data in such a format, you can now upload the table to Confluence from that file. Apart from attaching a file, it is also possible to upload your table data from a URL. You will need the Table Filter and Charts for Confluence app. You can see more on outputting tables from different sources in our documentation.
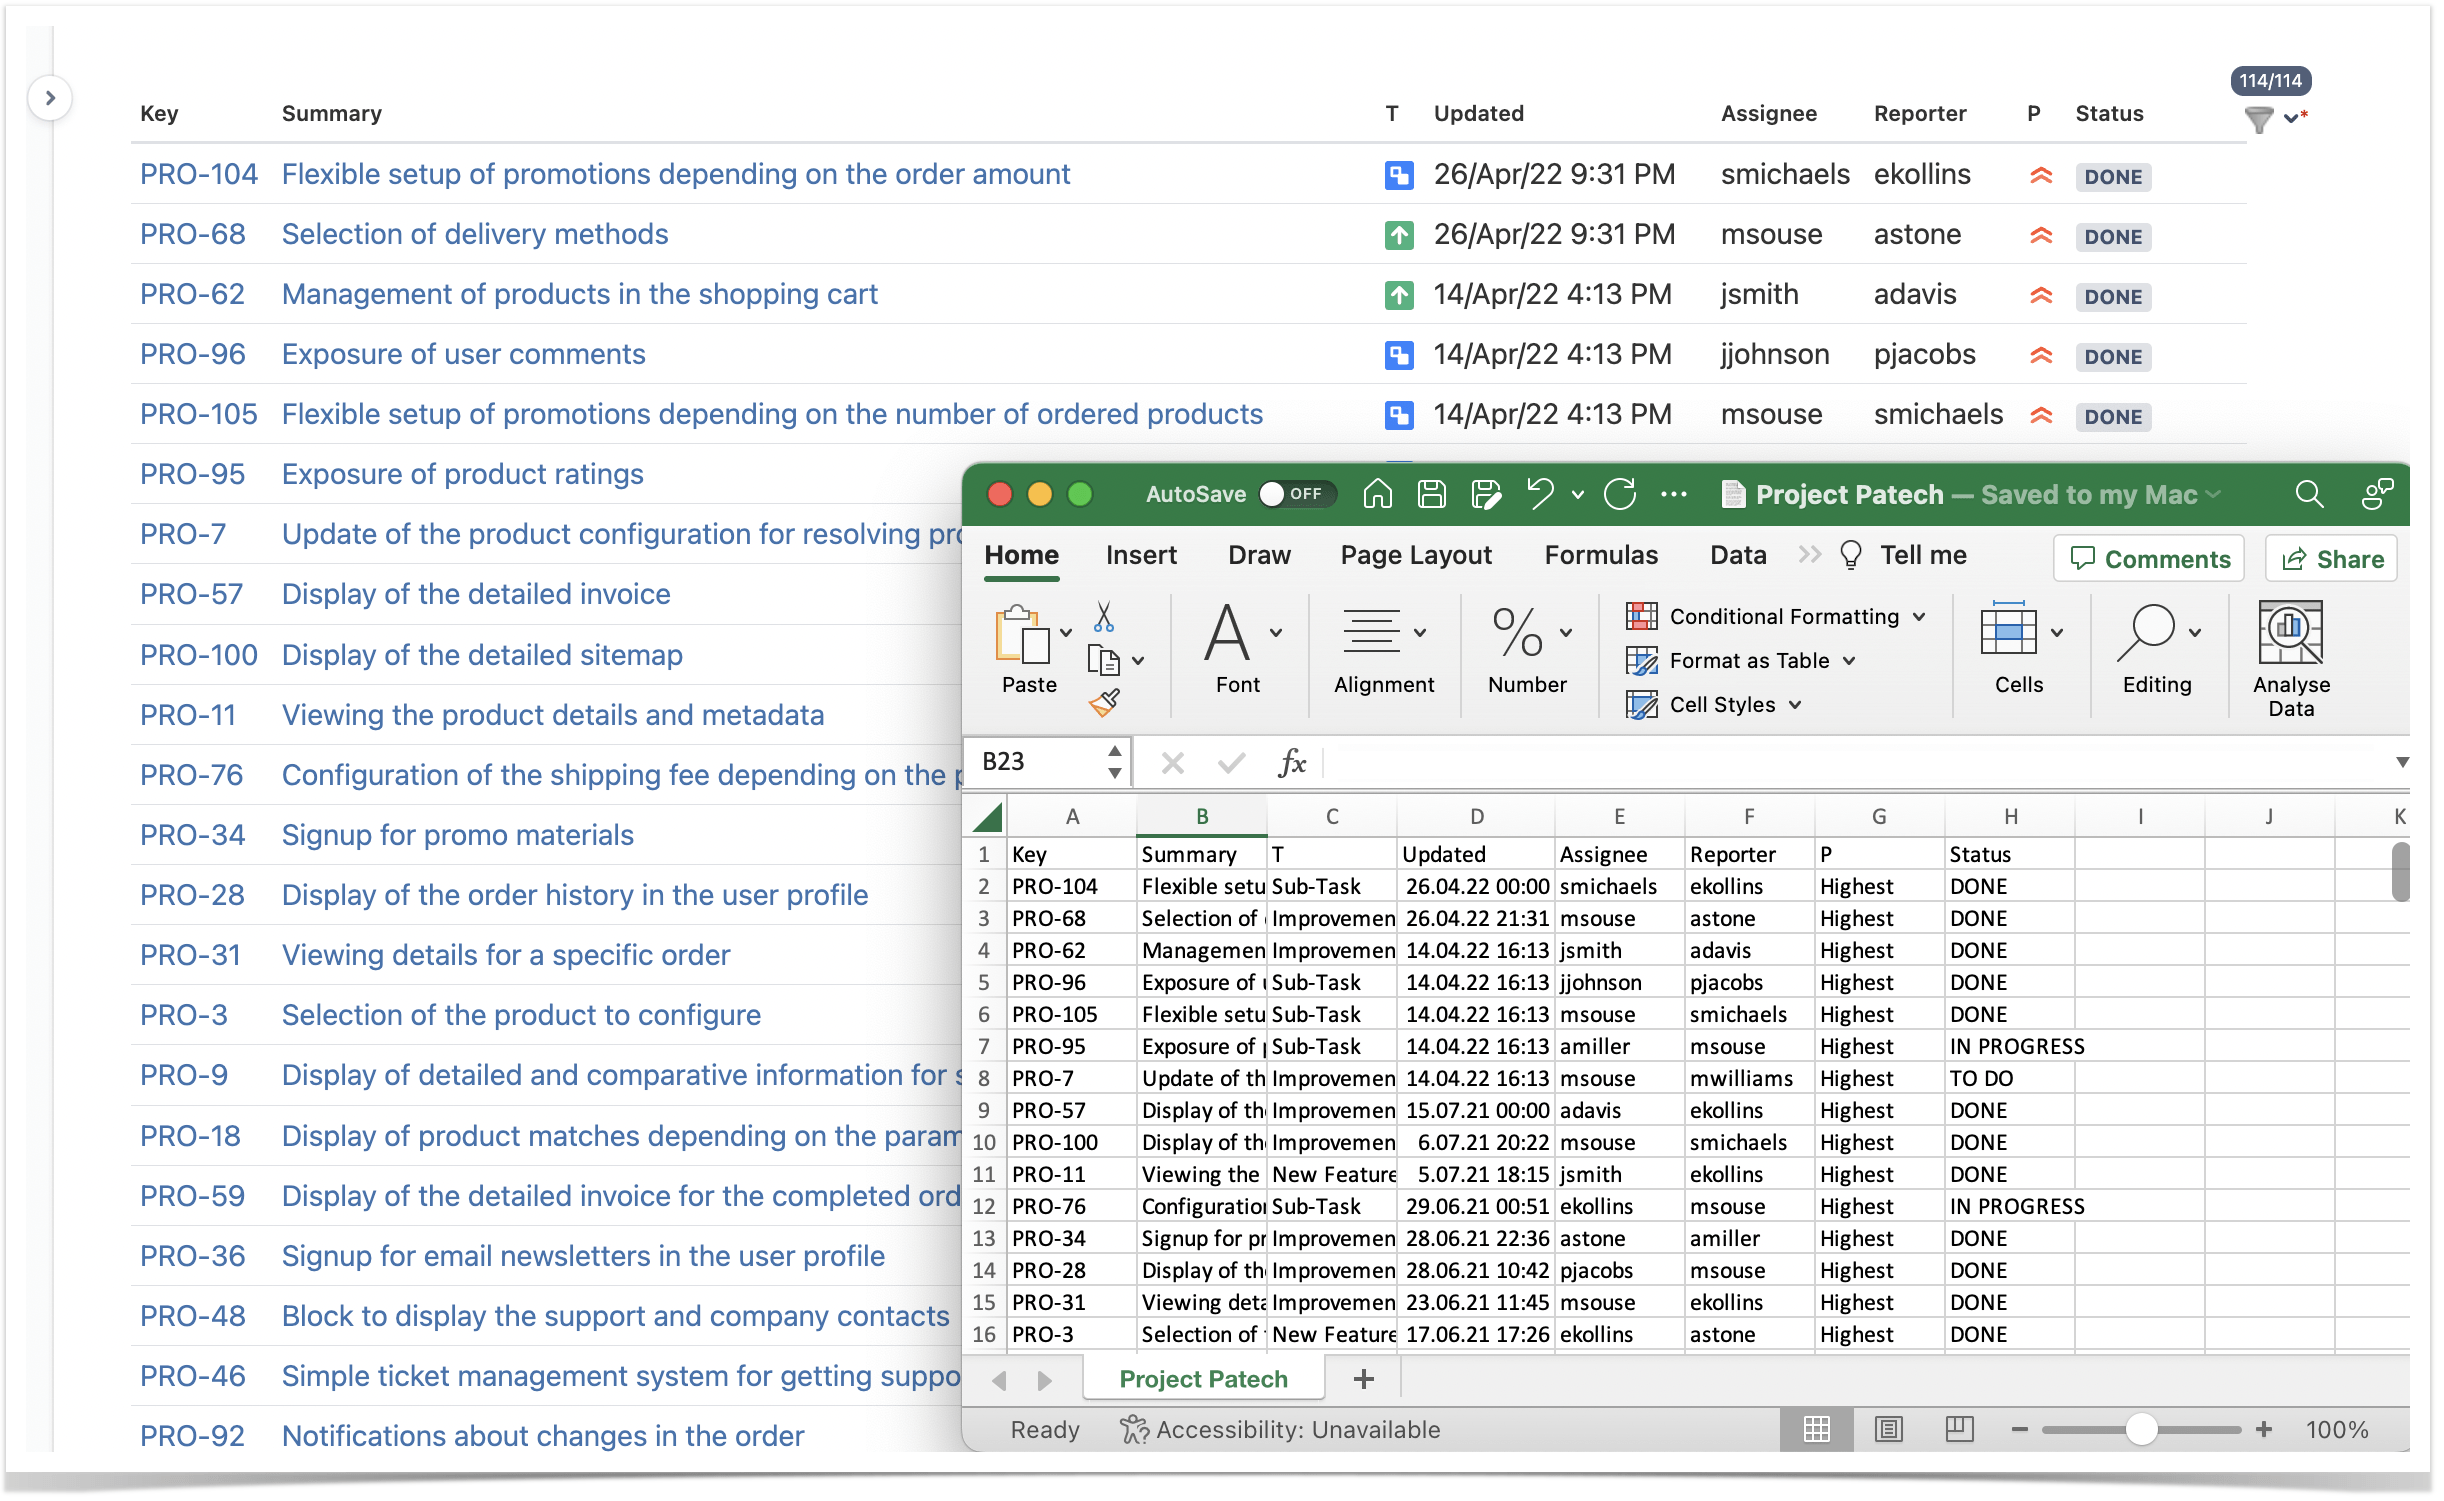
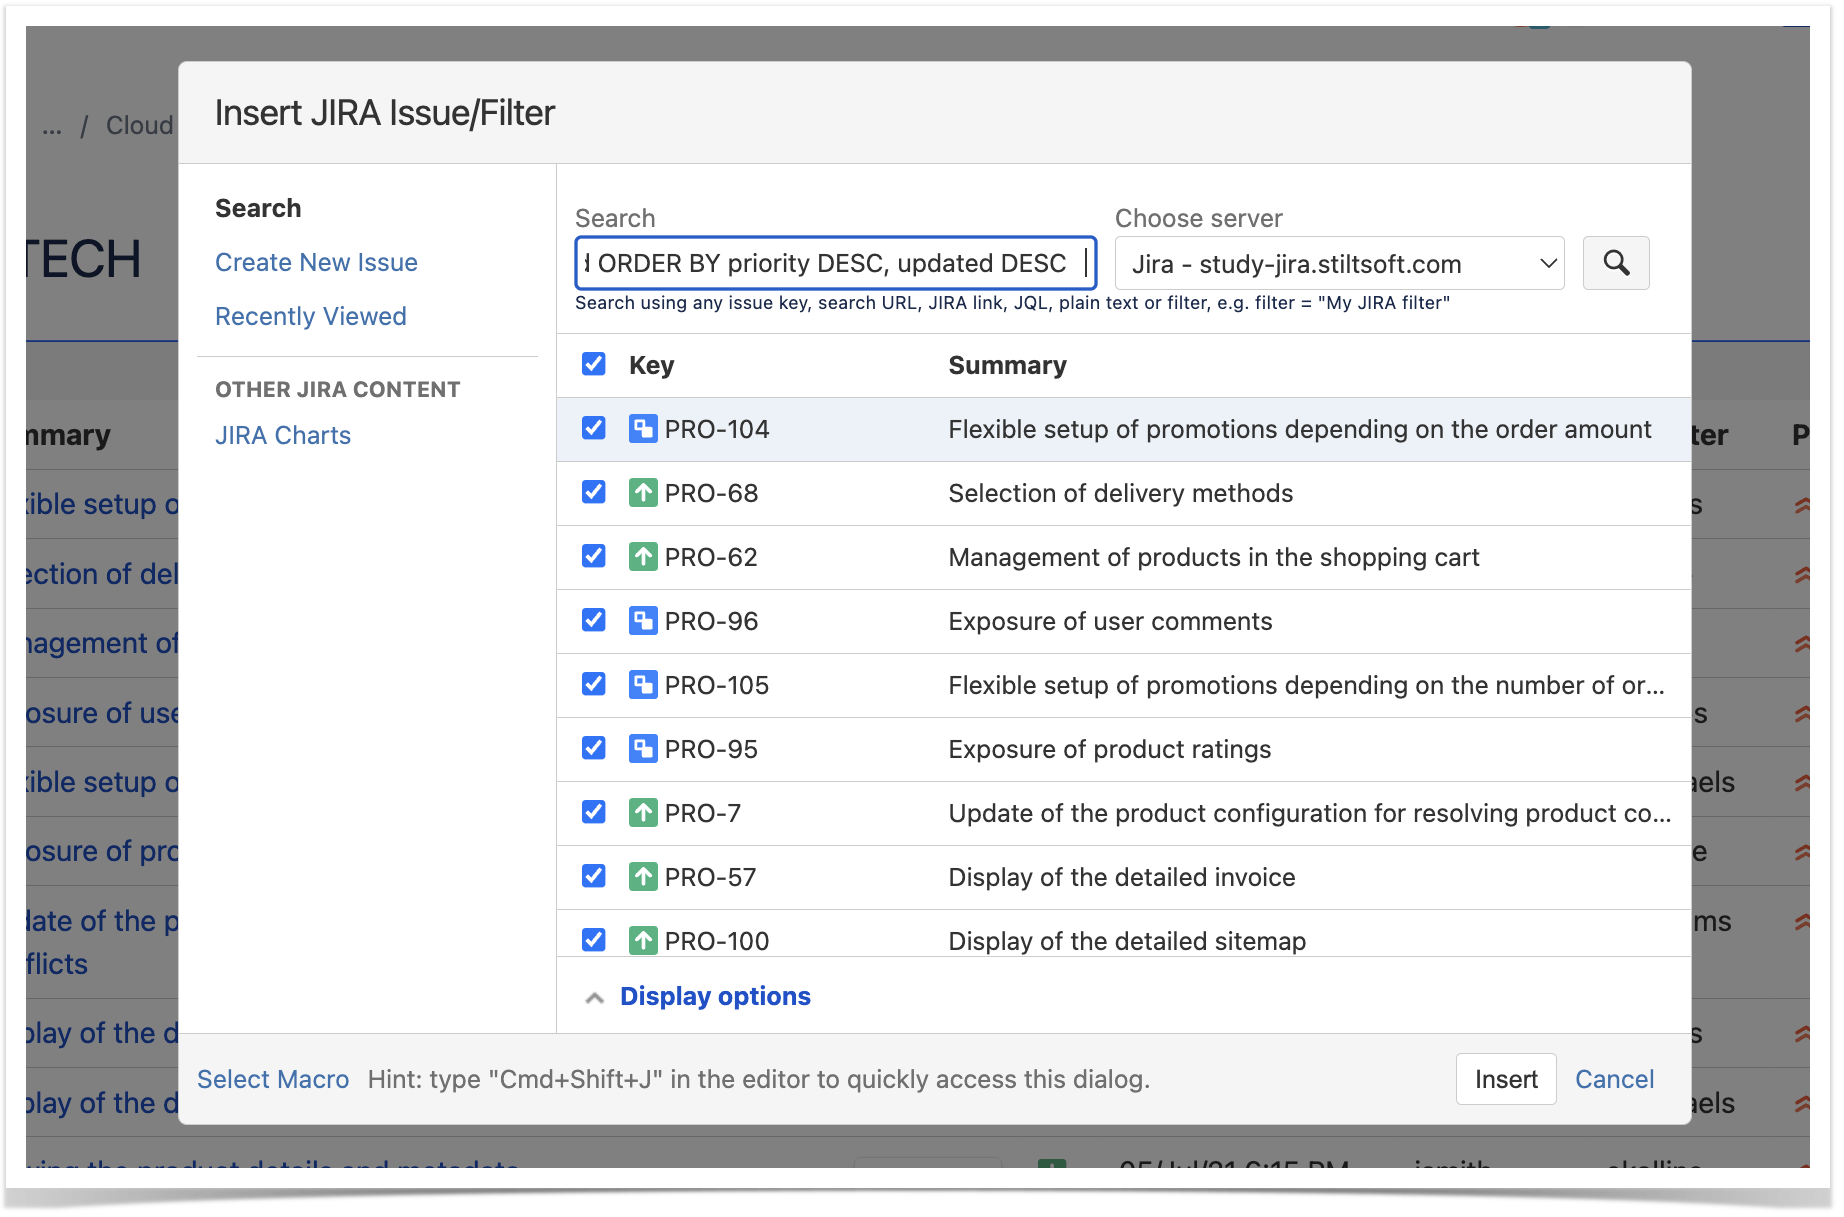
Use the Jira Issues macro. For that, your Confluence and Jira must be linked. This macro allows you to display one or several Jira issues on your page instead of exporting Jira data to Excel or CSV for analysis. You can include recently viewed issues or add a list of chosen issues through a URL or JQL.
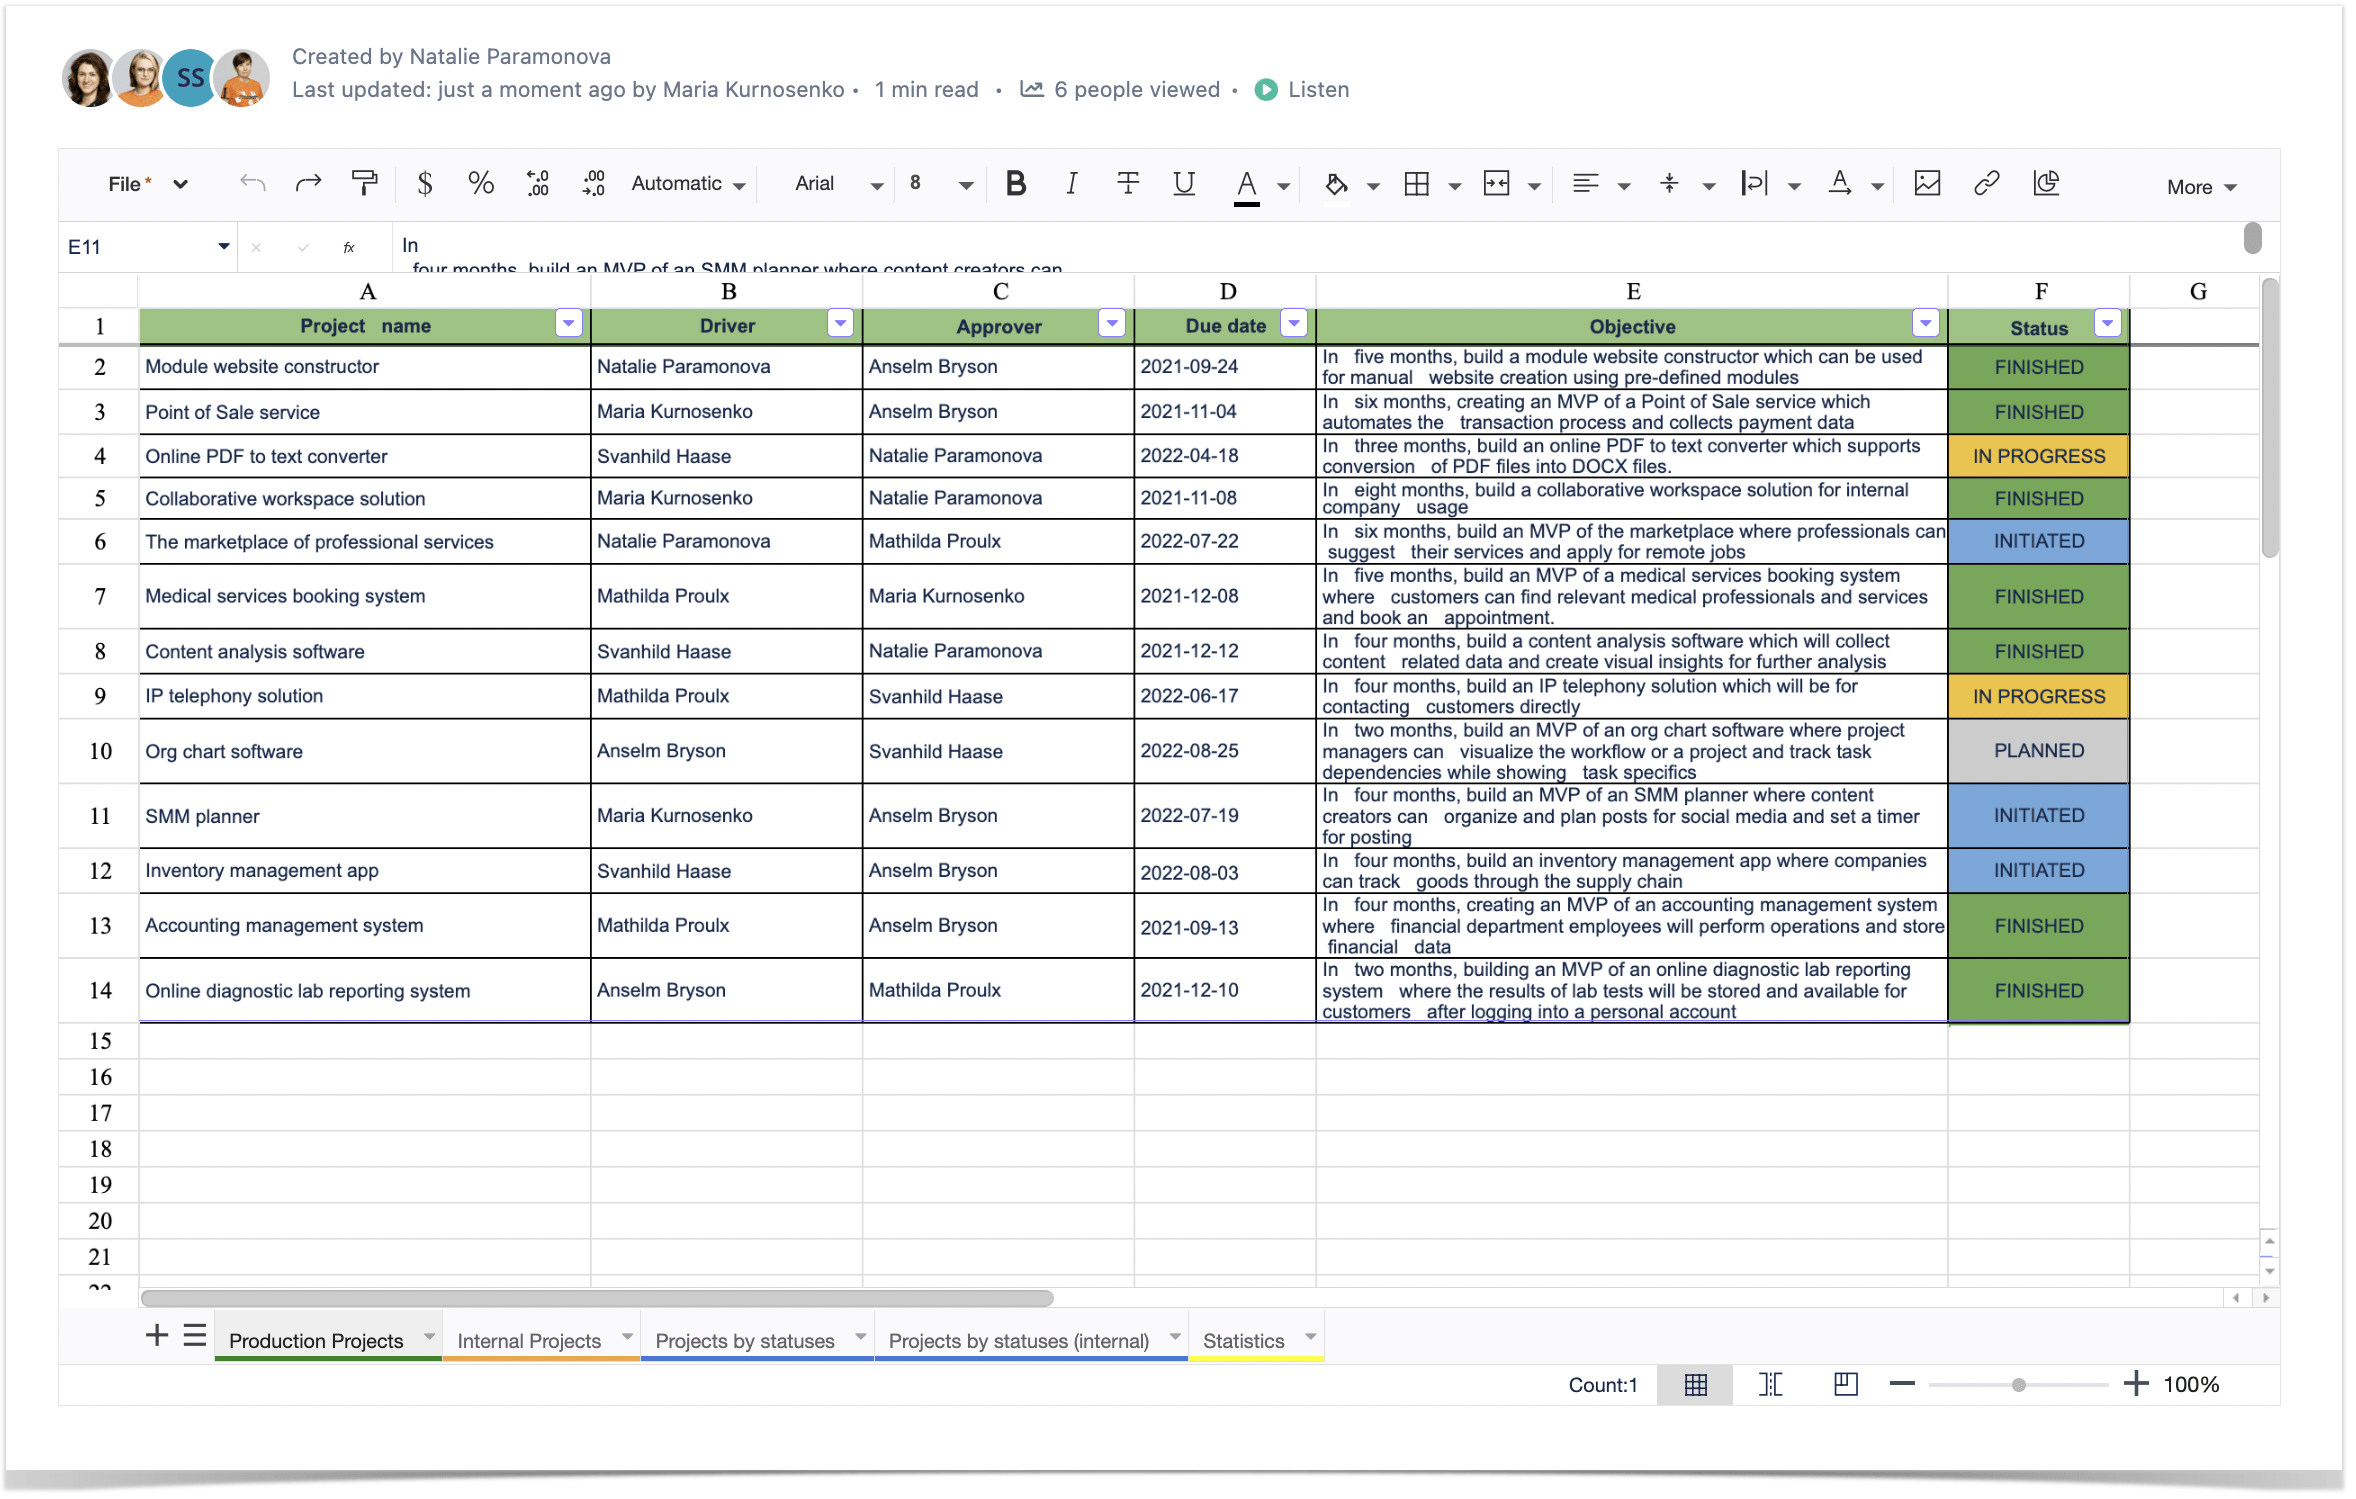
Add a spreadsheet. If you still lack the spreadsheet capabilities that MS Excel and Google Sheets offer, the Table Spreadsheet macro from Table Filter and Charts for Confluence can be a solution. It allows you to embed an Excel-like spreadsheet into your Confluence page. The capabilities of the macro are also similar to other spreadsheets:
- Text, cell, and border customization.
- Easy calculations with the help of formulas.
- Conditional formatting presets.
- Adding multiple sheets within the same spreadsheet.
- Data filtration, aggregation, and visualization.
And if you have Excel files with data, you can upload them into the spreadsheet to keep working.
5. Analysis and visualization
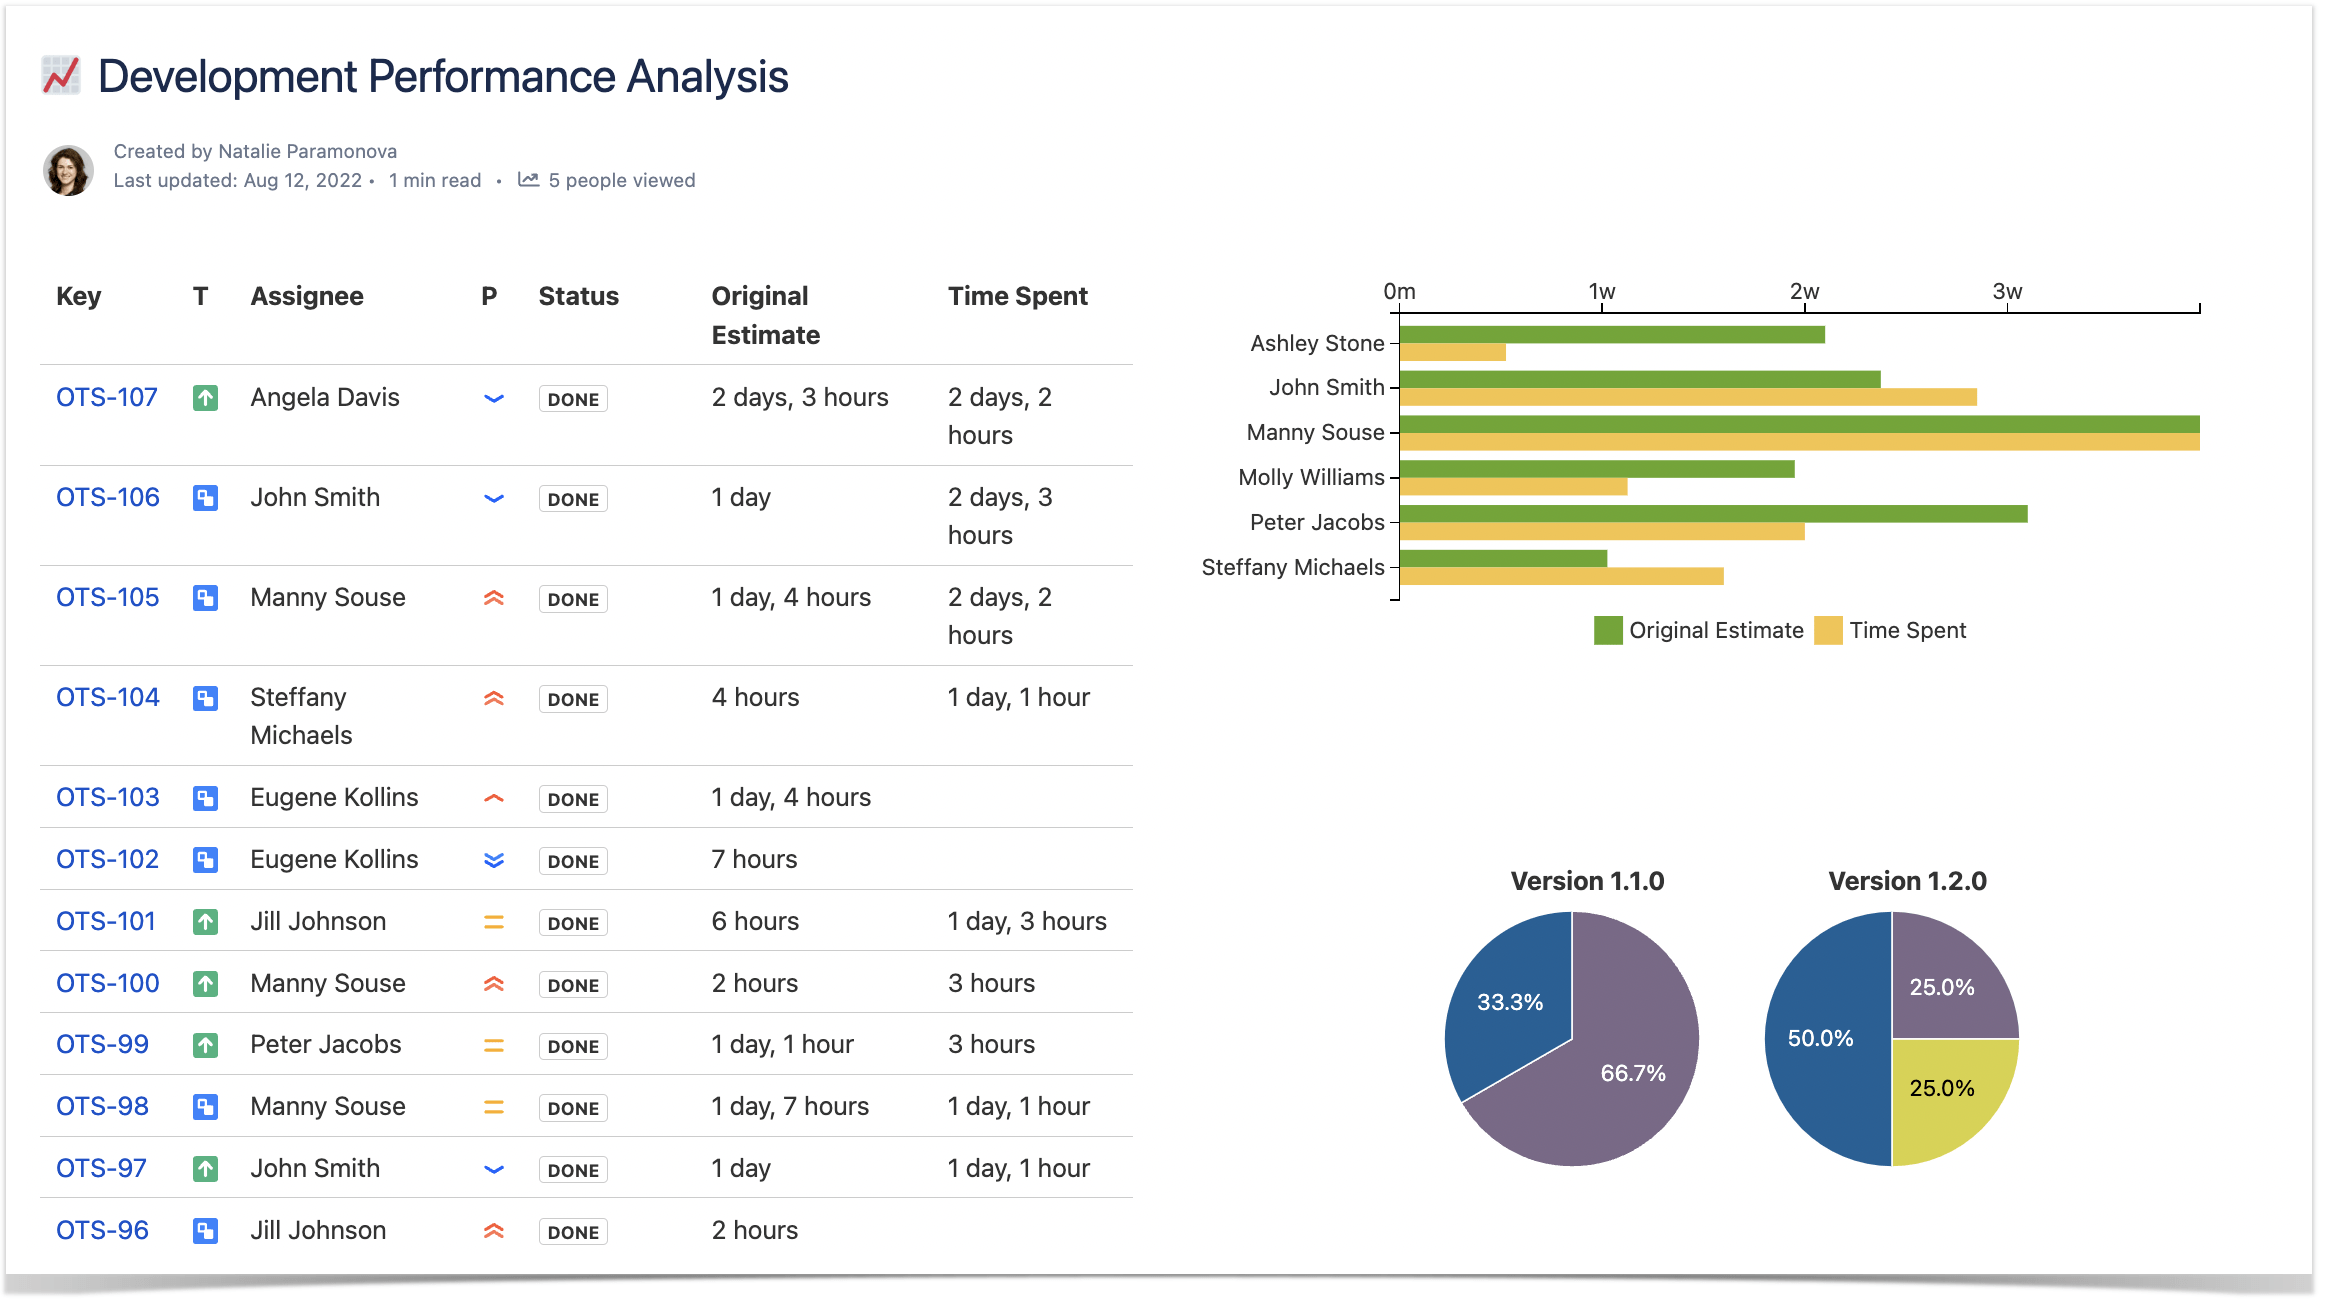
Working with tables includes more than just storing information. Sometimes you need to calculate something or make a presentation based on your chart. While Excel files and spreadsheets help you use various calculation formulas, with the Table Charts and Filters for Confluence app, you can do it using different macros. Here is what you can achieve:
- Filter the table. You can add several criteria to filter data in your table. Apart from that, you can sort the table, number the rows or freeze chosen rows and columns.
- Aggregate table data. Create a pivot table that deduces the average value, counts the number of entities in a selected column and shows you minimal, maximal, or literal values.
- Customize the look of your table or merge tables that share specific data.
- Turn your tables into charts and graphs, such as pie charts, bar and column charts, or Gantt charts.
Confluence or Excel?
These are just a few benefits you can see while switching from Excel or Google Sheets to Confluence tables. Let’s sum up the comparison:
- Compared to MS Excel or Google Sheets, Confluence is better for collaborative work.
- Thanks to the page history in Confluence, it’s easy to back up to the previous version of your file. In Excel, this function is not available at all.
- If you power Confluence up with Table Filter and Charts for Confluence, you can filter table data and do various calculations. You’ll need formulas for the same operations in Excel or Google Sheets.
- With the help of the Table Filter and Charts for Confluence app, you’ll rapidly make charts and graphs. While this is also possible in Excel, you can only manually create a chart in Google Sheets.
- With the Table Spreadsheet macro from Table Filter and Charts for Confluence, you can keep working with tables as you used to in Excel.
Both MS Excel and Confluence have a lot of benefits. But what matters most is what works best for you.
If you are interested in Confluence spreadsheets, try Table Filter and Charts for free!


