Running Project Planning in Atlassian Confluence

Project planning is one of the most important phases in project management. The accuracy with which you complete this stage will directly impact the success of your project in the future. That is why it is essential to estimate the required resources for project development and use the right tools.
Atlassian is extensively developing different tools for running the full cycle of project management. And Confluence can be the appropriate solution for running your planning procedures.
Let’s have a look at some useful Confluence project planning features.
Native Blueprints
Even out of the box, Confluence delivers a wide range of tools for running planning activities. Even though you won’t find the one-size-fits-all Confluence project plan template, you can use the pre-defined blueprints to quickly do a lot of routine project planning tasks, as follows:
- track decisions
- collect meeting notes
- document product requirements
Tracking Decisions
Final decisions about a project are usually made upon the agreement of several people and depend on multiple factors. To keep all details on hand, you can use the Decisions blueprint.

Here you can track the decision status, stakeholders, outcome, background of a decision, and actions to take.
It is quite simple but allows you to effectively track any project-related decisions. With its help, you as a project manager can quickly go through the history of decisions and find the right one.
Assembling Meeting Notes
Regular meetings are a common practice for many teams. They allow to keep up with the colleagues and discuss all sorts of things. But it can be challenging to navigate through all the information and figure out the main points. This is when the Meeting Notes blueprint gets in the spotlight and keeps focused after the meeting.

You can further browse through the meeting notes, looking for their resolutions if you get some doubts within the team.
Documenting Project Requirements
Atlassian has simplified the process of documenting requirements by creating a configurable blueprint. You can always tailor its structure to your actual needs or use it as is.
Here your team can quickly specify the goals, outline the background and strategic fit, track assumptions, and, of course, specify requirements with prototypes. A table with project-related data is placed inside the Page Properties macro, which will further be used to generate a list of all requirements on one page.

Requirements are gathered in one list with the help of the Page Properties Report macro. It pulls data from other pages containing Page Properties with specific labels and depicts them in one table. This means you can quickly access project requirements through the Confluence navigation sidebar.

![]()
Pro tip:
Learn more about using Spreadsheets in Confluence
![]()
Gantt Chart for Project Planning
In addition to blueprints, it is possible to create a visualization of your project plan in Confluence. This will make it easier to identify possible issues. You can build charts and graphs in Confluence using both out-of-the-box features and third-party apps.
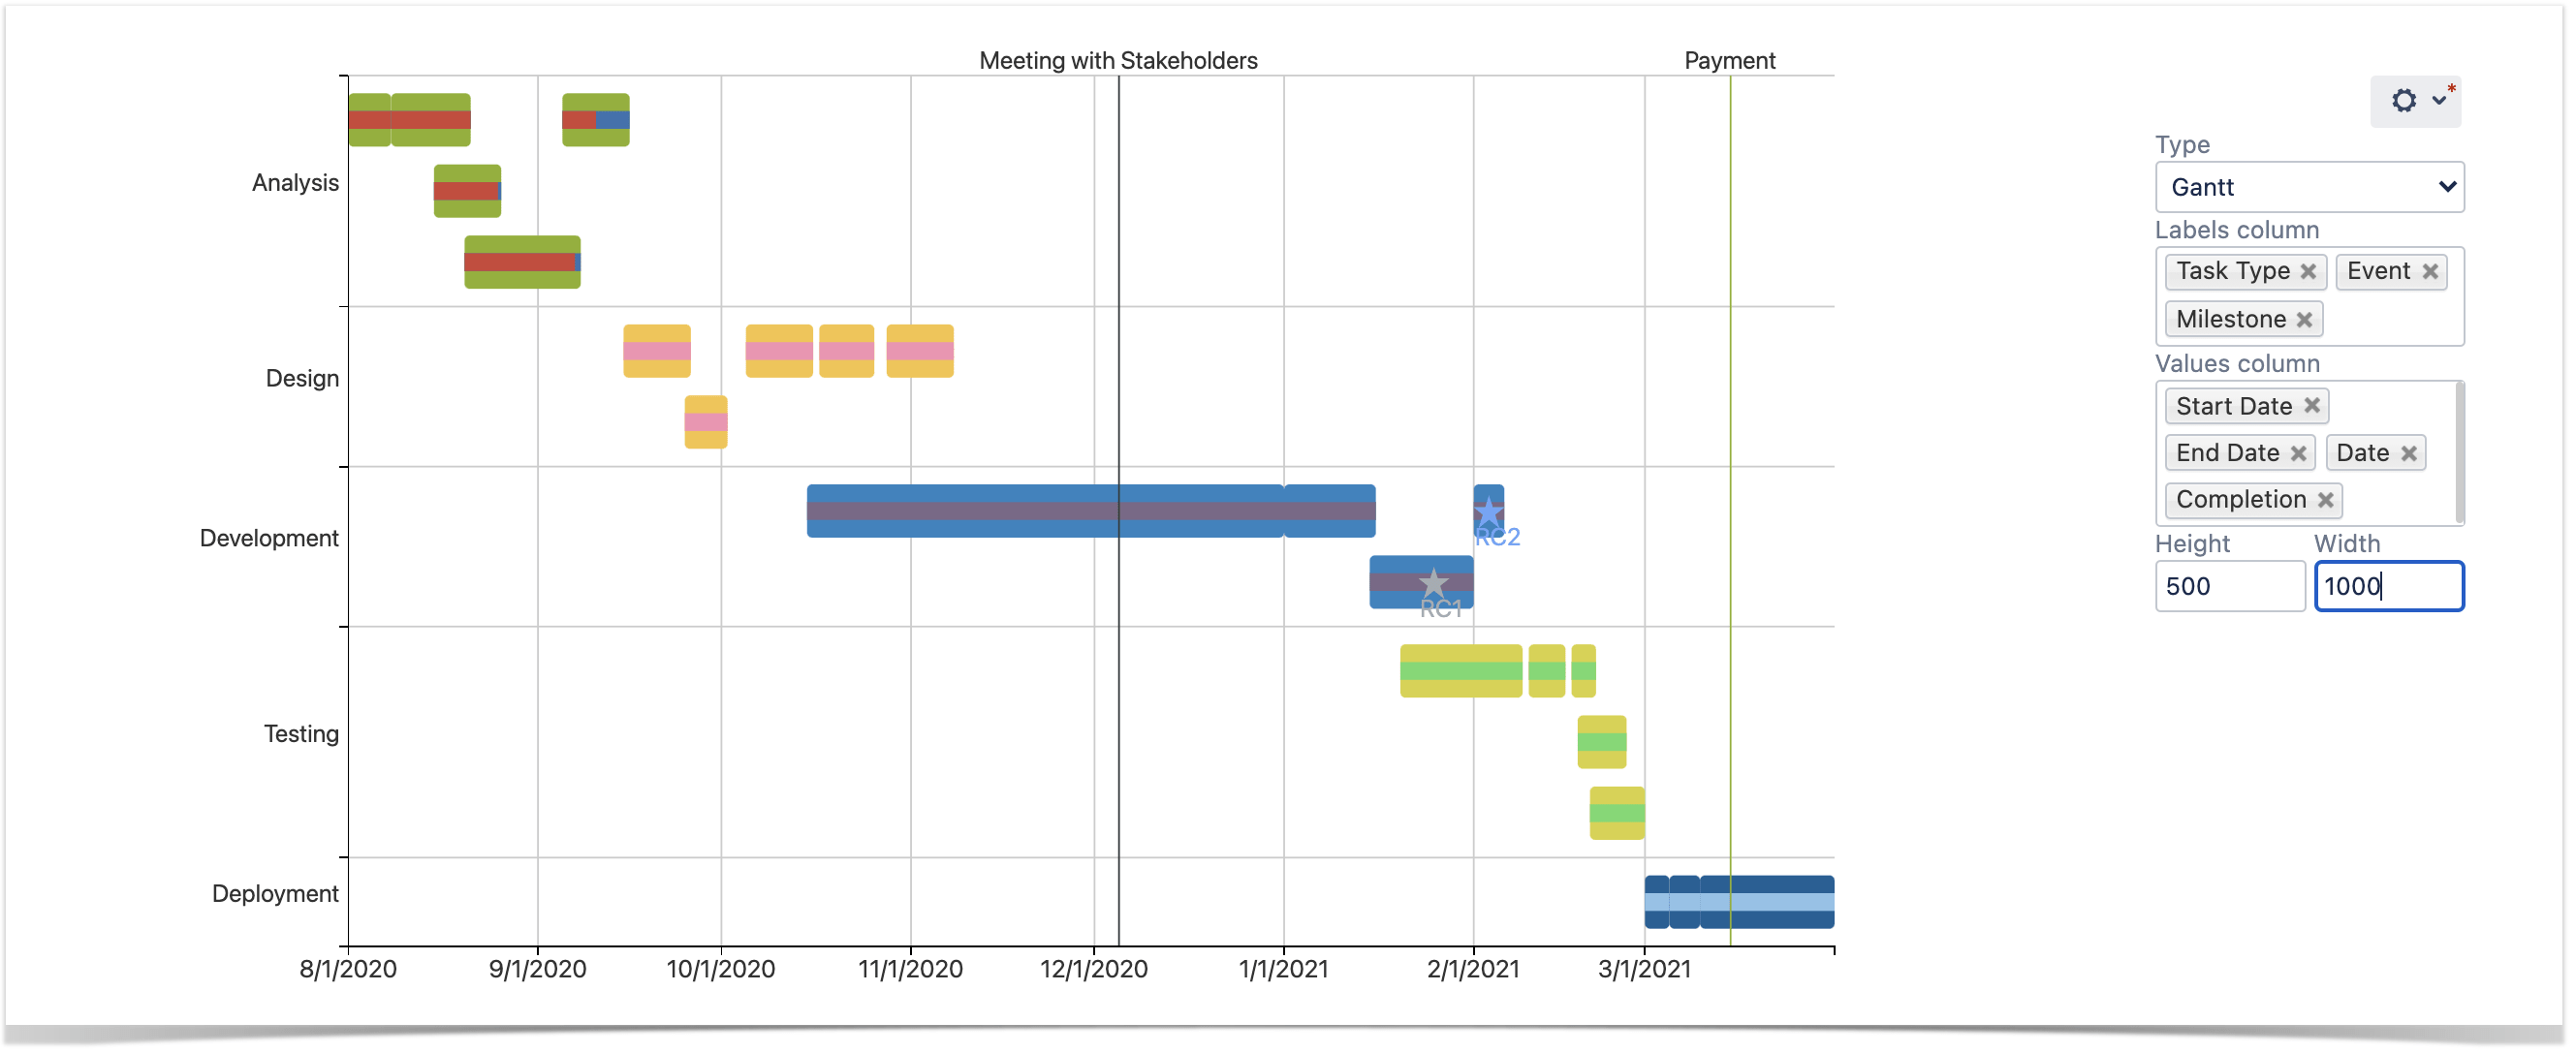
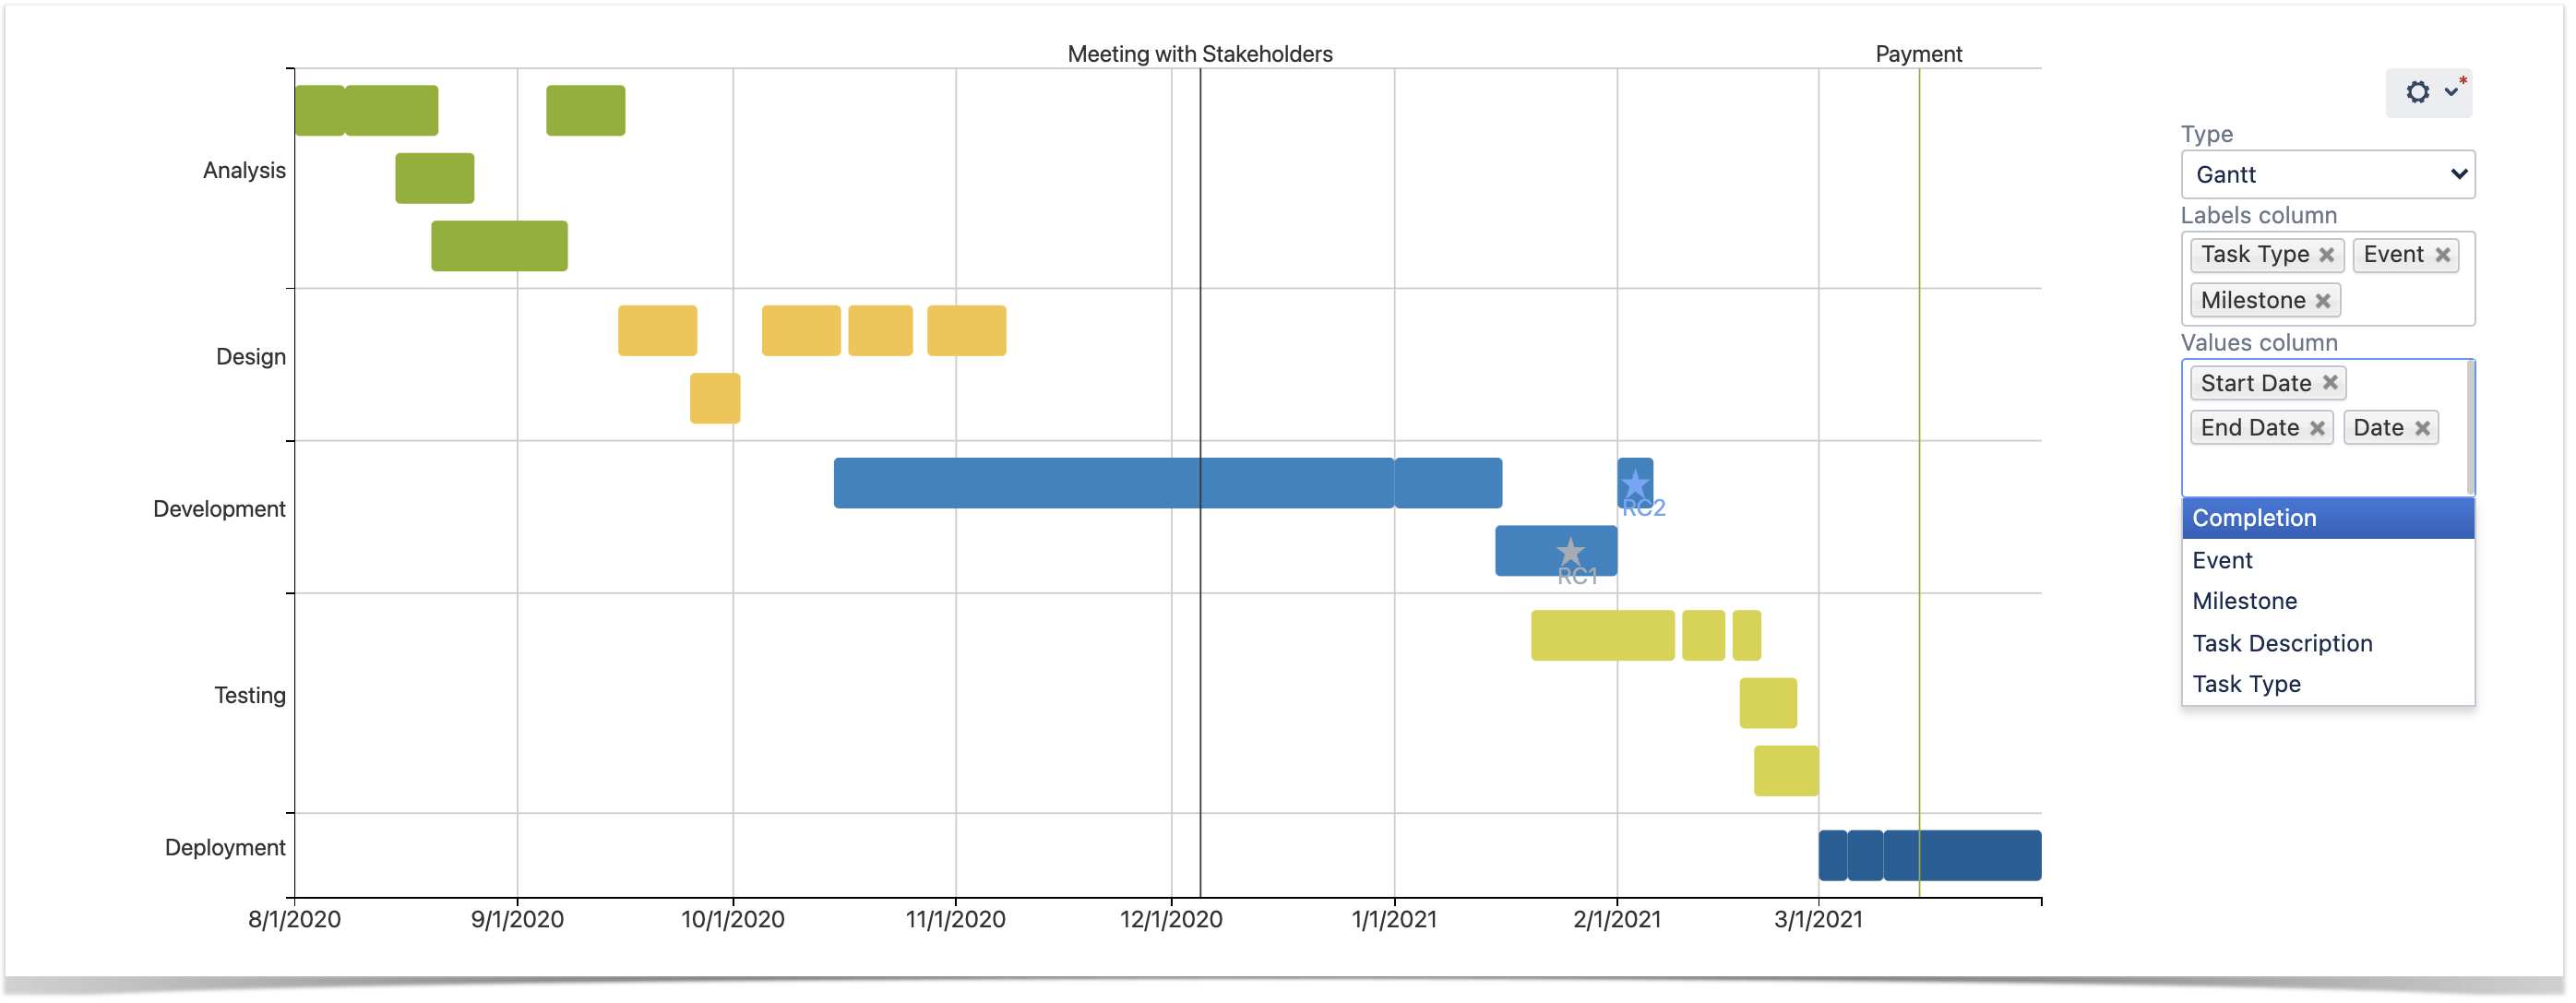
If you want to see the workflow of a project, a Gantt chart will be helpful. This chart is quite efficient for scheduling project tasks or phases, managing them, and monitoring resources sufficient for their completion. The chart displays the project timeline on which you can place either specific tasks or project phases in the form of bars. Bars on the timeline can be placed as a sequence or in parallel. It depends on whether tasks can be performed simultaneously or should be done one by one. Each task or phase on the timeline has both start and end dates, and the length of the bar indicates the tentative duration of work on it. Over each bar, you can locate a progress line indicating how much work has already been done.
Additionally, a Gantt chart can have milestones indicating some important dates, for example, demonstration, release, or anything like this.

This chart can simplify arranging the sequence of tasks and show you the bottlenecks in the planned estimates. You can also add task dependencies and see if some task or project phase falls behind the schedule.
Building a Gantt Chart in Confluence
For building a Gantt chart we will use the Table Filter and Charts app. It bundles a set of macros for filtering any kind of data in Confluence, further aggregating it with a pivot table, and, finally, visualizing this data with the dynamic chart.
First of all, you need to create a new page with one or several tables.
The first table with tasks will have the following structure:
- Task Type
- Task Description
- Start and End Dates
- Completion
If you want to build a simple Gantt chart and see the general project timeline, this table will already be enough. It will give you a rough overview of tasks and stages and help you understand whether your team fits into the schedule.

You can save the page now and go to the view mode. Hover over the table now and click the plus button that appears next to it. Here, choose to create a chart from data series.
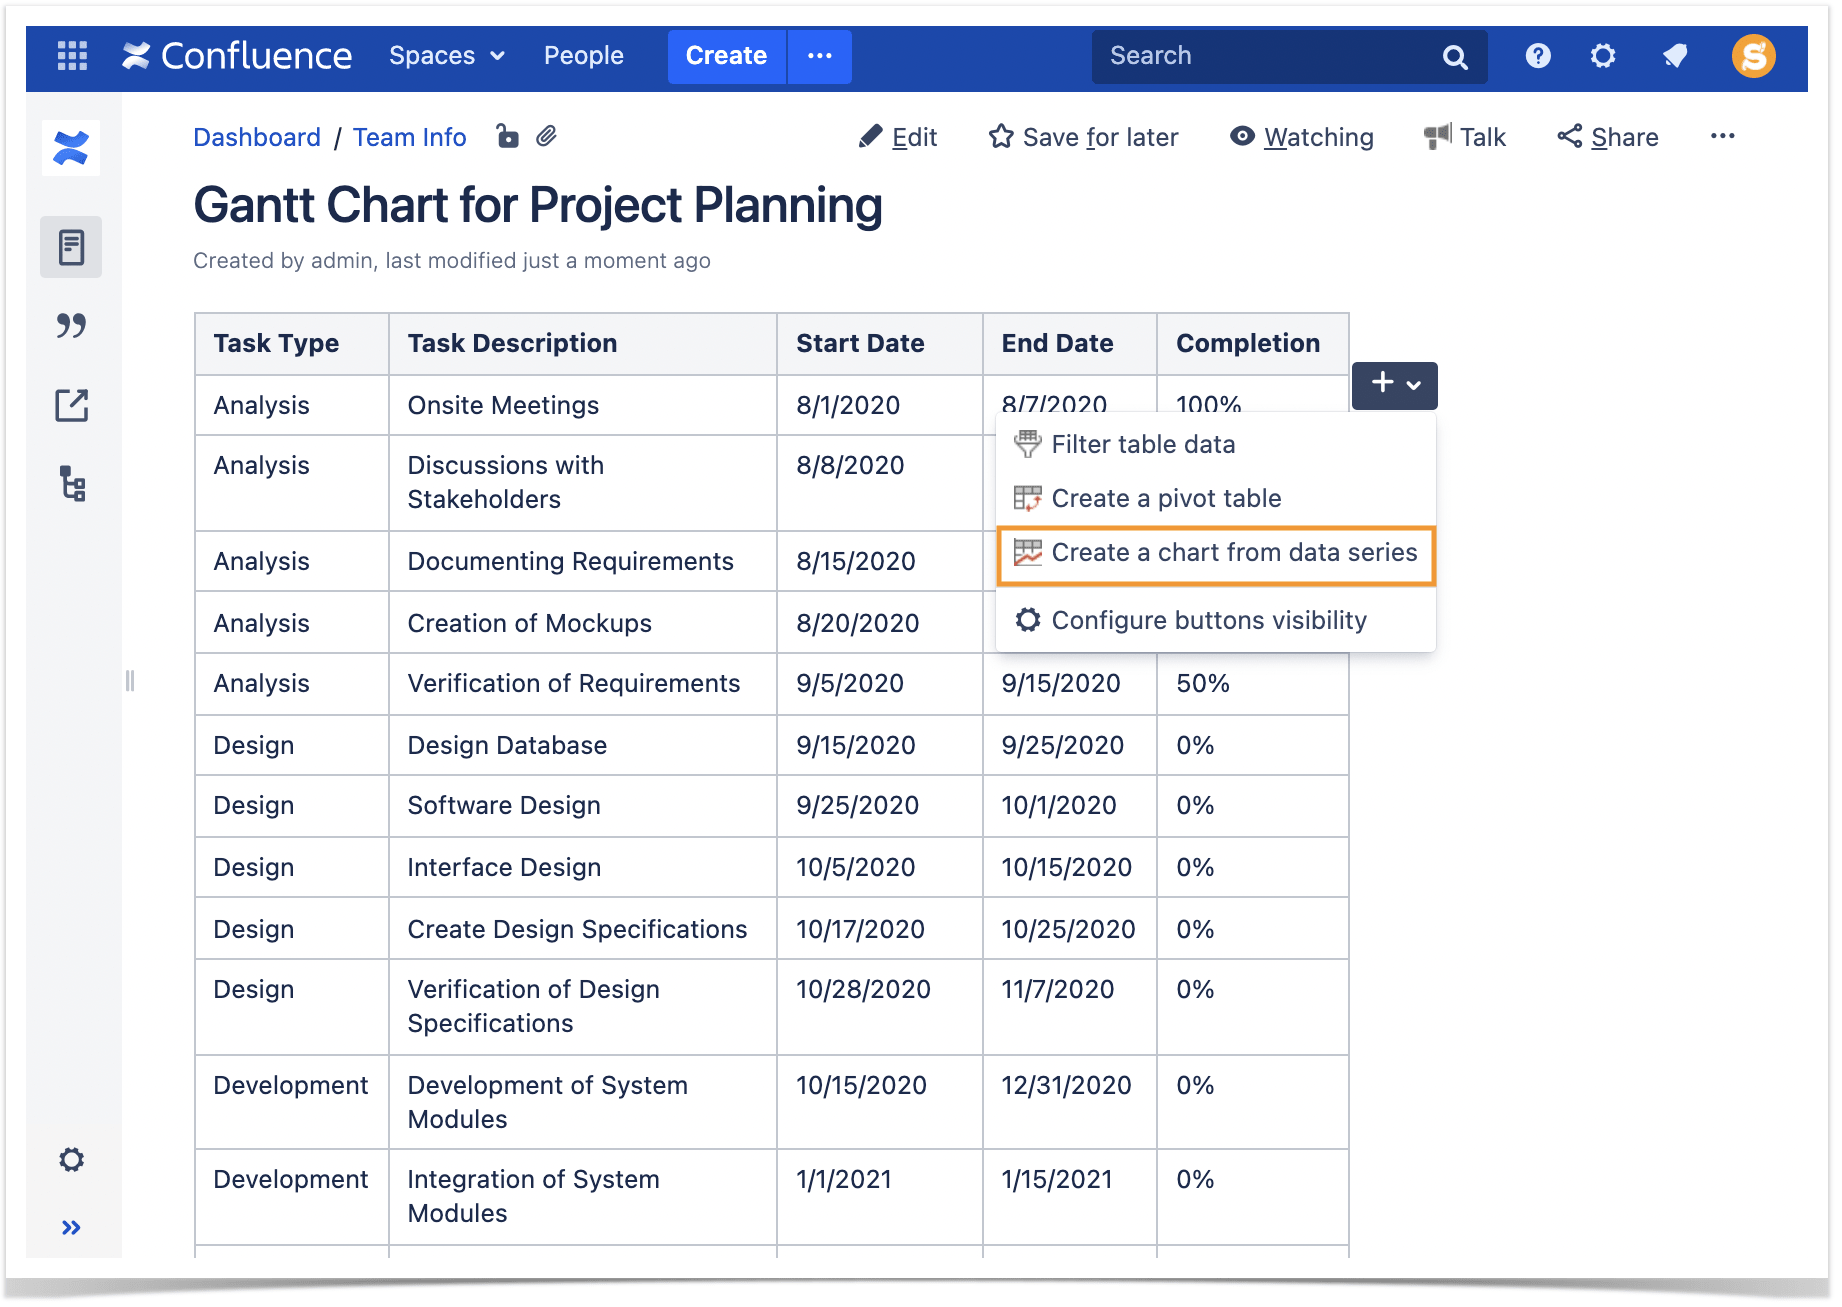
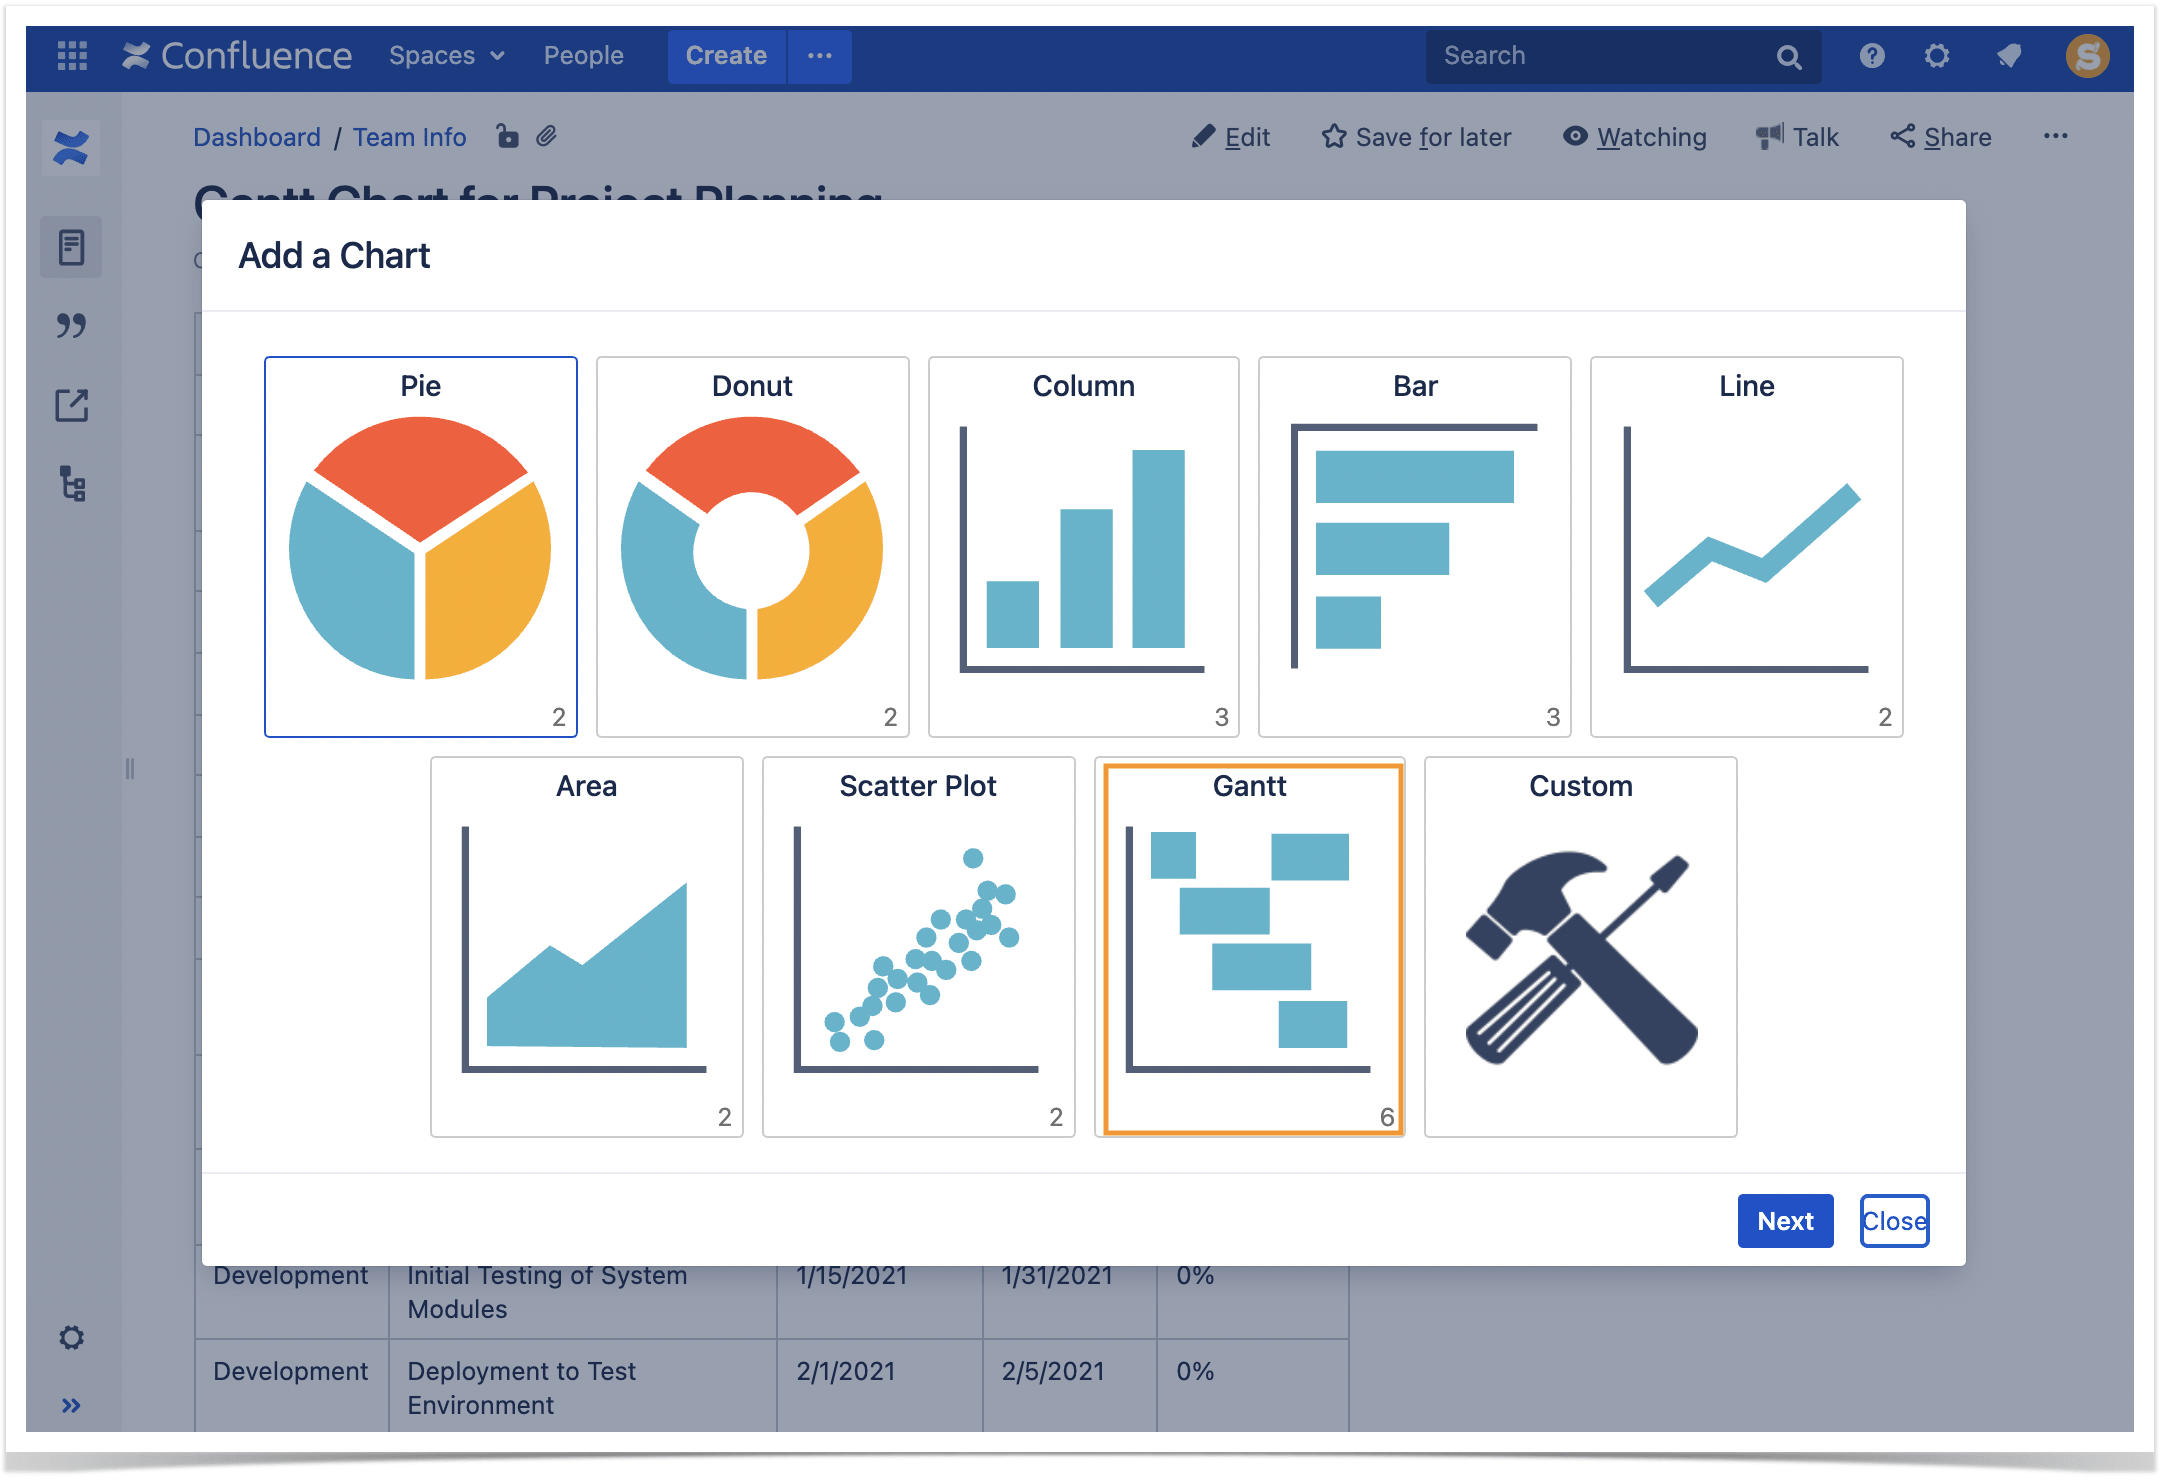
Pick the Gantt chart type. Next, choose one of the suggested types of data organization and add it to the page.

Add the chart and save the page.

For a more detailed look, add a few extra tables inside the Chart from Table macro.

Milestones are usually vital for a particular project or its stage. To depict milestones, create the table of the following format:
- Task Type
- Milestone
- Date

They are shown as stars located on a specific swim lane.

Some events might also be important for your project plan, so you can add them to the Gantt chart too. Usually, events are not connected with a particular project phase and are meaningful for the project as a whole. To add events to your Gantt chart, you’ll need a simple table with two columns:
- Event
- Date

On a Gantt chart, they look like vertical lines crossing the chart on a particular date.

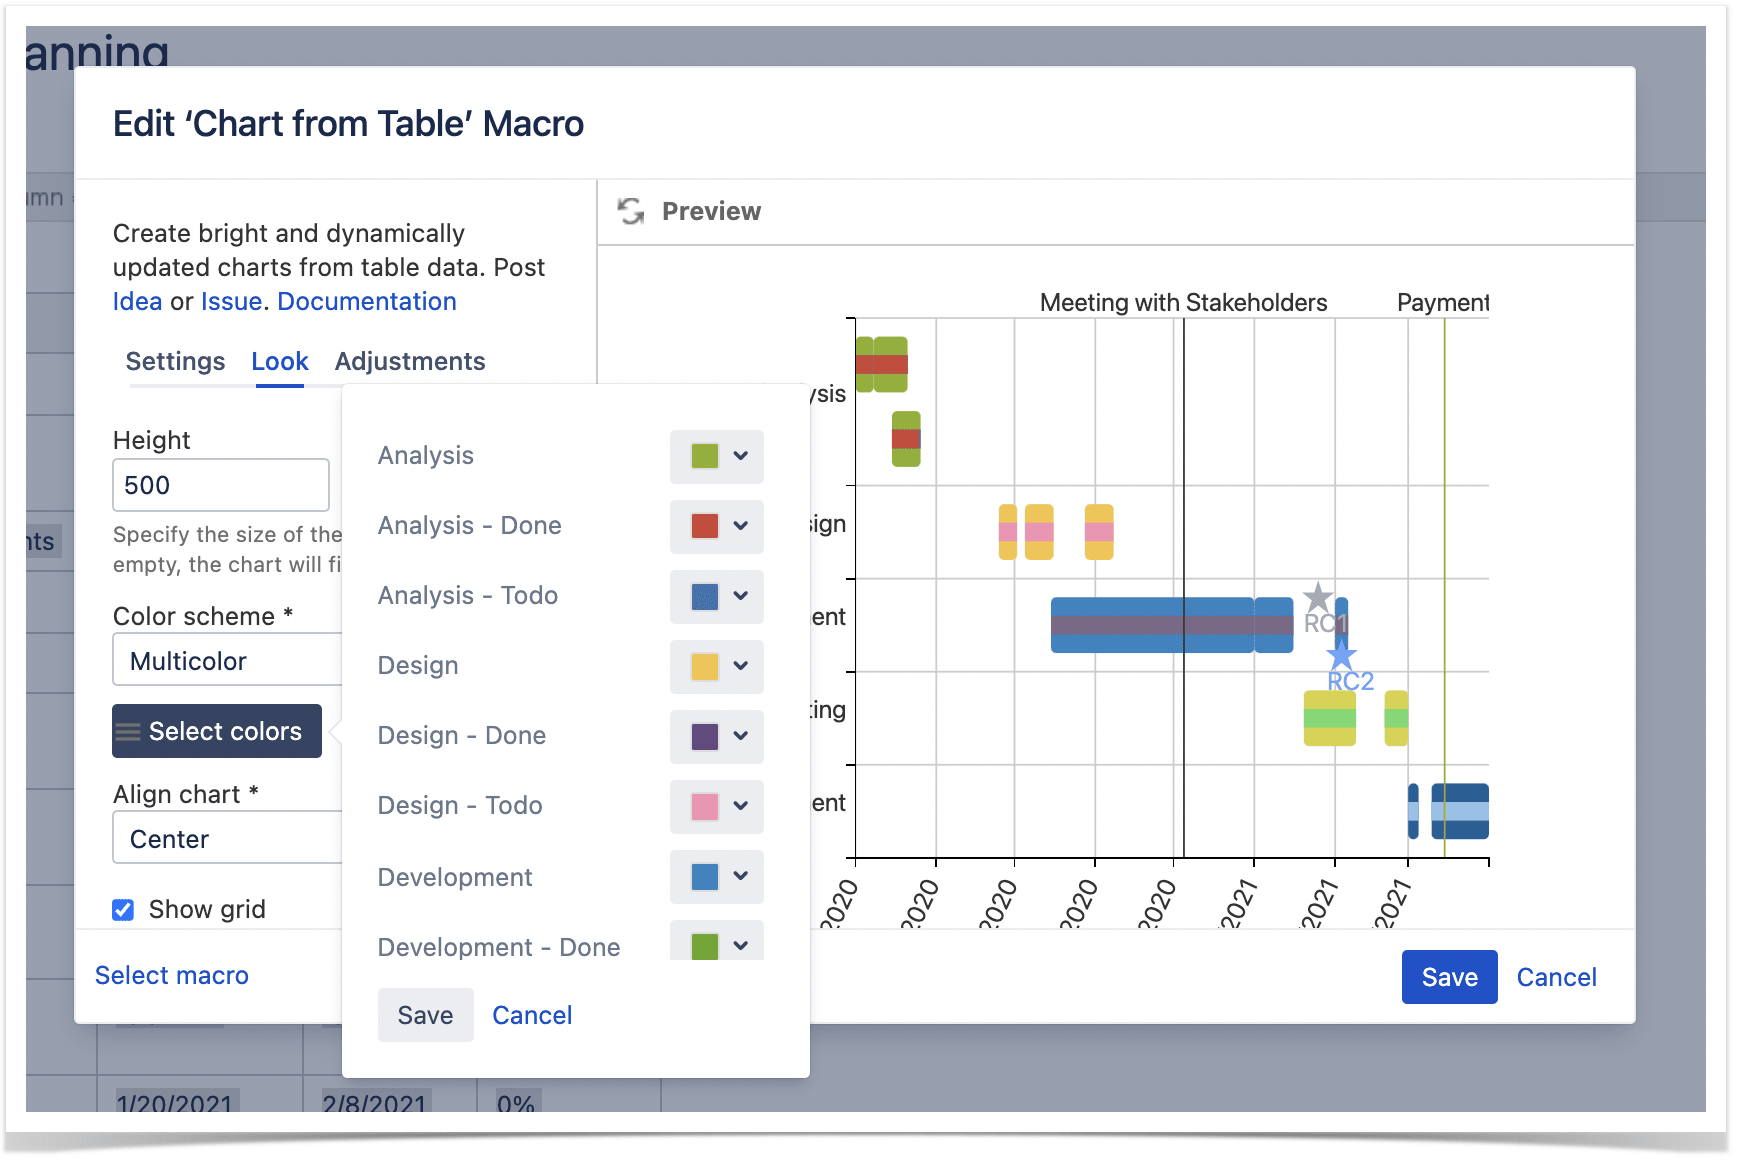
To configure the chart, double-click the macro placeholder. First, select ‘Gantt’ as your chart type on the Settings tab. Here you also need to choose table columns that will form the chart. For the Labels column, select columns containing task types, names of events, or milestones. For the Values column, you need all the columns with dates or completion percentages.

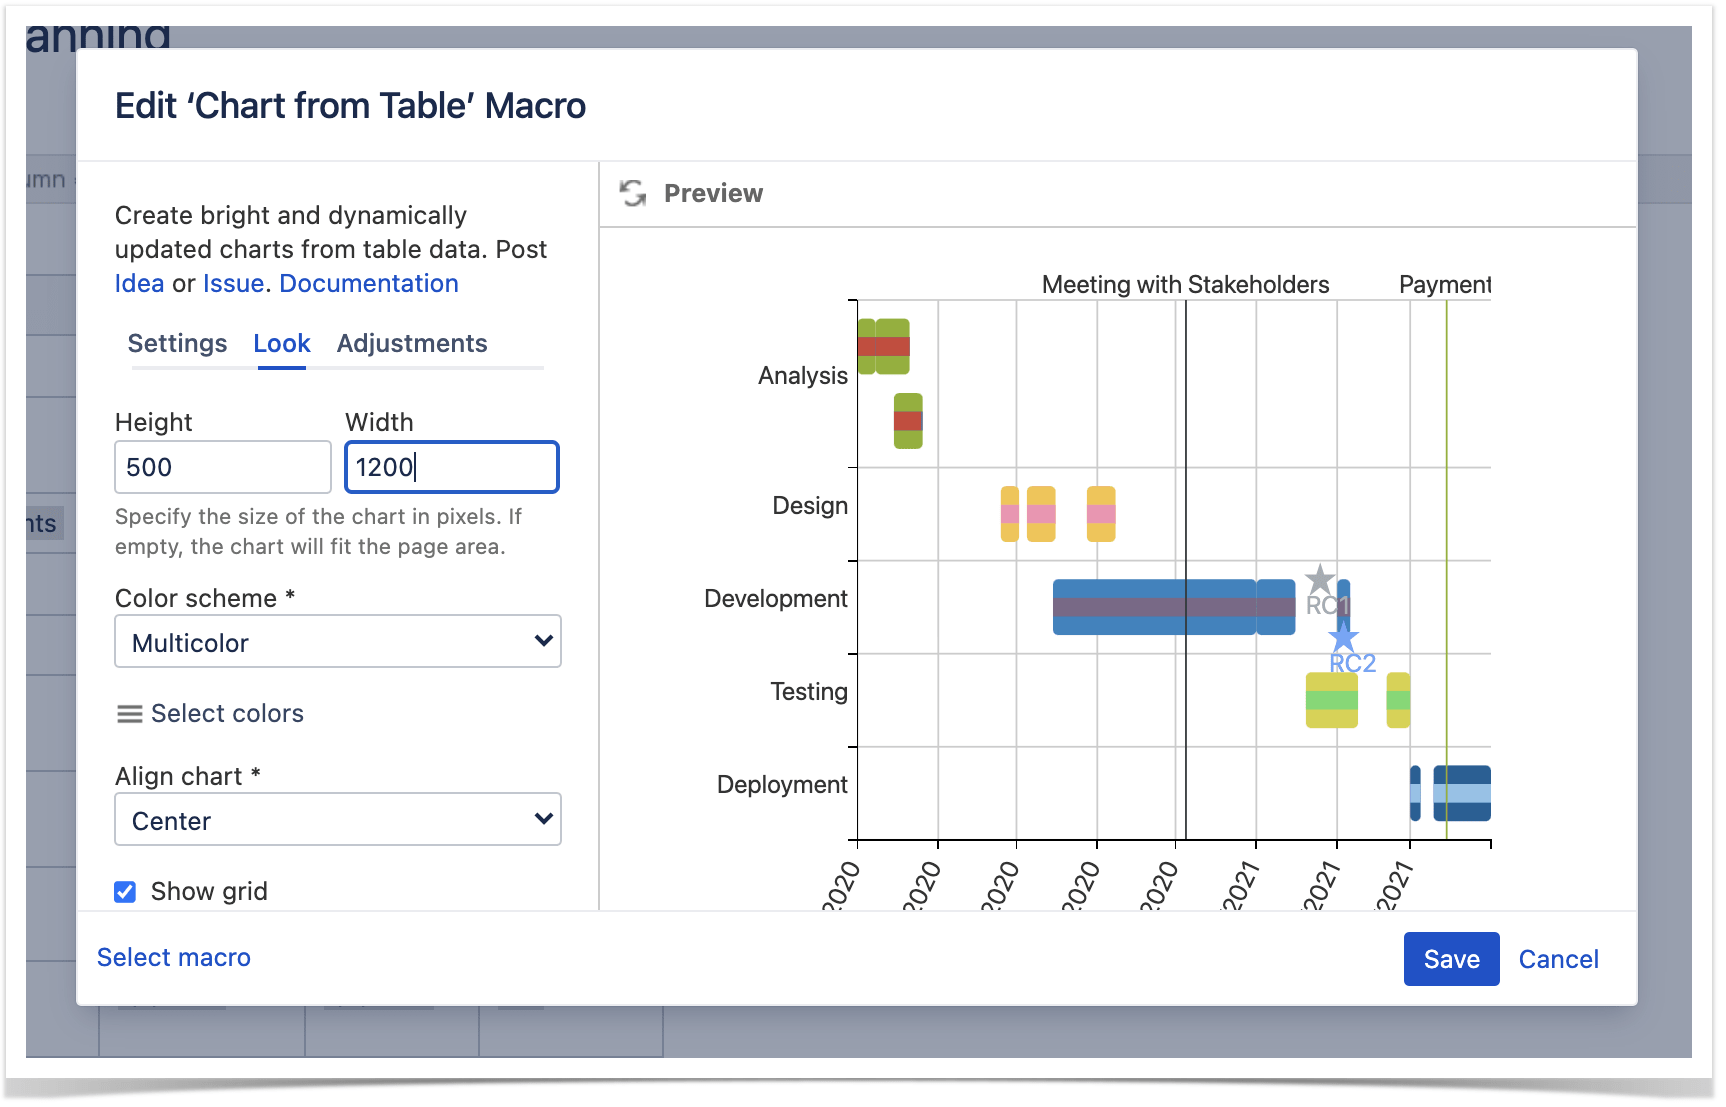
In the Look tab, you can adjust the height and width of the chart to fit into your page perfectly. You can also change the color scheme.
If you switch to the Adjustments tab, you’ll be able to specify the correct date format and set worklog settings.

After you save the macro and the page, you’ll see your Gantt chart ready. Here in the view mode, you can still change the chart look. You can add more columns with data or remove the already existing ones, or you can change the colors of the chart. If you want to adjust the size even more, you can do this too. You can also zoom it in or out to see a more specific period.
Here you can also add the dependencies between tasks. Click the cogwheel icon on the chart control panel and select the Set dependencies option. Pull out the arrows and match the tasks correctly.

There you have it! You can build a Gantt chart from scratch right on your Confluence page with the Table Filter and Charts for Confluence app.
If you have any questions, feel free to contact us or leave a comment on this blog post.

![]()