Case Study: How M20 Technology uses Confluence for customer and partner relationship management (CRM & PRM)

About M20 Technology
M20 Technology, an Atlassian Expert Partner in New York City, helps companies work and collaborate more effectively through the use of Atlassian tools.
Atlassian Confluence is the knowledge base and team collaboration tool of choice for M20 Technology. Over the years they’ve gathered a great load of Confluence best practices for various cases. One of them is managing customer and partner relationships in Confluence.
How M20 built a CRM and PRM in Confluence
As a fast-growing business, M20 recognized the need for customer and partner relationship management (CRM & PRM). They needed an overview of their customers, prospects and partners to help build strong and sustainable relationships with them. For most organizations, such visibility is essential for continued success and growth of a business.
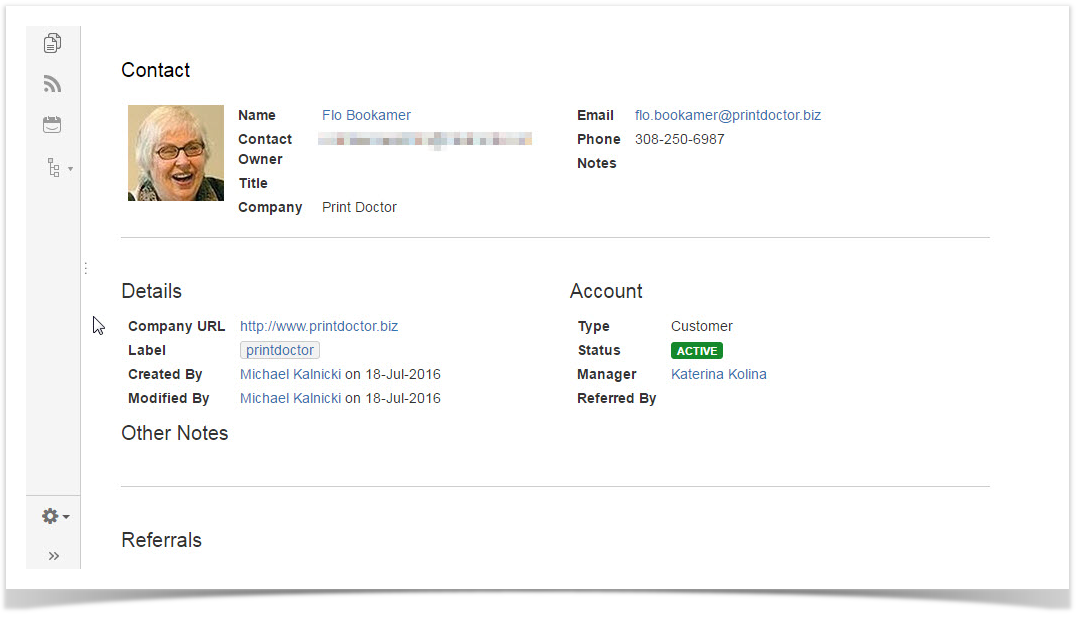
As a business that specializes in building solutions in Confluence, the natural solution was to build it there and here is what it looks like today:
This post covers a simplified solution of what M20 Technology uses today. This version makes it easier to get started and create a basic framework you can customize and build upon. If you are interested in learning how to build a more comprehensive solution, check out this webinar hosted by ServiceRocket and M20 Technology.
To set up such a system in Confluence, M20 Technology extended their wiki with 4 add-ons:
- Google Apps Connector by M20 Technology – to connect Confluence with a company’s Google Apps account to retrieve contacts details
- Reporting and Scaffolding by ServiceRocket – for building a table with contacts of customers and partners on a Confluence page
- Table Filter and Charts for Confluence by StiltSoft – to dynamically filter the contacts table, e.g. search for a specific contact, find all contacts of a certain type (customer, prospect, or partner) or within a given location, hide columns irrelevant for a current session
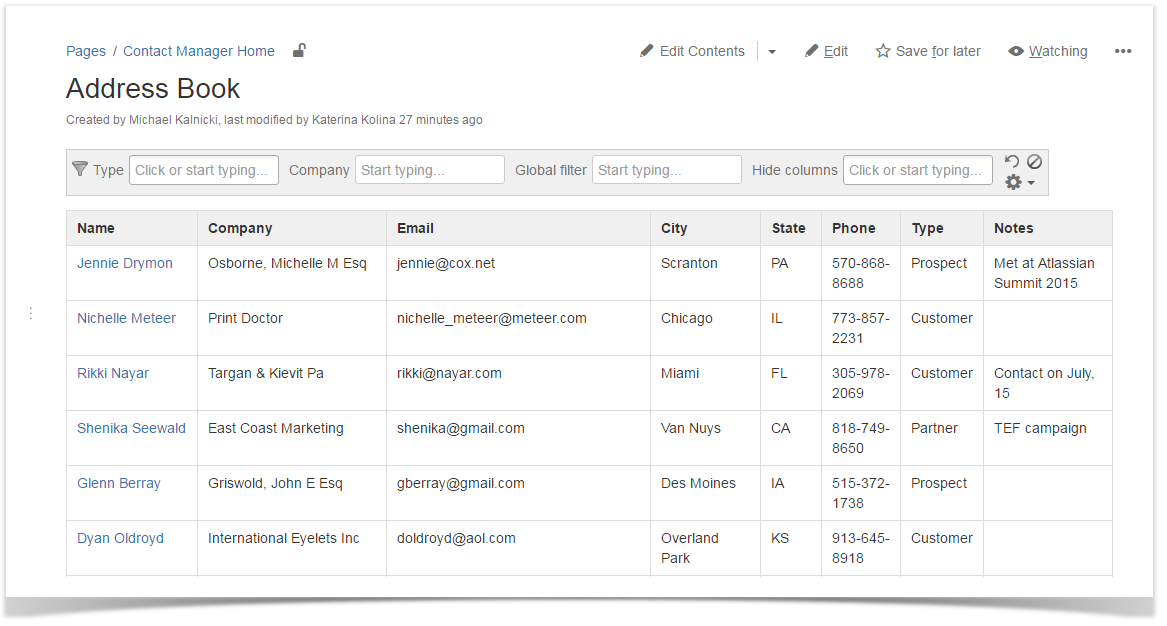
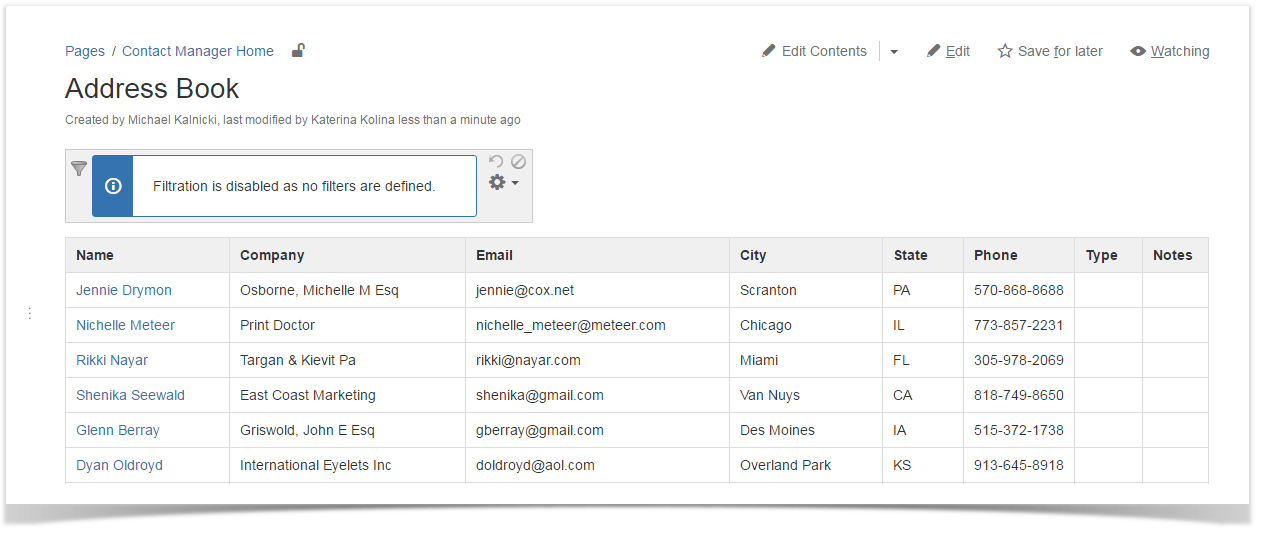
It allowed them to create a table with contacts similar to the one below:
This example contacts table includes:
- 6 columns that are automatically populated with data from a linked Google Apps account: Name, Company, Email, City, State, Phone
- the Type column, which has a predefined list of options a maintainer of a contacts table needs to manually choose from (customer, prospect, partner)
- the Notes column, where you can enter any additional contact related information
It’s up to you to decide what columns to use in your own contacts table. You can tune it as you wish by adding new columns (e.g. contact status, job title, LinkedIn profile, lead source) and deleting those you don’t need.
Setting up a contacts table
Let’s see how to configure this contacts table.
To get started:
1. Install the Google Apps Connector, Reporting, Scaffolding, and Table Filter and Charts for Confluence add-ons.
2. Set up a Google Service account and authorize it in Confluence. Configure Google Apps Connector (see the Administrator Guide for details). If you don’t have a Google Apps account, you can skip this step and proceed by creating a dynamic table. Though you’d need to fill out your table manually adding one row at a time.
Then create a Confluence page for your contacts table and set up a structure of macros on it as described below. It requires some work, but it’s initial configuration that needs to be done only once.
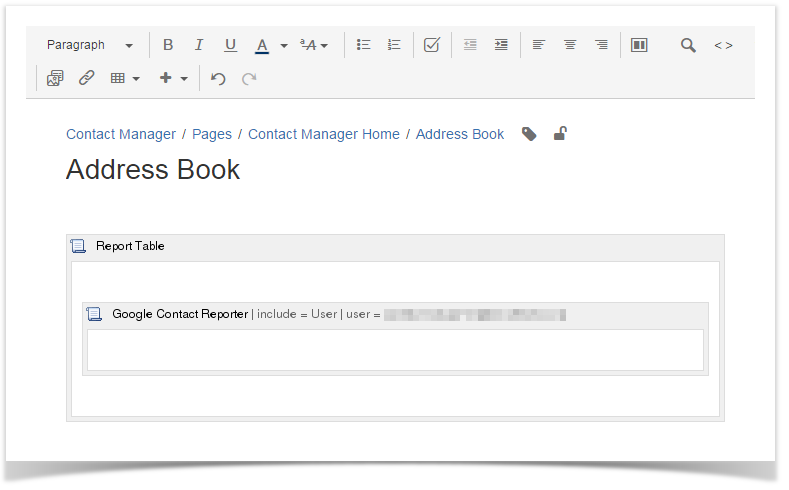
While editing a page, insert a Report Table macro. Inside its body, add a Google Contact Reporter macro. In reporter, specify whether to list contacts from all Google Apps accounts linked to Confluence or only from some of them.
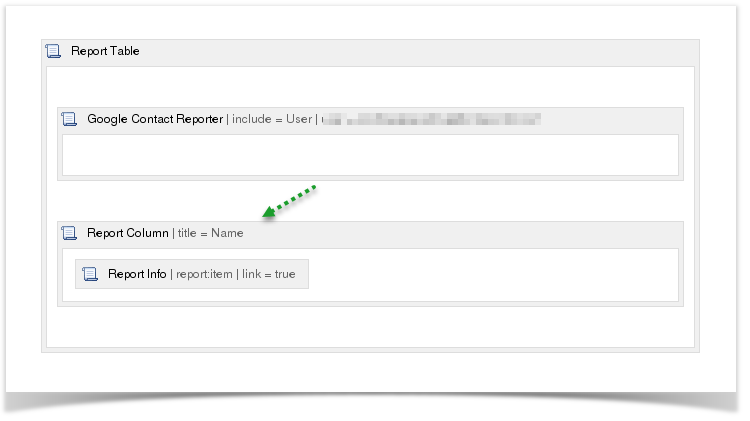
Below the Google Contact Reporter macro, you need to add 8 ‘Report Column’ macros:
1. Title the first Report Column Name. Embed a ‘Report Info’ in it. Set the ‘Report Info’ key to ‘report:item’ and check the ‘Link To Item’ box. It will display the contact’s name and link to the contact’s profile page.
2. The title for the second one is Company. Check the ‘Injected’ box for it. Insert a ‘Report Info’ inside its macro body with the key ‘contact:company’.
3. Next four Report Columns are also injected ones. Meaning you need to check the ‘Injected’ box for them. But they don’t require ‘Report Info’ macros. Insert the following keys in their macro bodies instead:
- %contact:email% for the Email Report Column (to output the contact’s email address)
- %contact:work address > address:city% for the City Report Column (to extract the city property of the contact’s work address)
- %contact:work address > address:state% for the State Report Column (to display the state of the contact’s work address)
- %contact:phone% for the Phone Report Column (to render the contact’s phone number)
4. The remaining Report Columns are Type and Notes. Both of them are also injected:
- Inside the Type Report Column insert a ‘List Data’ macro. Specify a field name for it and choose ‘Select’ as a type option. Then embed 3 ‘List Option’ macros in your ‘List Data’ with values ‘Customer’, ‘Prospect’ and ‘Partner’. This combination of macros will create a drop-down list with contact type options for you to select from
- And the last Report Column is Notes. Add a ‘Text Data’ macro in its body. Provide a unique field name and select ‘line’ as the type of field. It will display a text field in each contact record for you to type in your notes when working with a report.
Now the configuration of your contacts table is done. It’s time to add filtration to your report. To do that, insert a Table Filter macro on the very top of your page and move the ‘Report Table’ macro with all those macros embedded in it inside Table Filter.
You can set up your filters right here while editing a page or later when viewing your table. Let’s first save the page, see our contacts, and then get back to filtration.
Ta-dah. We’ve got a table with all our Google Apps account contact details right in Confluence.
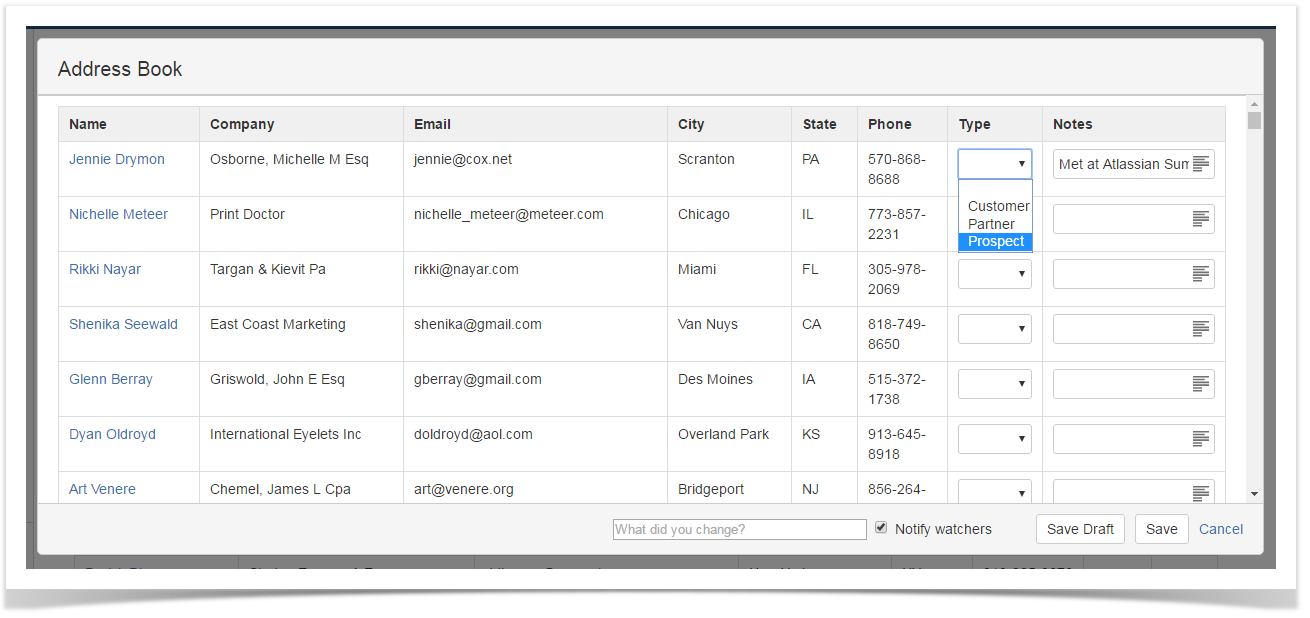
Initially Type and Notes columns are empty. To work with them, click the ‘Edit Contents’ button on the page. You’ll have your table displayed in a window, where you can select a contact type in a drop-down menu and enter text in the ‘Notes’ field.
Filtering and finding contacts
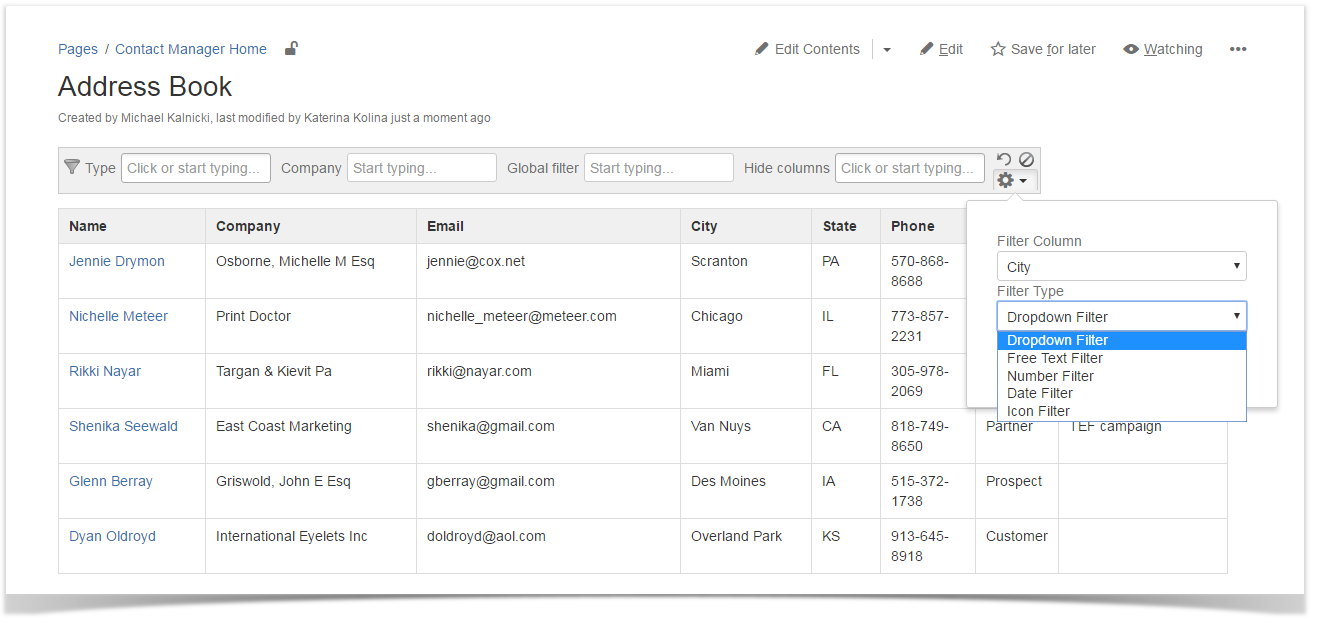
Your contact database is ready for you to work with. There is a variety of filters that will help you search, filter and analyze your massive contacts report. In this example we’ll use 4 of them:
- Global filter to search in all columns of a table
- ‘Company’ free text filter for search by Company name
- ‘Type’ drop-down filter to filter by contact type, e.g. to see only prospects
- Hide columns filter to select what columns are not important for your current goals and should be hidden
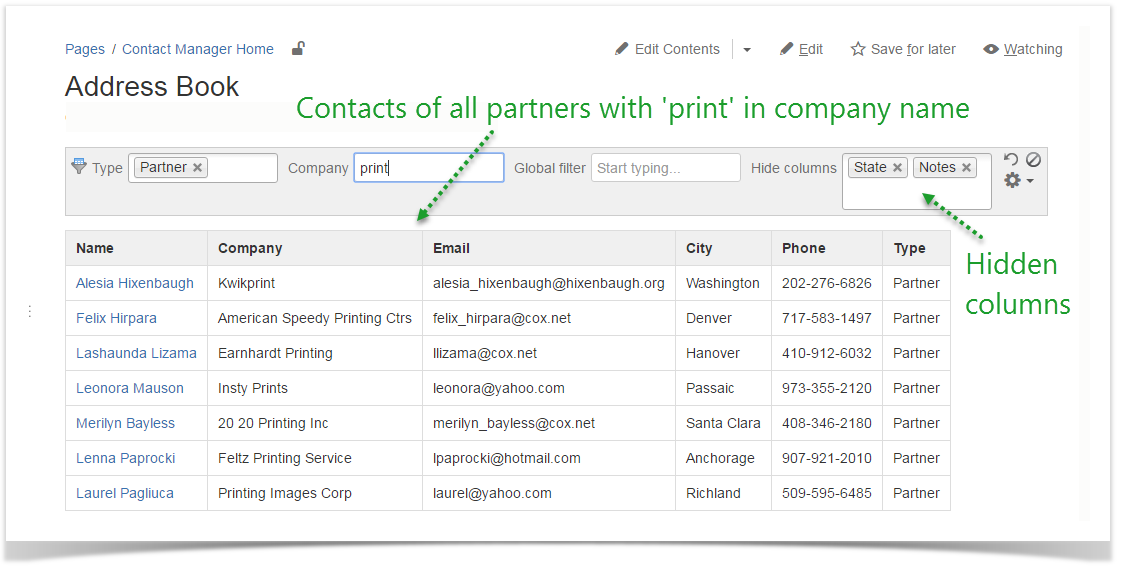
You can add filters and make changes in your filtration panel right in the View mode.
And have your report dynamically updated when you apply filters.
Moreover, you can create pivot tables and illustrative charts to get a summary of your contact table and analyze your contact list.
It’s incredibly convenient to manage your contacts in the platform where your collaboration happens. Hoping this detailed step-by-step guide makes it easy for you to set up CRM and PRM in your Confluence. And another amazing thing is that there are so many other ways your teams can benefit from add-ons used in this solution. So go ahead and try it!


