How to Aggregate and Reuse Data From Multiple Confluence Tables

Confluence allows you to create informative and well-structured documents to collaborate on. However, despite its sufficient capabilities, some room for improvement of Confluence native features remains. For example, Confluence offers a limited set of formatting tools that is useful when you deal with small tables and can slow down your work with processing table data on large Confluence pages.
Let us say that you need to get specific information from a big table in Confluence, aggregate it somehow, and add a new column. It sounds like too much work to do. Breathe freely – the Table Filter, Charts & Spreadsheets for Confluence app will automatically perform all the required operations. To prove this point, let’s solve a real use case.
Use case
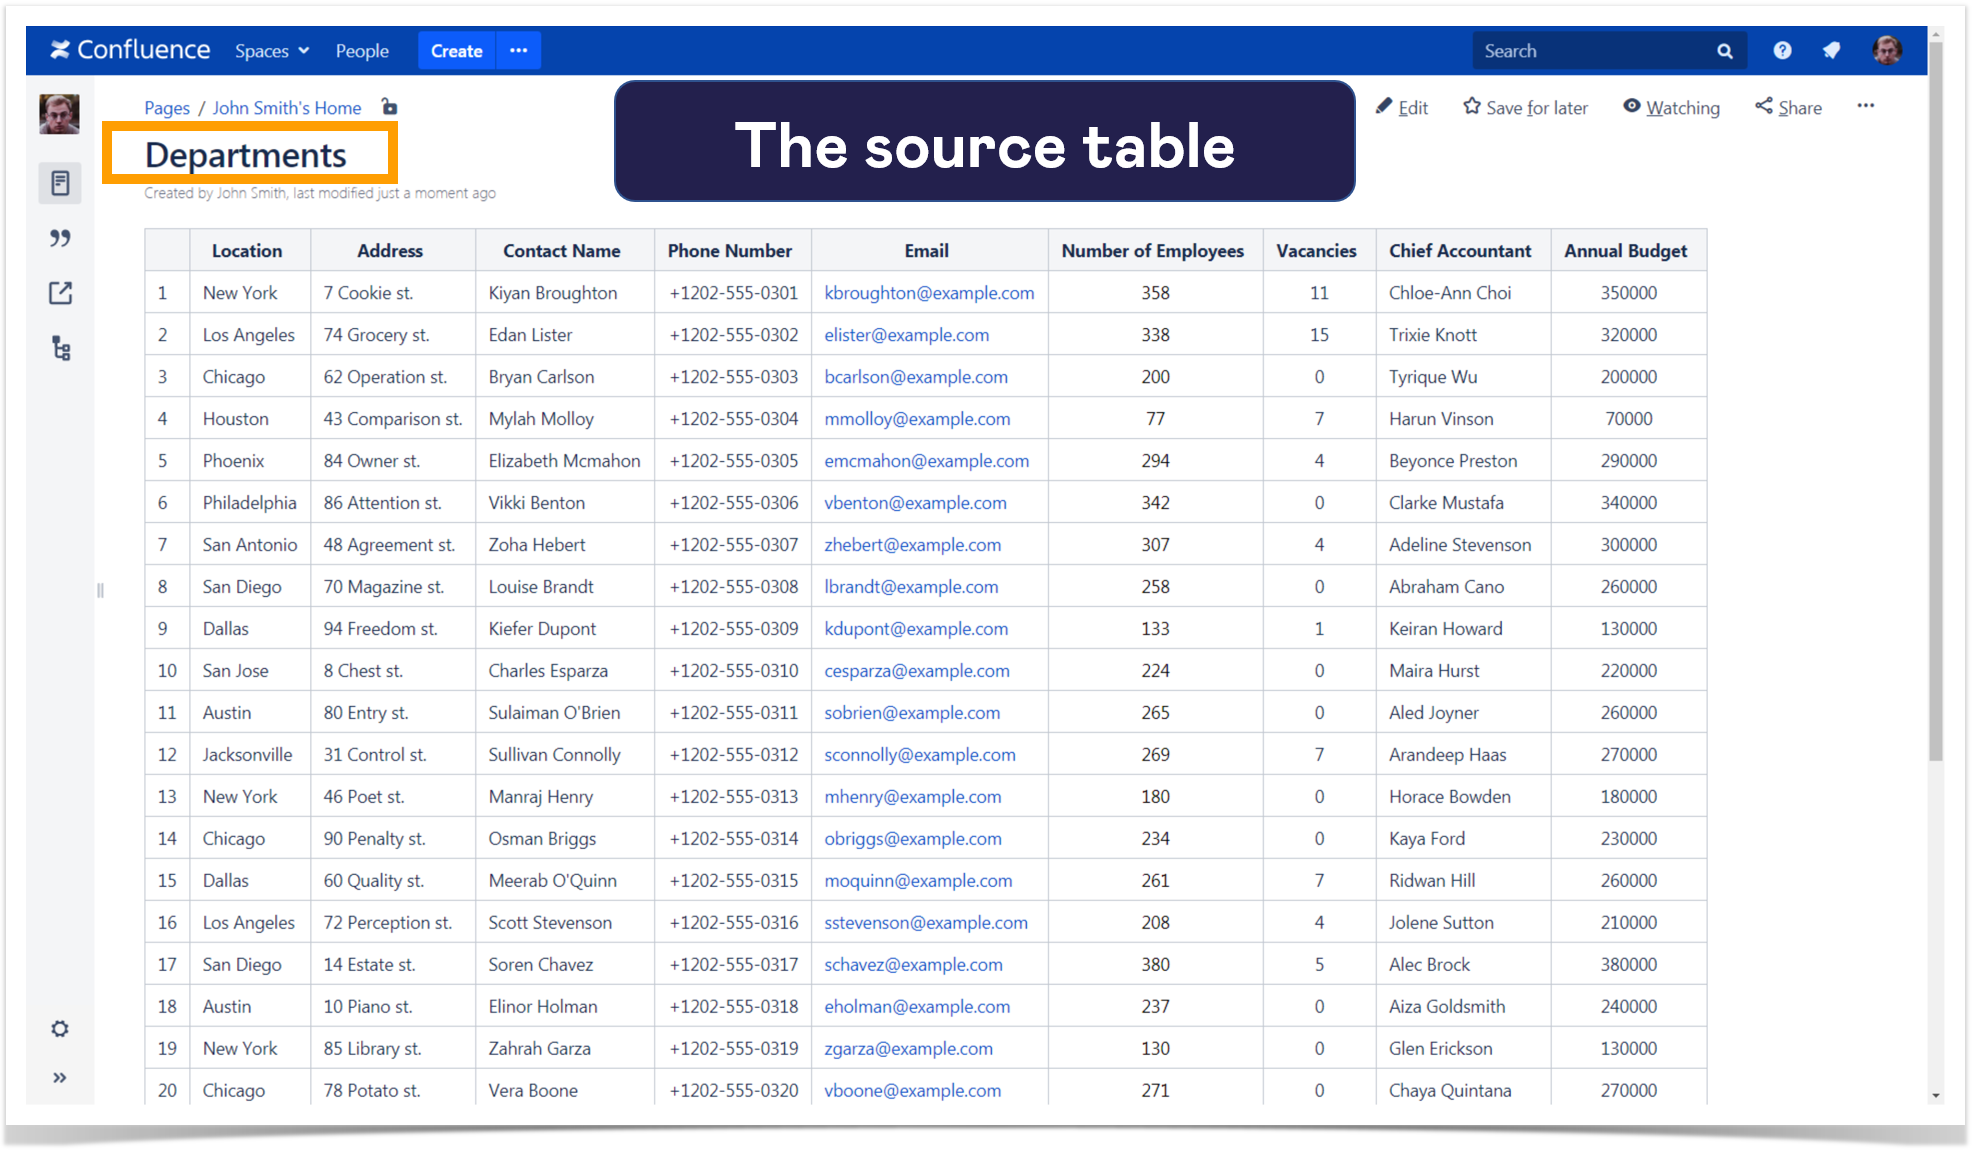
You have a big Confluence table related to all the departments of your company.
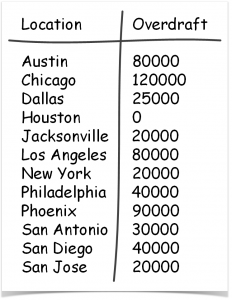
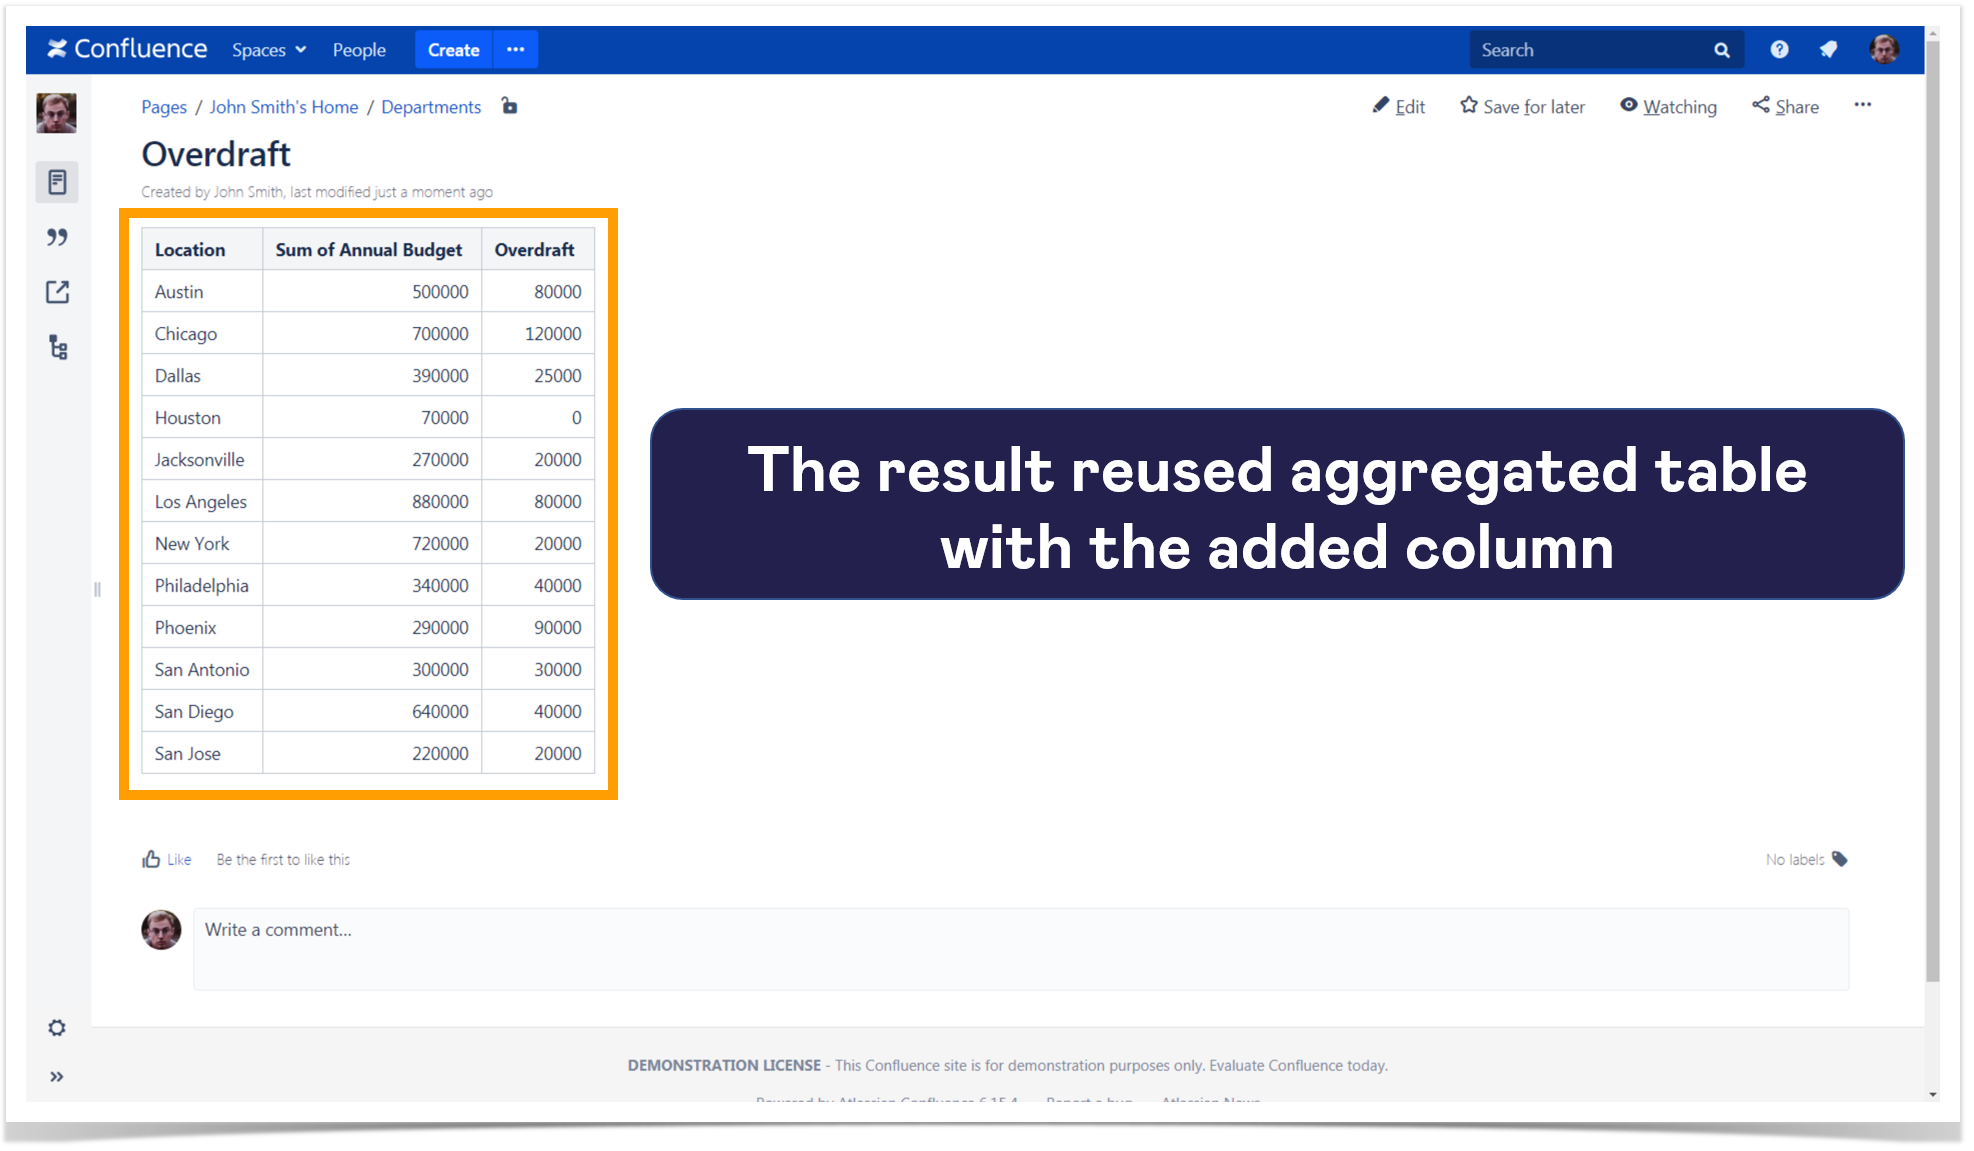
Now you need to combine these two tables and provide your colleagues with a new table containing locations, their total budgets, and overdrafts.
How to reuse Confluence tables effectively
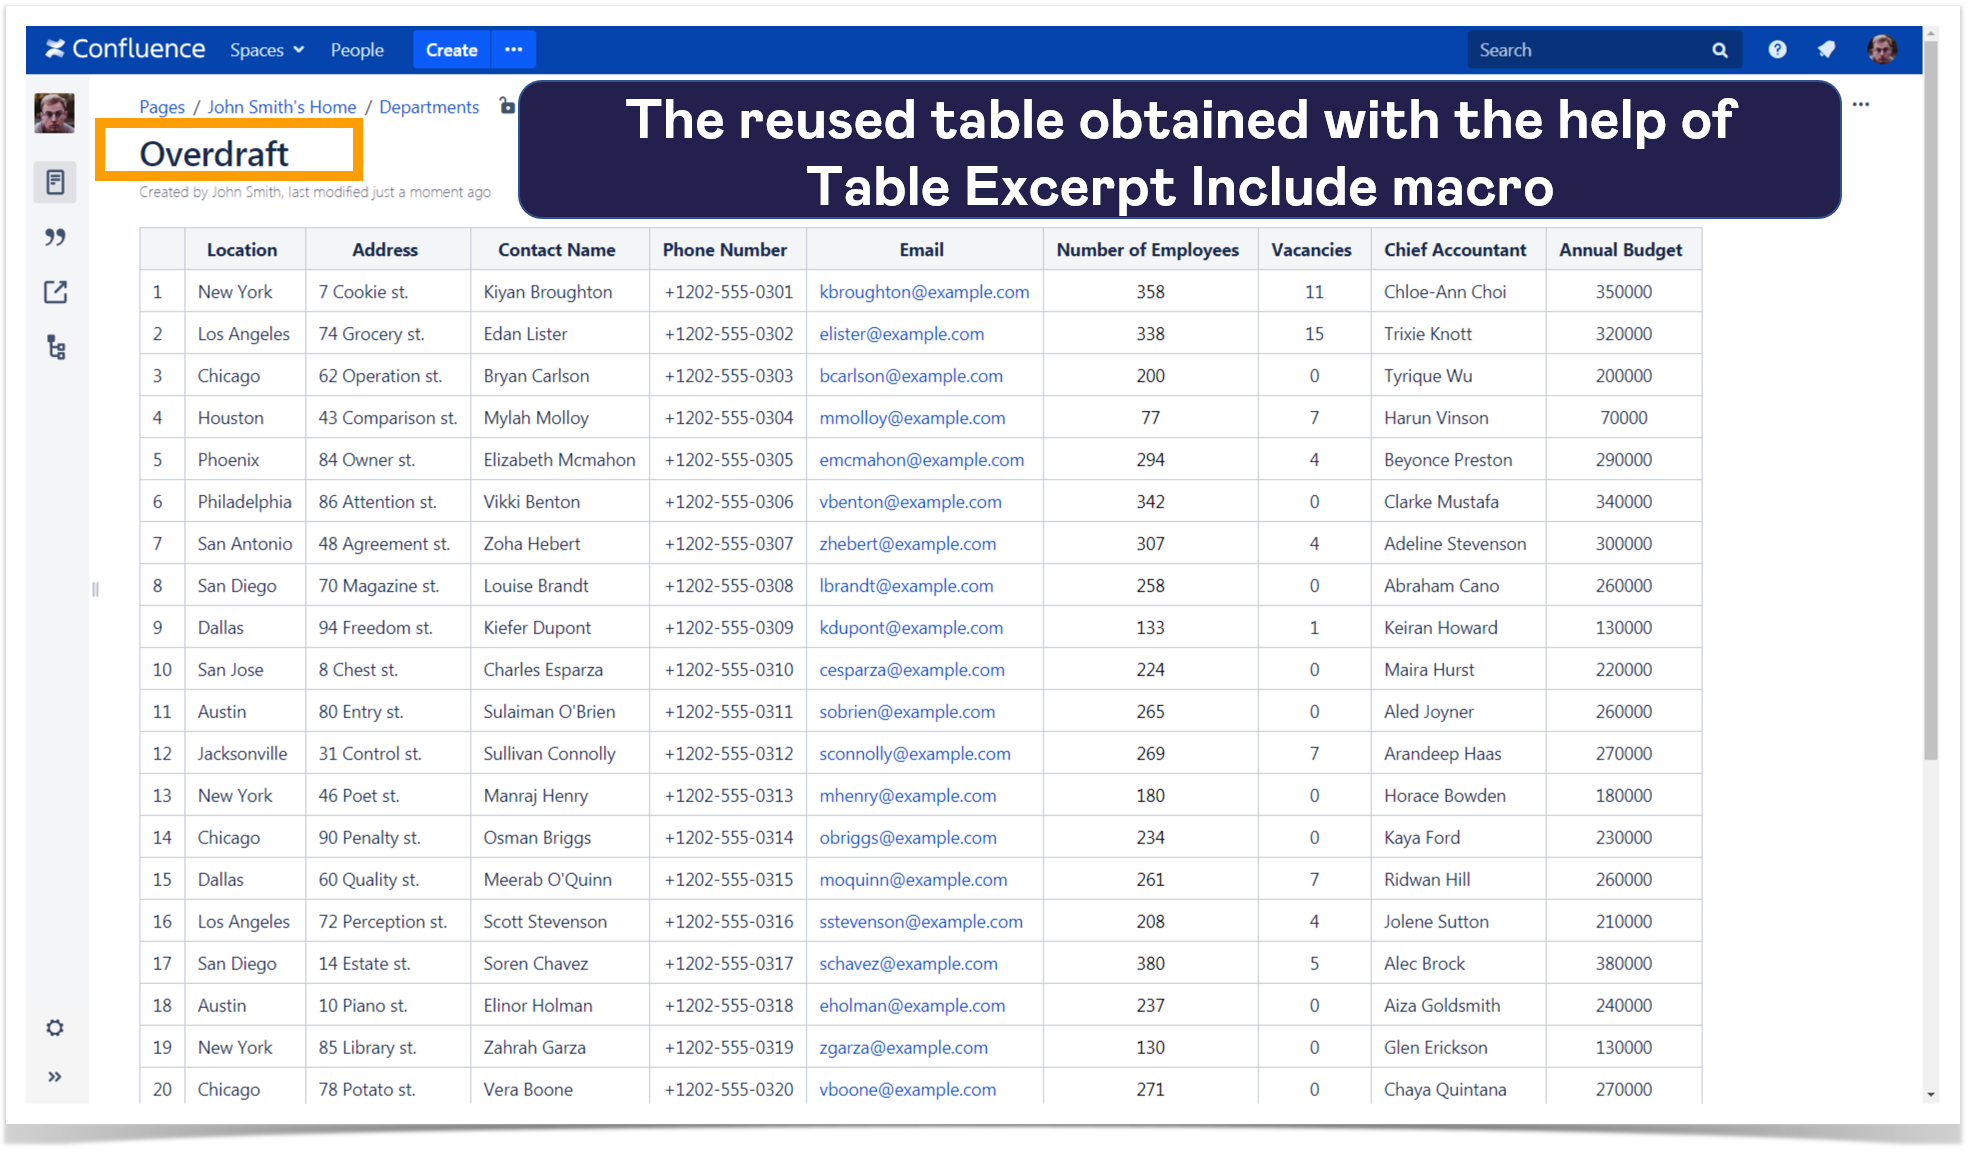
The simplest way to reuse a big table is to copy it to your page. But here is one significant inconvenience: soon your copied table may become outdated because it isn’t synchronized with the source one.
You can use the Excerpt and Excerpt Include macros to show your big table on another page. When you update the information in the source table wrapped in the Excerpt macro, the Excerpt Include macro automatically reflects the changes. However, if the page contains more than one Excerpt macro, the Excerpt Include macro will display only the contents of the first Excerpt. You can’t use multiple Excerpt macros on the same page.
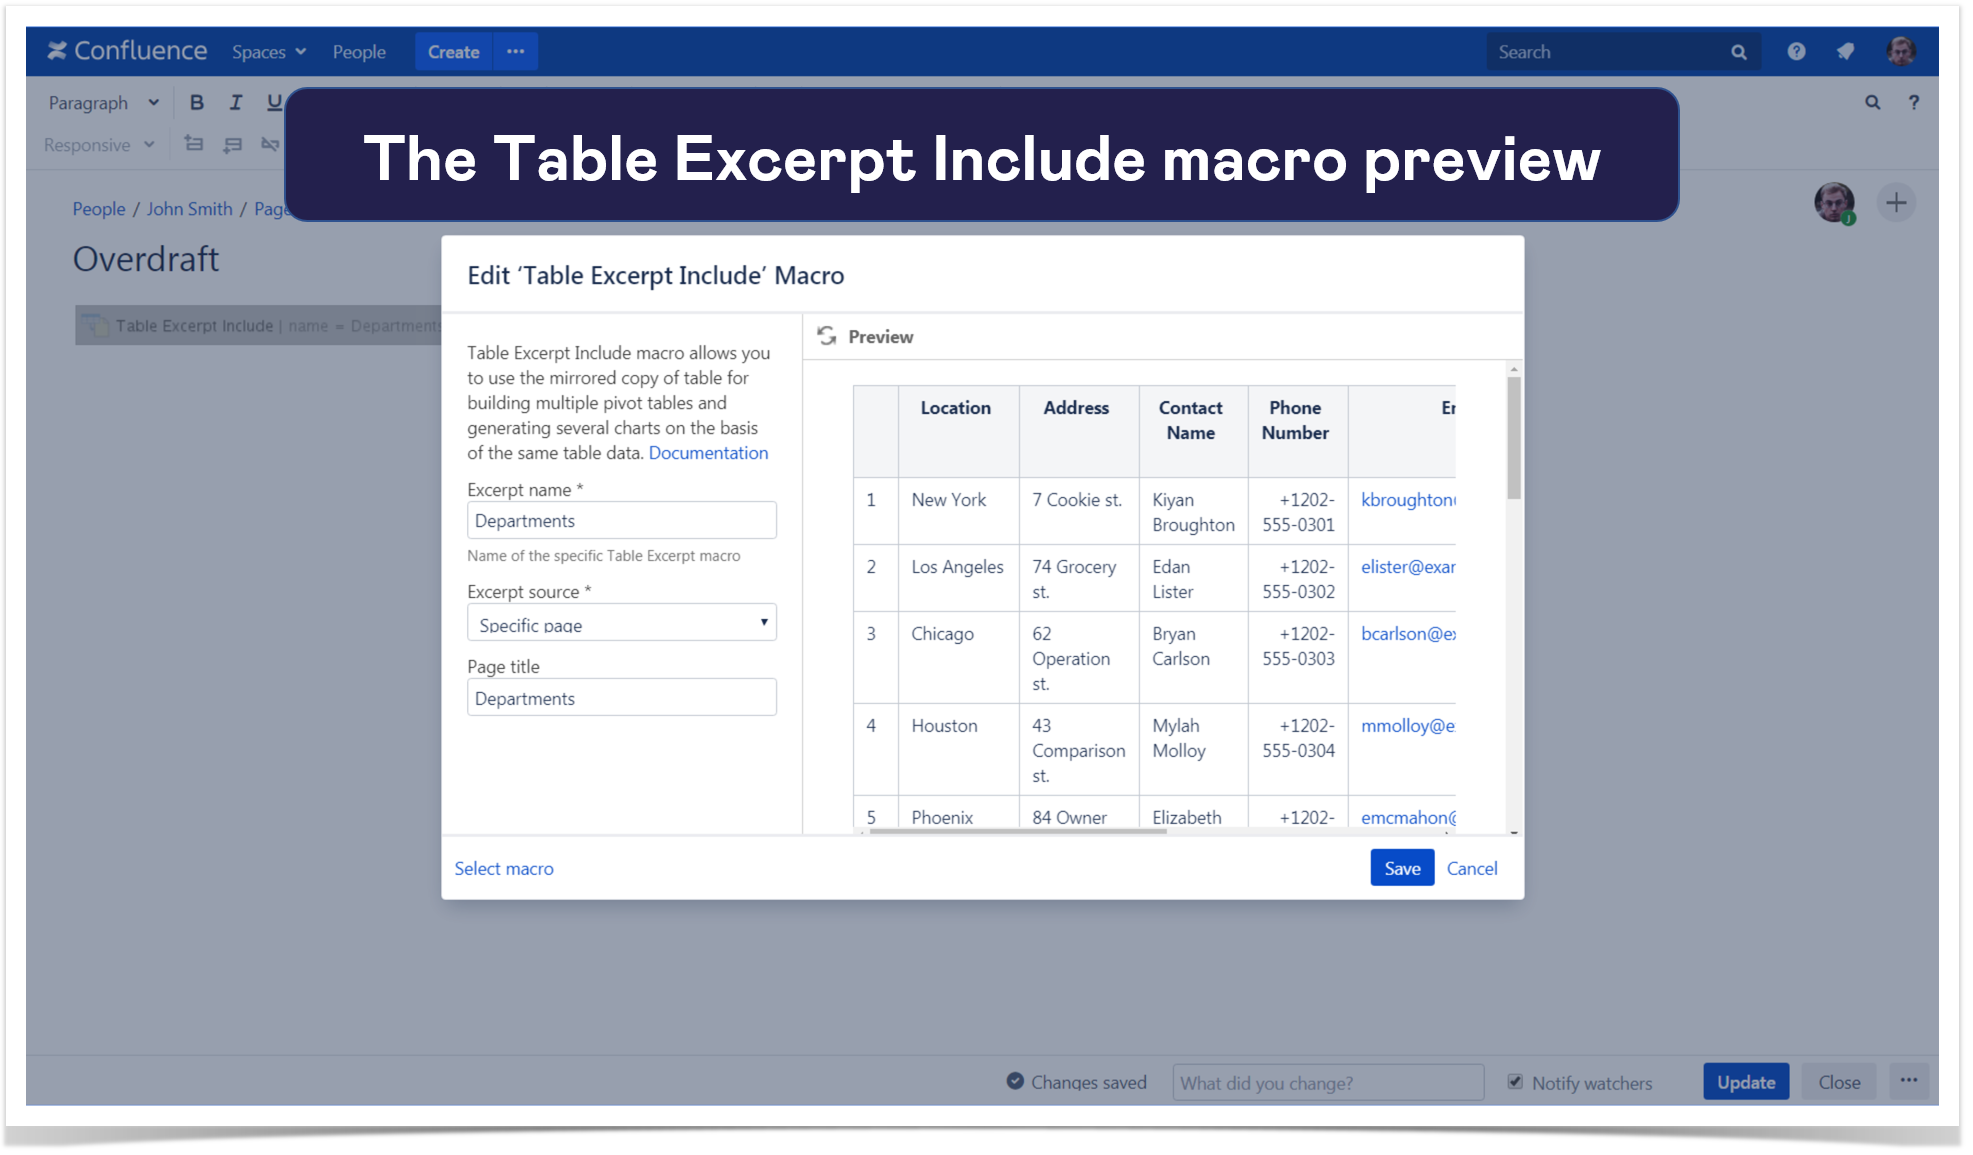
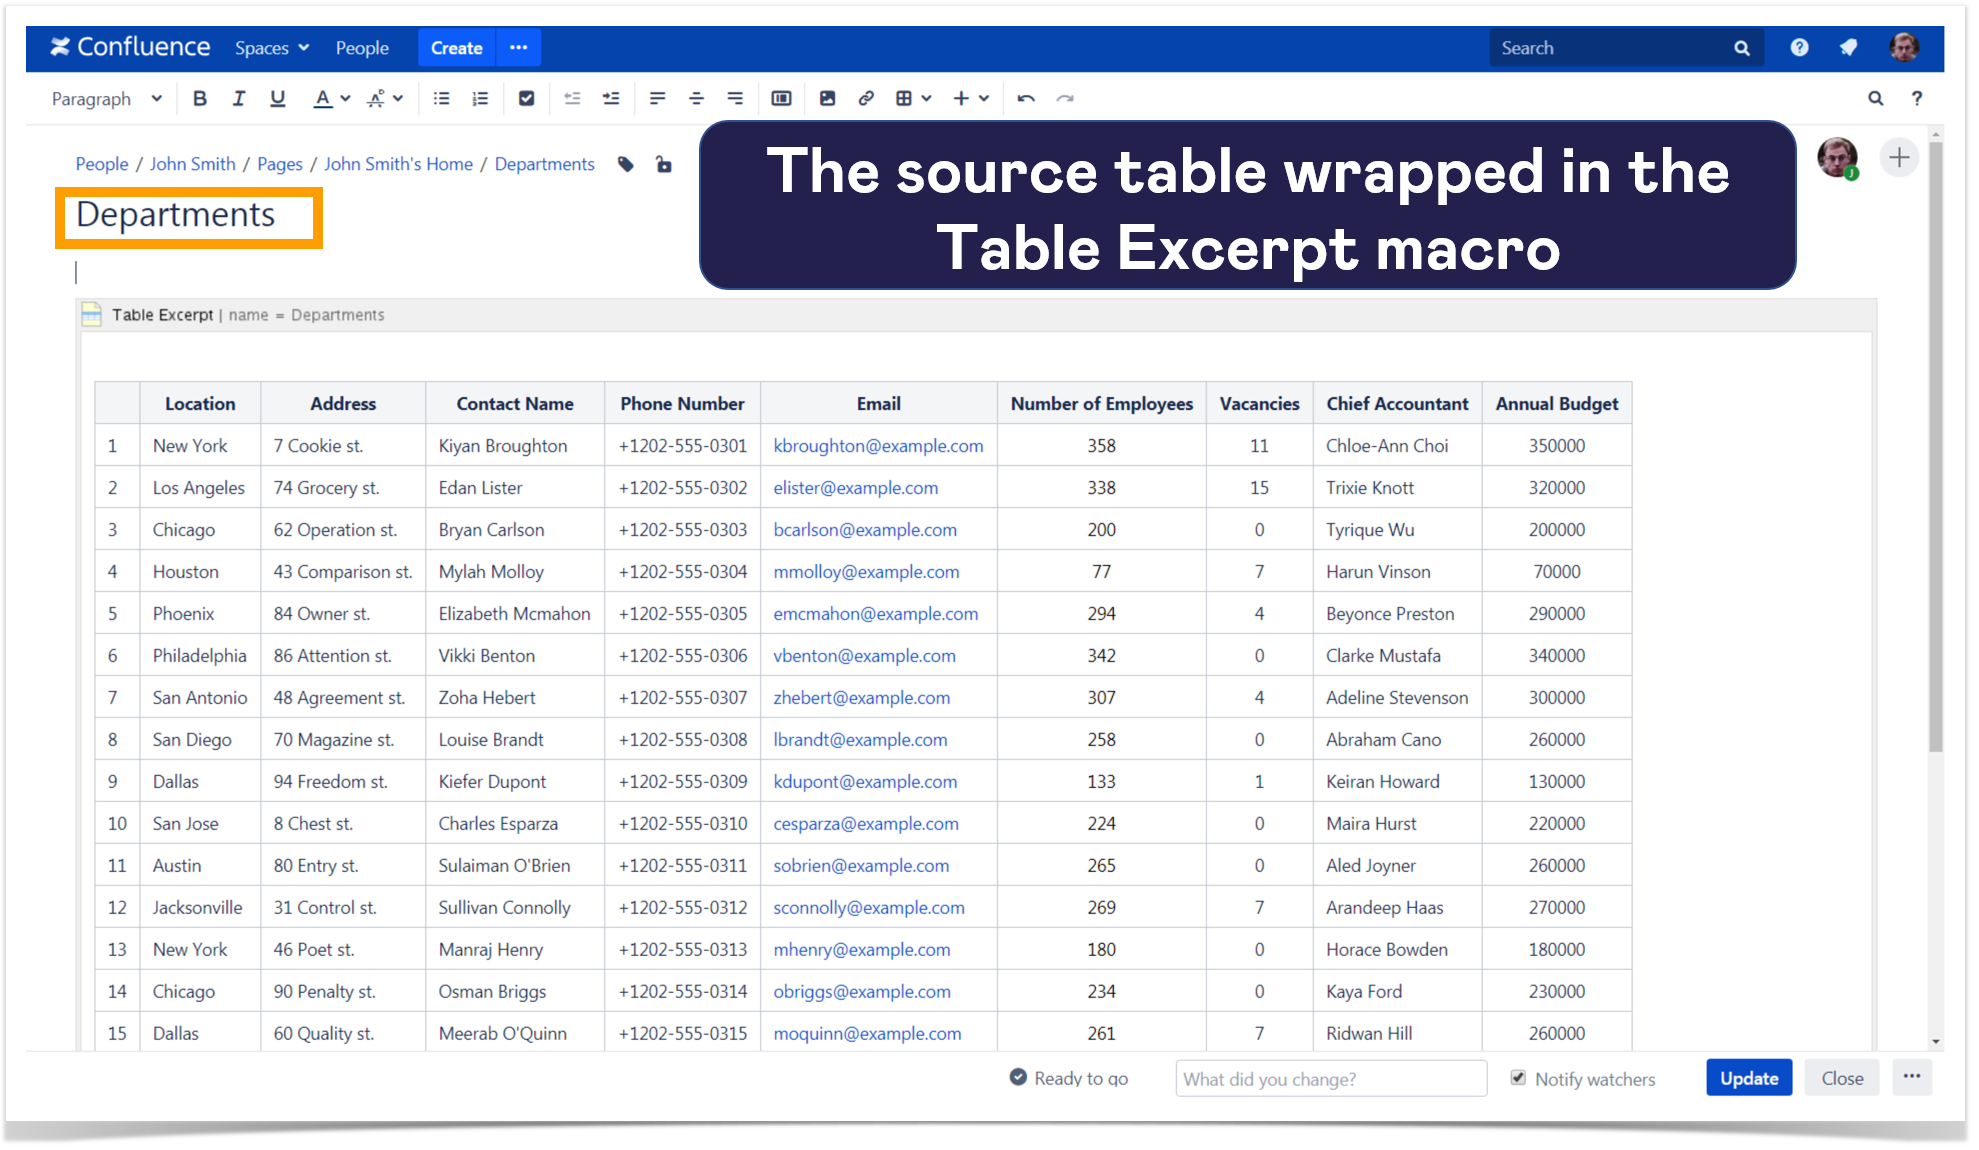
The best way is to use the Table Excerpt and Table Excerpt Include macros. They allow you to synchronize source and reused tables and recognize multiple Table Excerpt macros on the page.
All you need to do is to wrap the table in the Table Excerpt macro and type in its unique name. The Table Excerpt Include macro creates the reused table. Insert it on your page, select the source for the Excerpt macro (for example, a page with a specified title), and enter the corresponding Excerpt name.
How to aggregate table data
There is no workaround to aggregate table data with the help of standard Confluence tools.
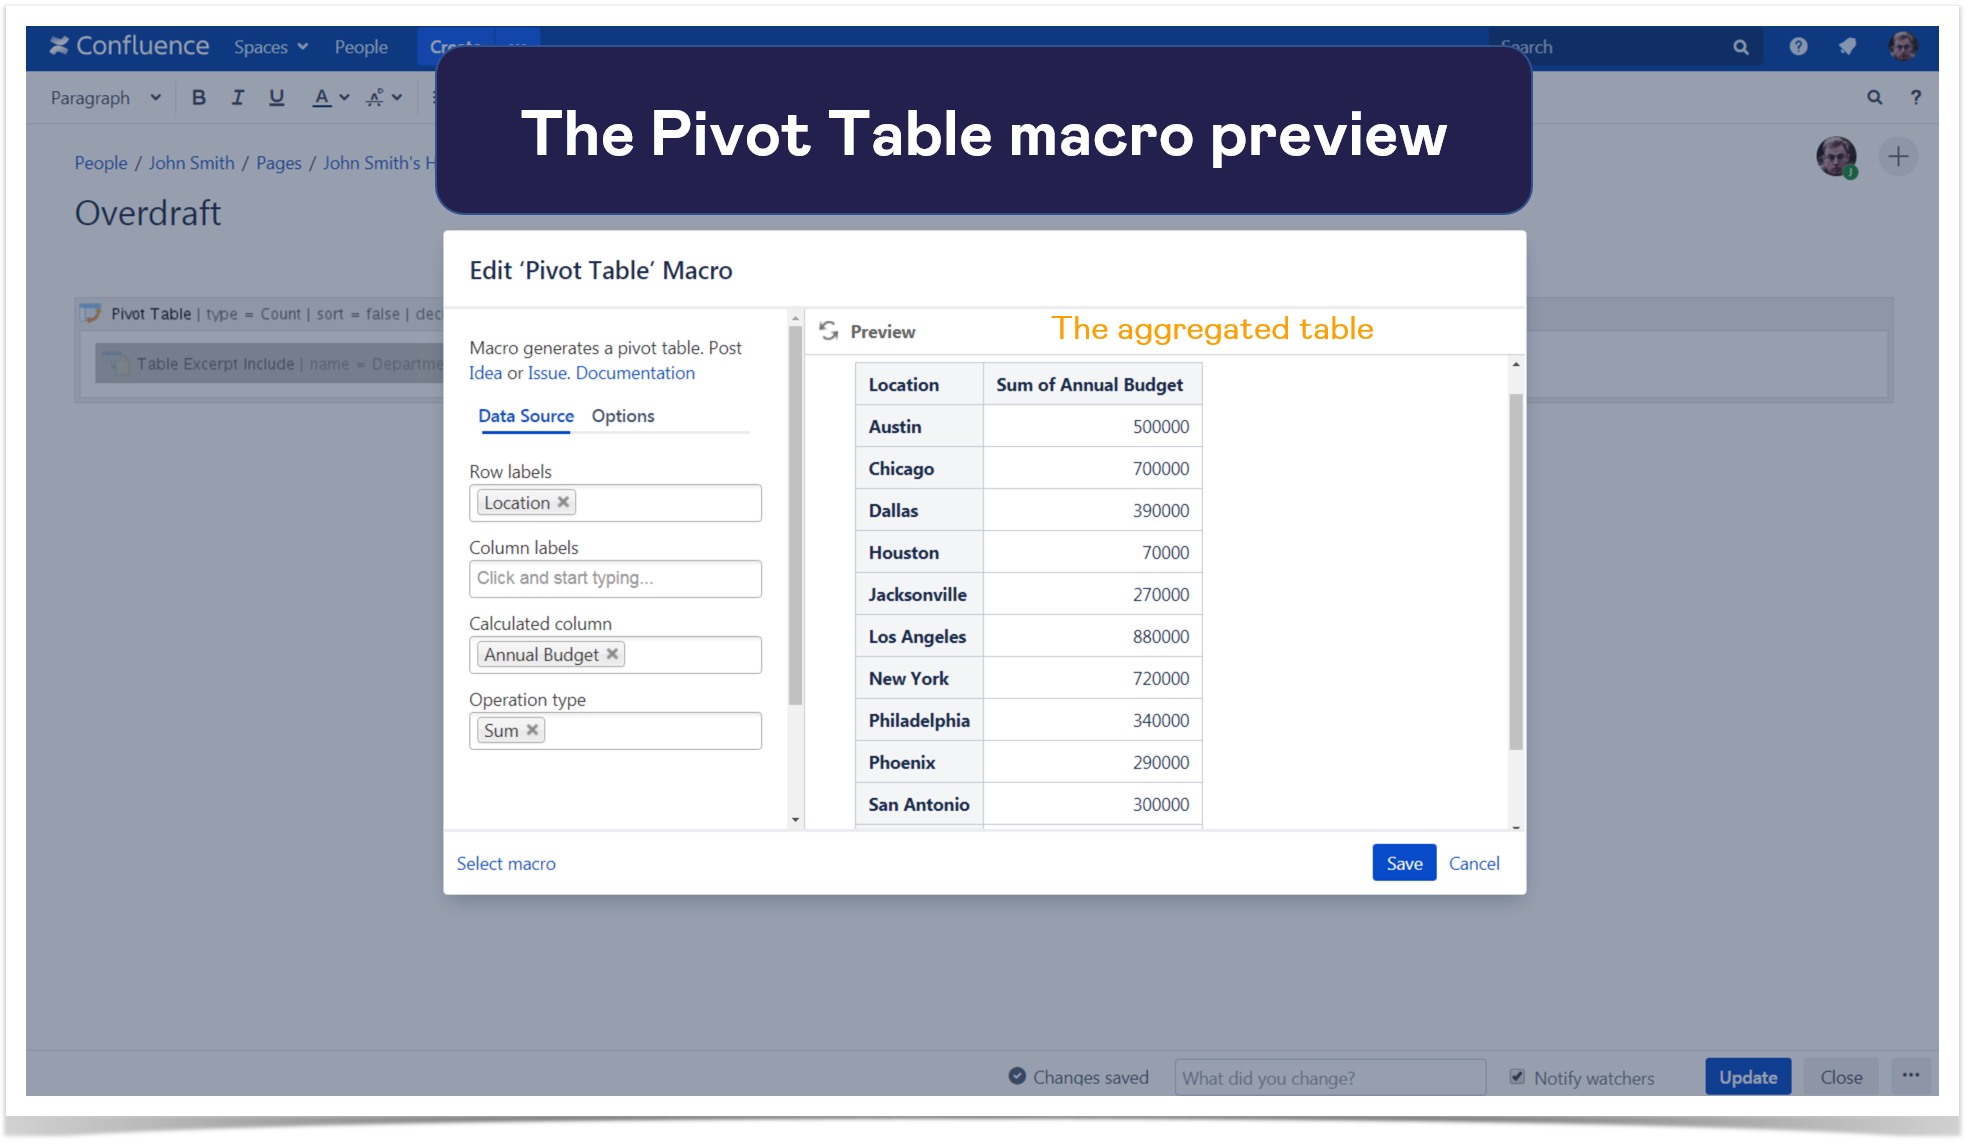
To get rid of manual calculations, wrap your reused table in the Pivot Table macro, and choose the required settings – everything will be done automatically.
For example, you can aggregate annual budgets by locations. The macro calculates the sums for all the departments related to the specific city.
How to add columns to reused tables
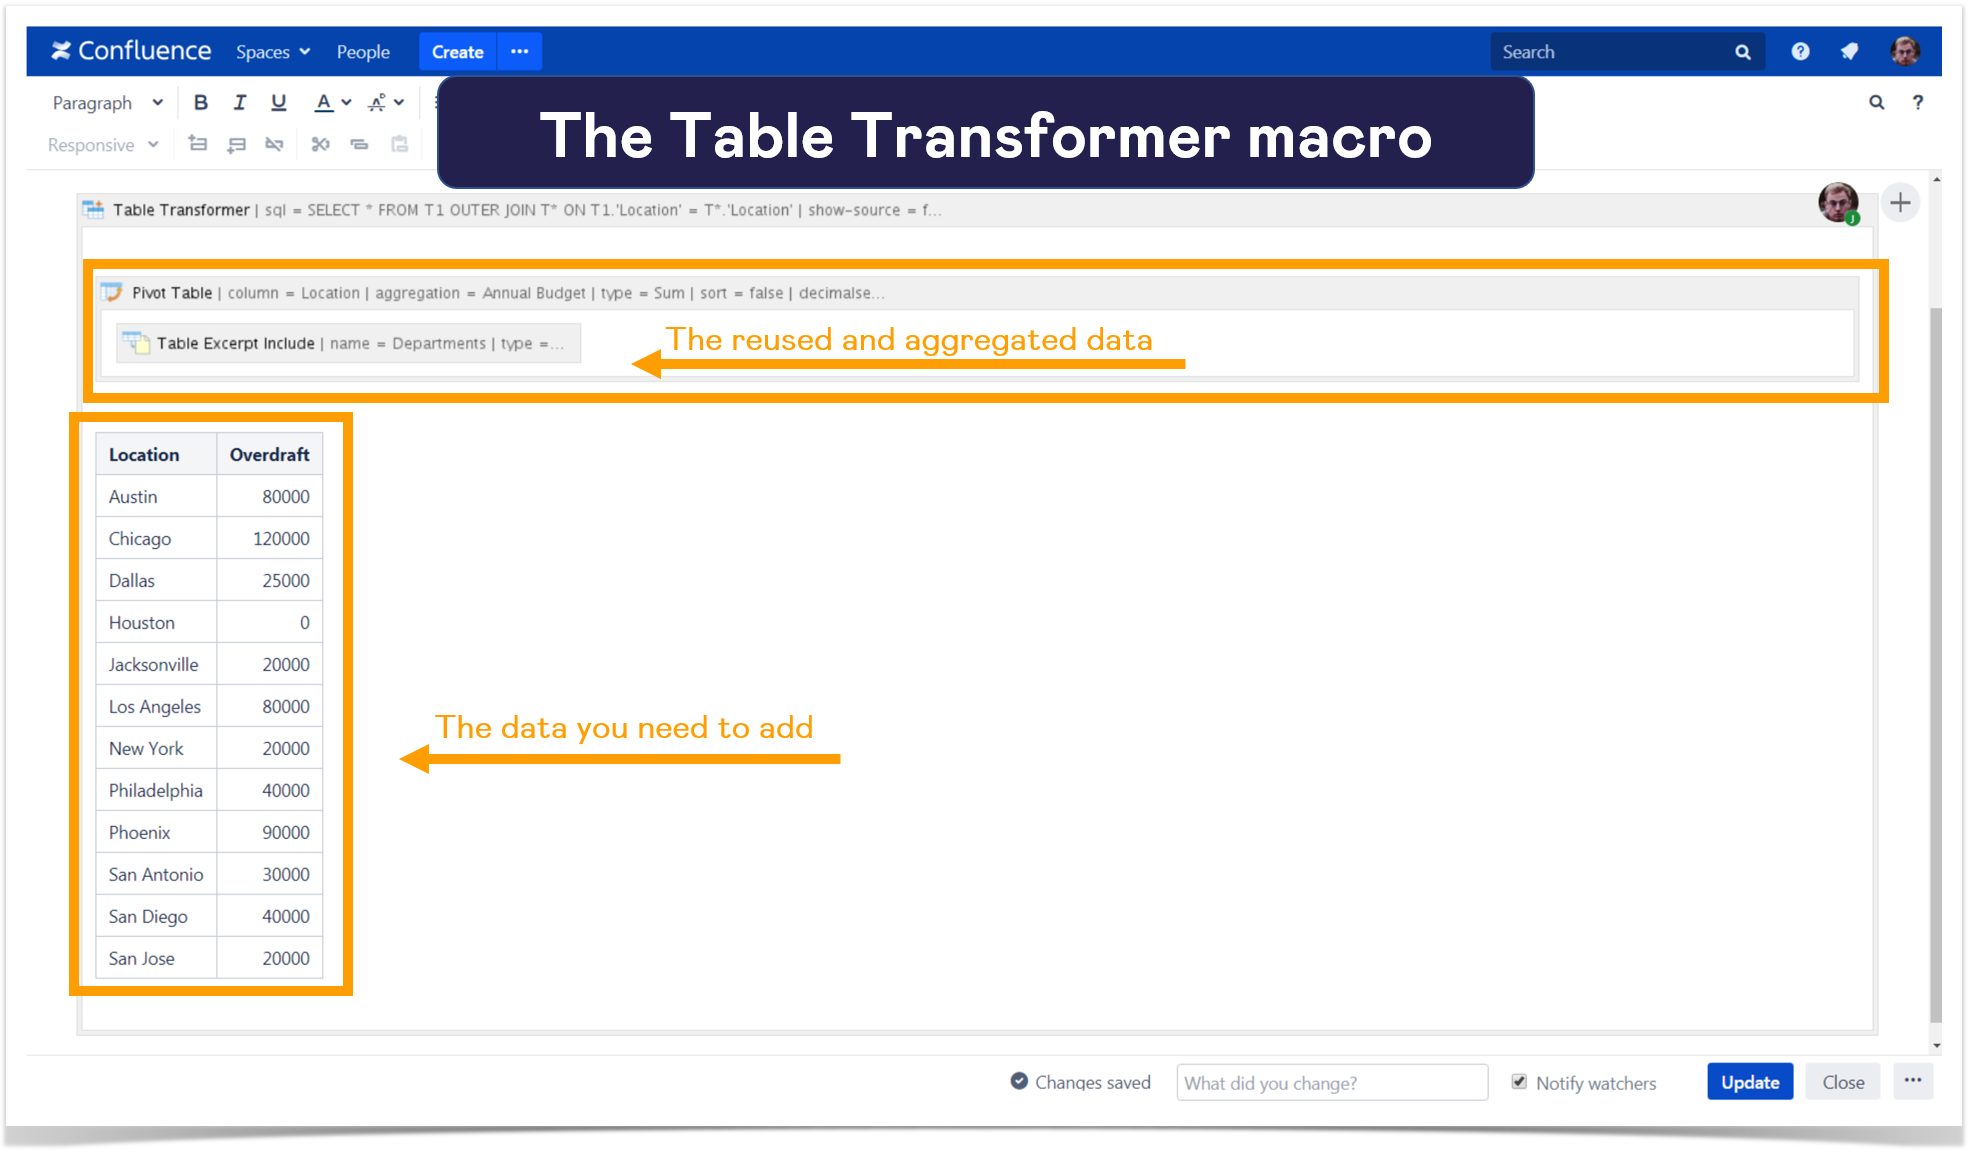
The last step is to add one more column to the reused table. You can easily do it with the help of the Table Transformer macro.
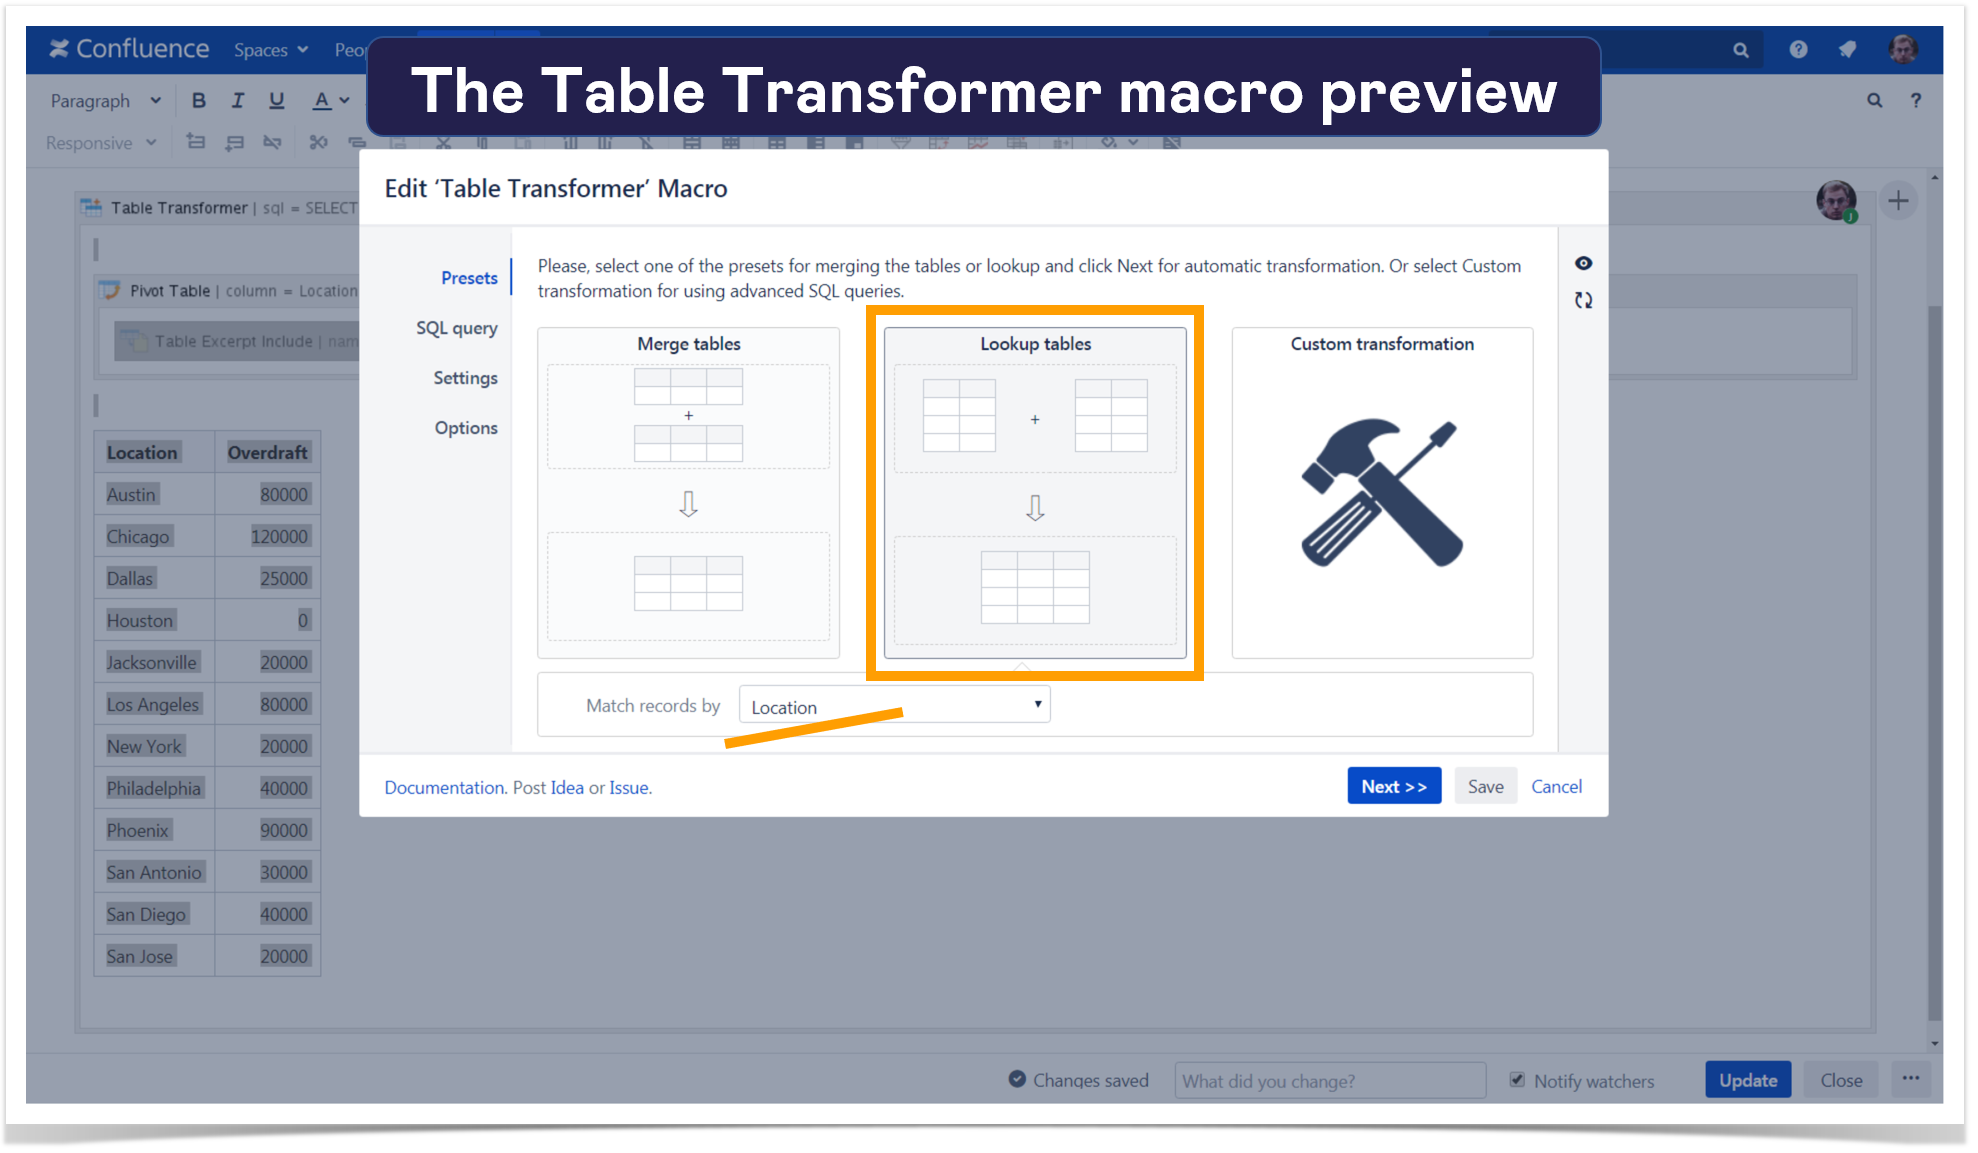
Just insert the macro, put your tables inside its body, and choose the suitable default preset or write your custom SQL query to get the result. In this case, you need to look up the tables by their common Location columns.
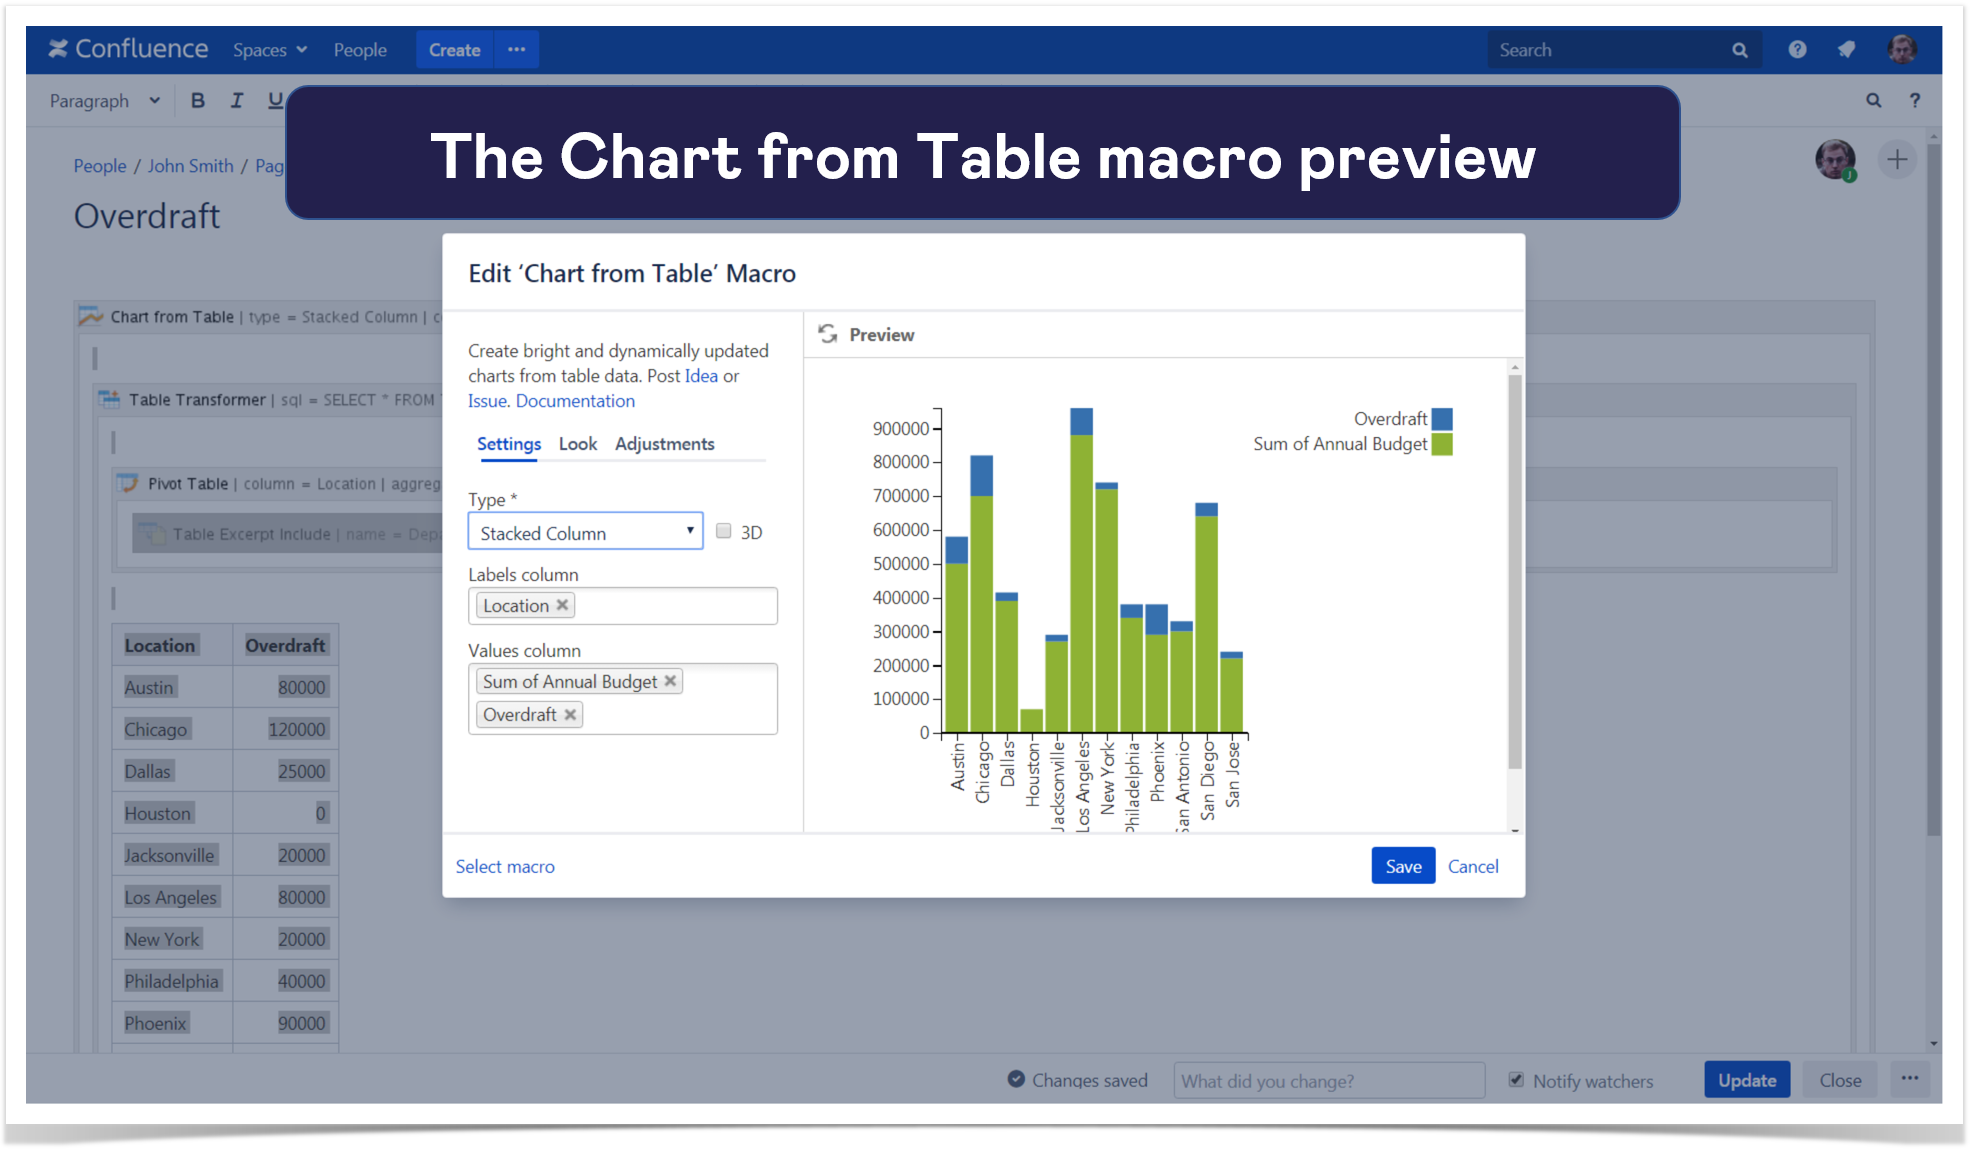
You can get even more information from the combined table, for example, visualize the data with the help of the Chart from Table macro.
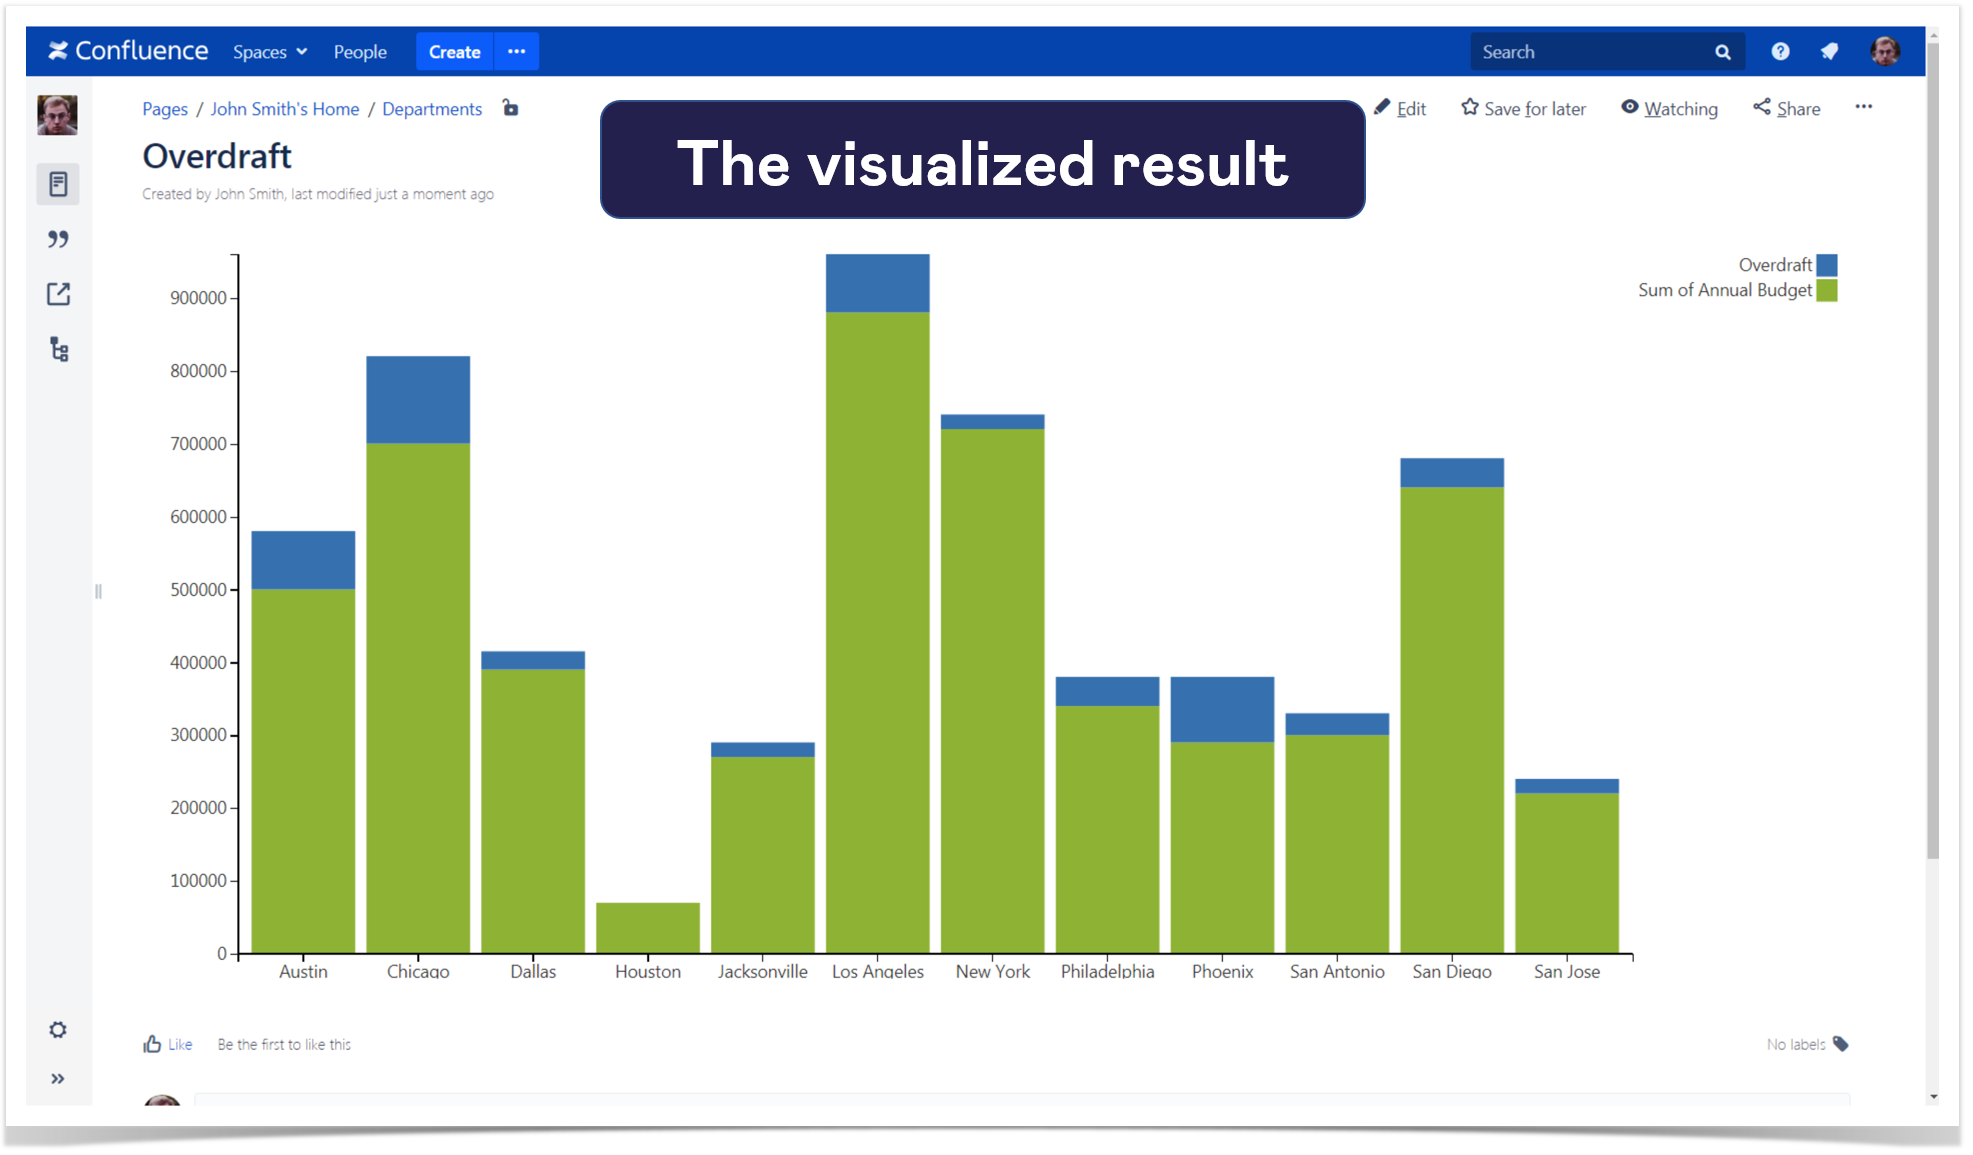
Let’s choose the Stacked Column chart and show annual budgets and overdrafts for the locations you’ve got.
Now the task is fully accomplished, and you are ready to present the results to your colleagues.
Note that this case is just one of many tricky challenges related to Confluence tables and reports, in which the Table Filter, Charts & Spreadsheets for Confluence app will help you.


