How to Manage Requirements in Confluence

More and more companies use Confluence to accumulate data, share ideas, plan projects, track meetings, assign tasks, collect feedback, etc. In this blog post, we’ll talk about one of the most common cases that Confluence allows to accomplish: you’ll learn how to manage requirements effectively.
Use case
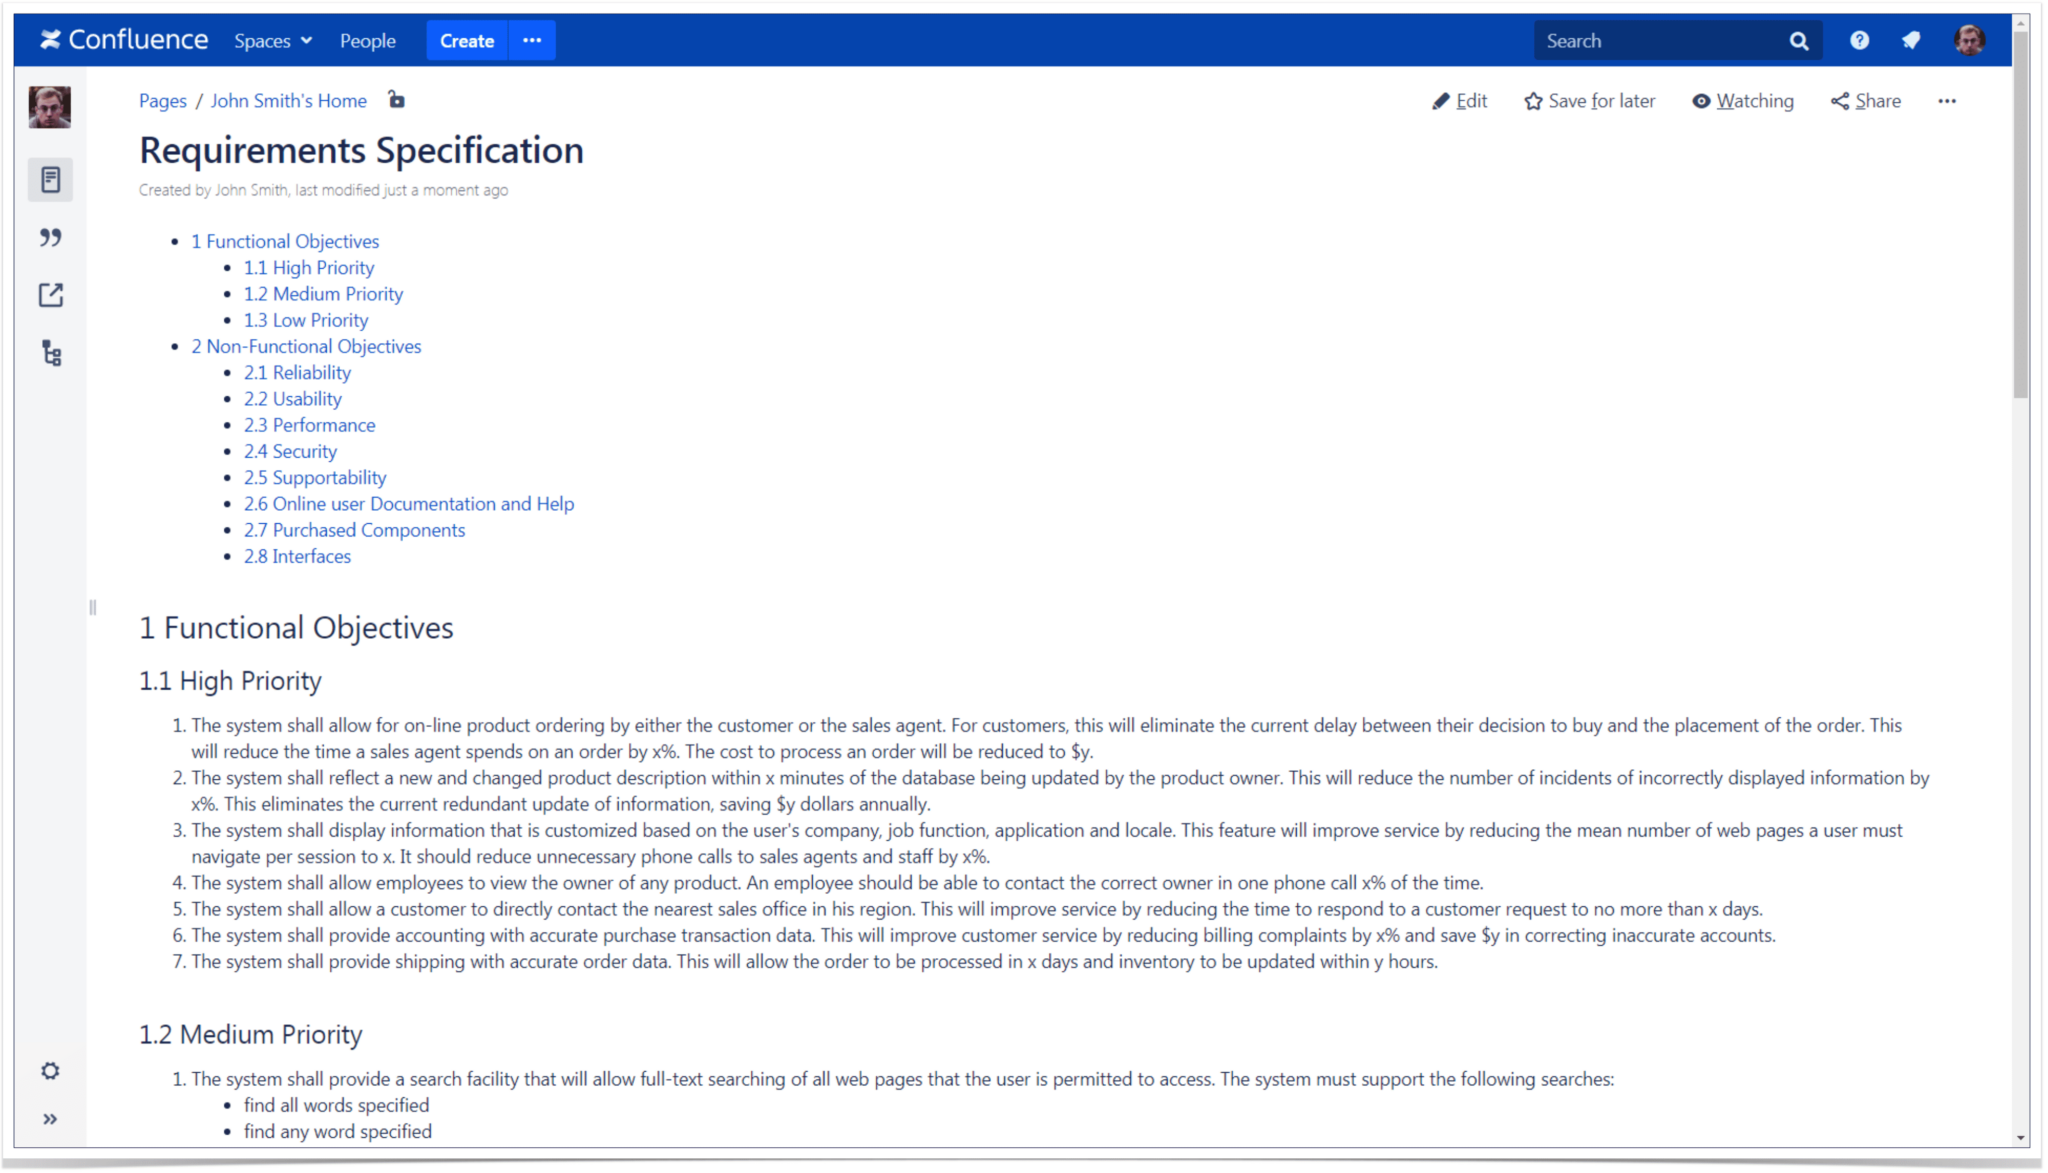
Your company develops multiple software apps for different customers. To keep track of the specifications, you create separate Confluence pages for all the technical details. Your teammates work on their projects, updating the corresponding pages.
To organize the workflow, you ask your colleagues to leave standard comments when making changes to the requirements page.
- Application Review stands for any updates to the functionality of the app.
- Clearance Review goes for the changes related to the application security.
- Office Action is left when your co-workers combine the final document and send it to the customer.
If the changes are minor and insignificant (for example, typos and missed words), there are no comments.
The task is to track how many improvements (including their type) your colleagues have made and how the workflow changes in time. The Table Filter and Charts for Confluence app will help you to cope with this challenge.
Change History macro
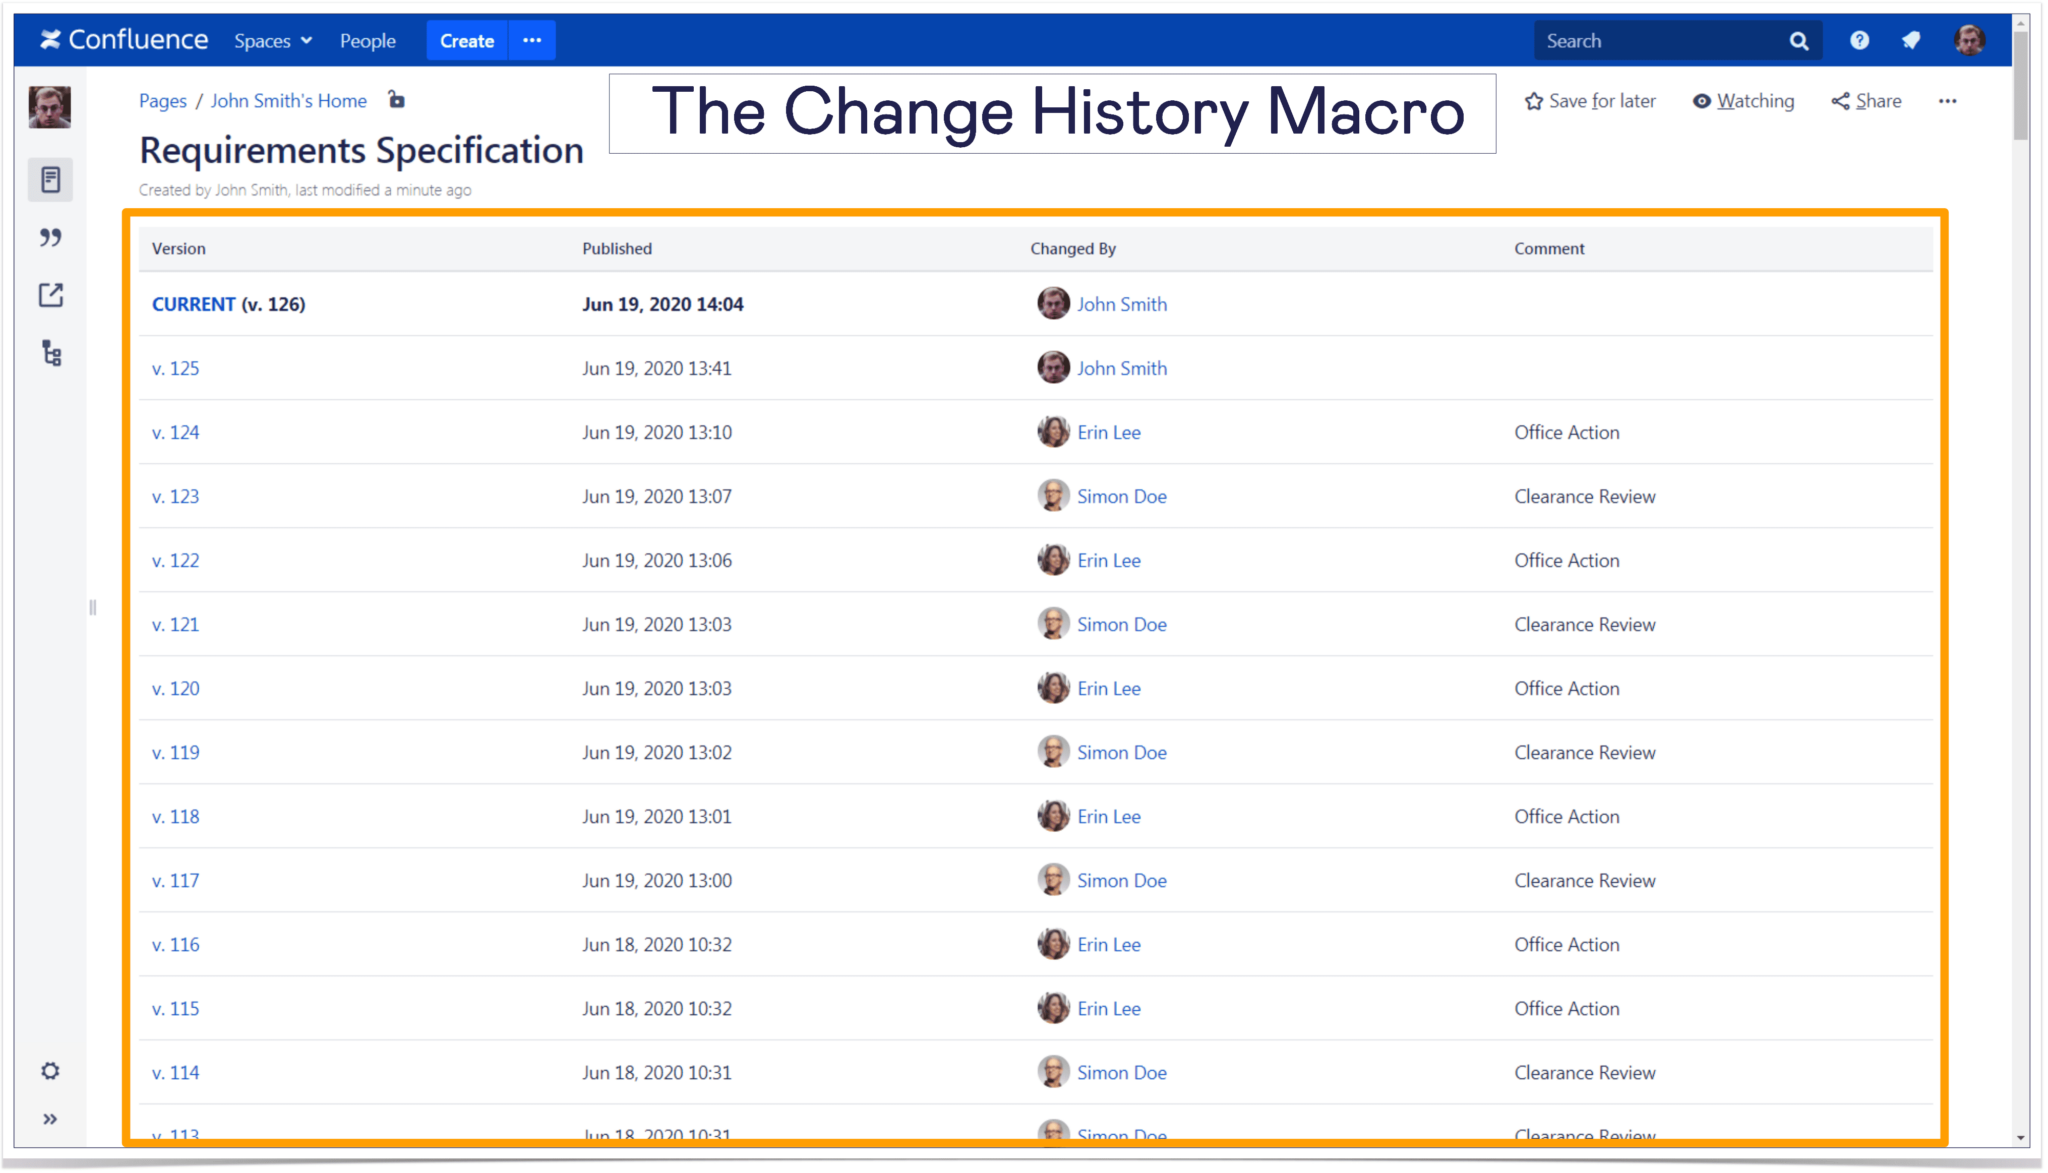
To use the standard mechanism of page versioning in Confluence, insert the Change History macro and get detailed statistics about the requirements specification.
Pro tip:
Learn more about using Spreadsheets in Confluence
Table Filter and Charts for Confluence
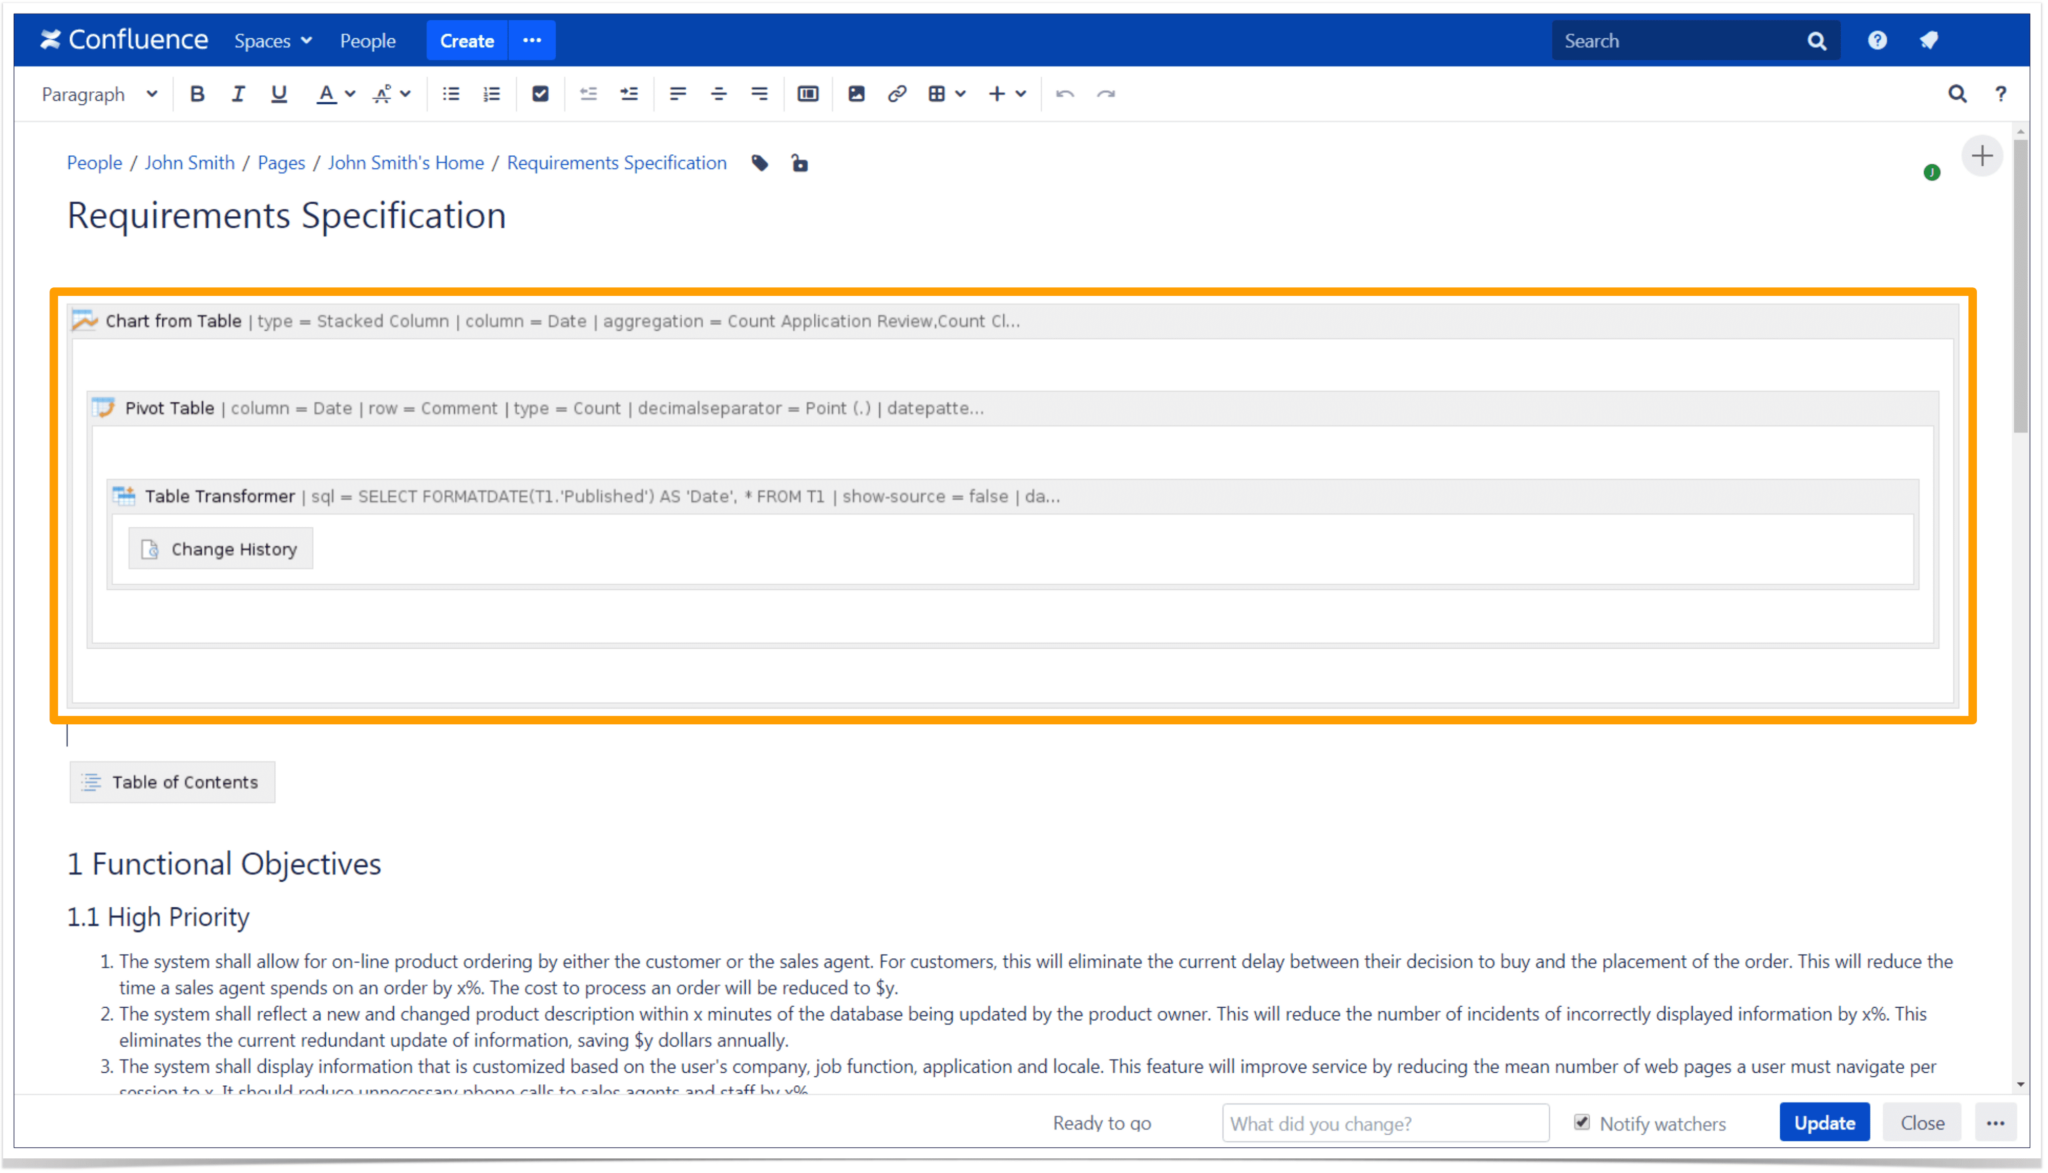
As there are a lot of page versions, the Change History table is rather big and not aggregated. To visualize the data, wrap the macro in the Table Transformer, Pivot Table, and Chart from Table macros in succession.
Now you need to configure the macros to get the required result.
Table Transformer
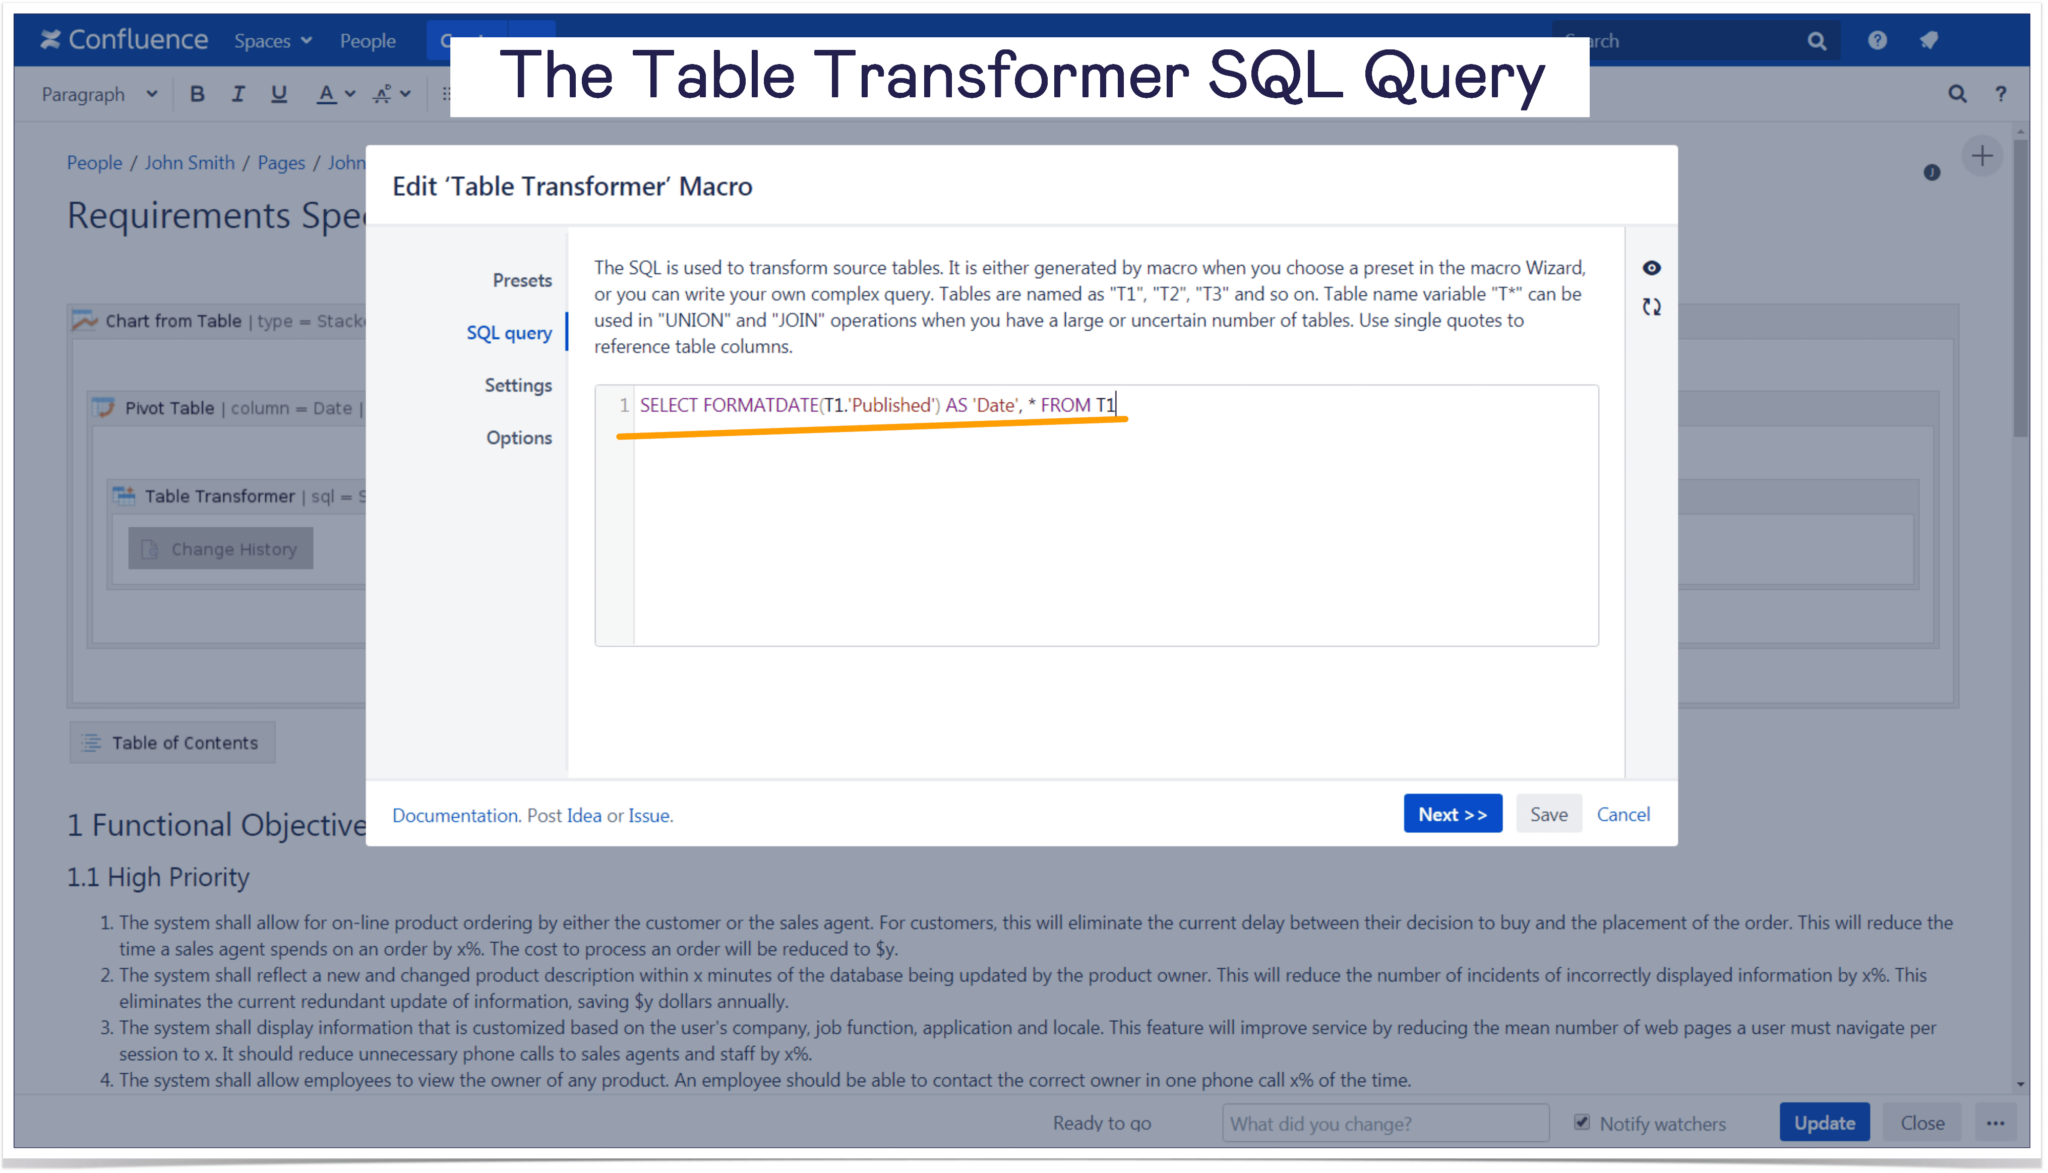
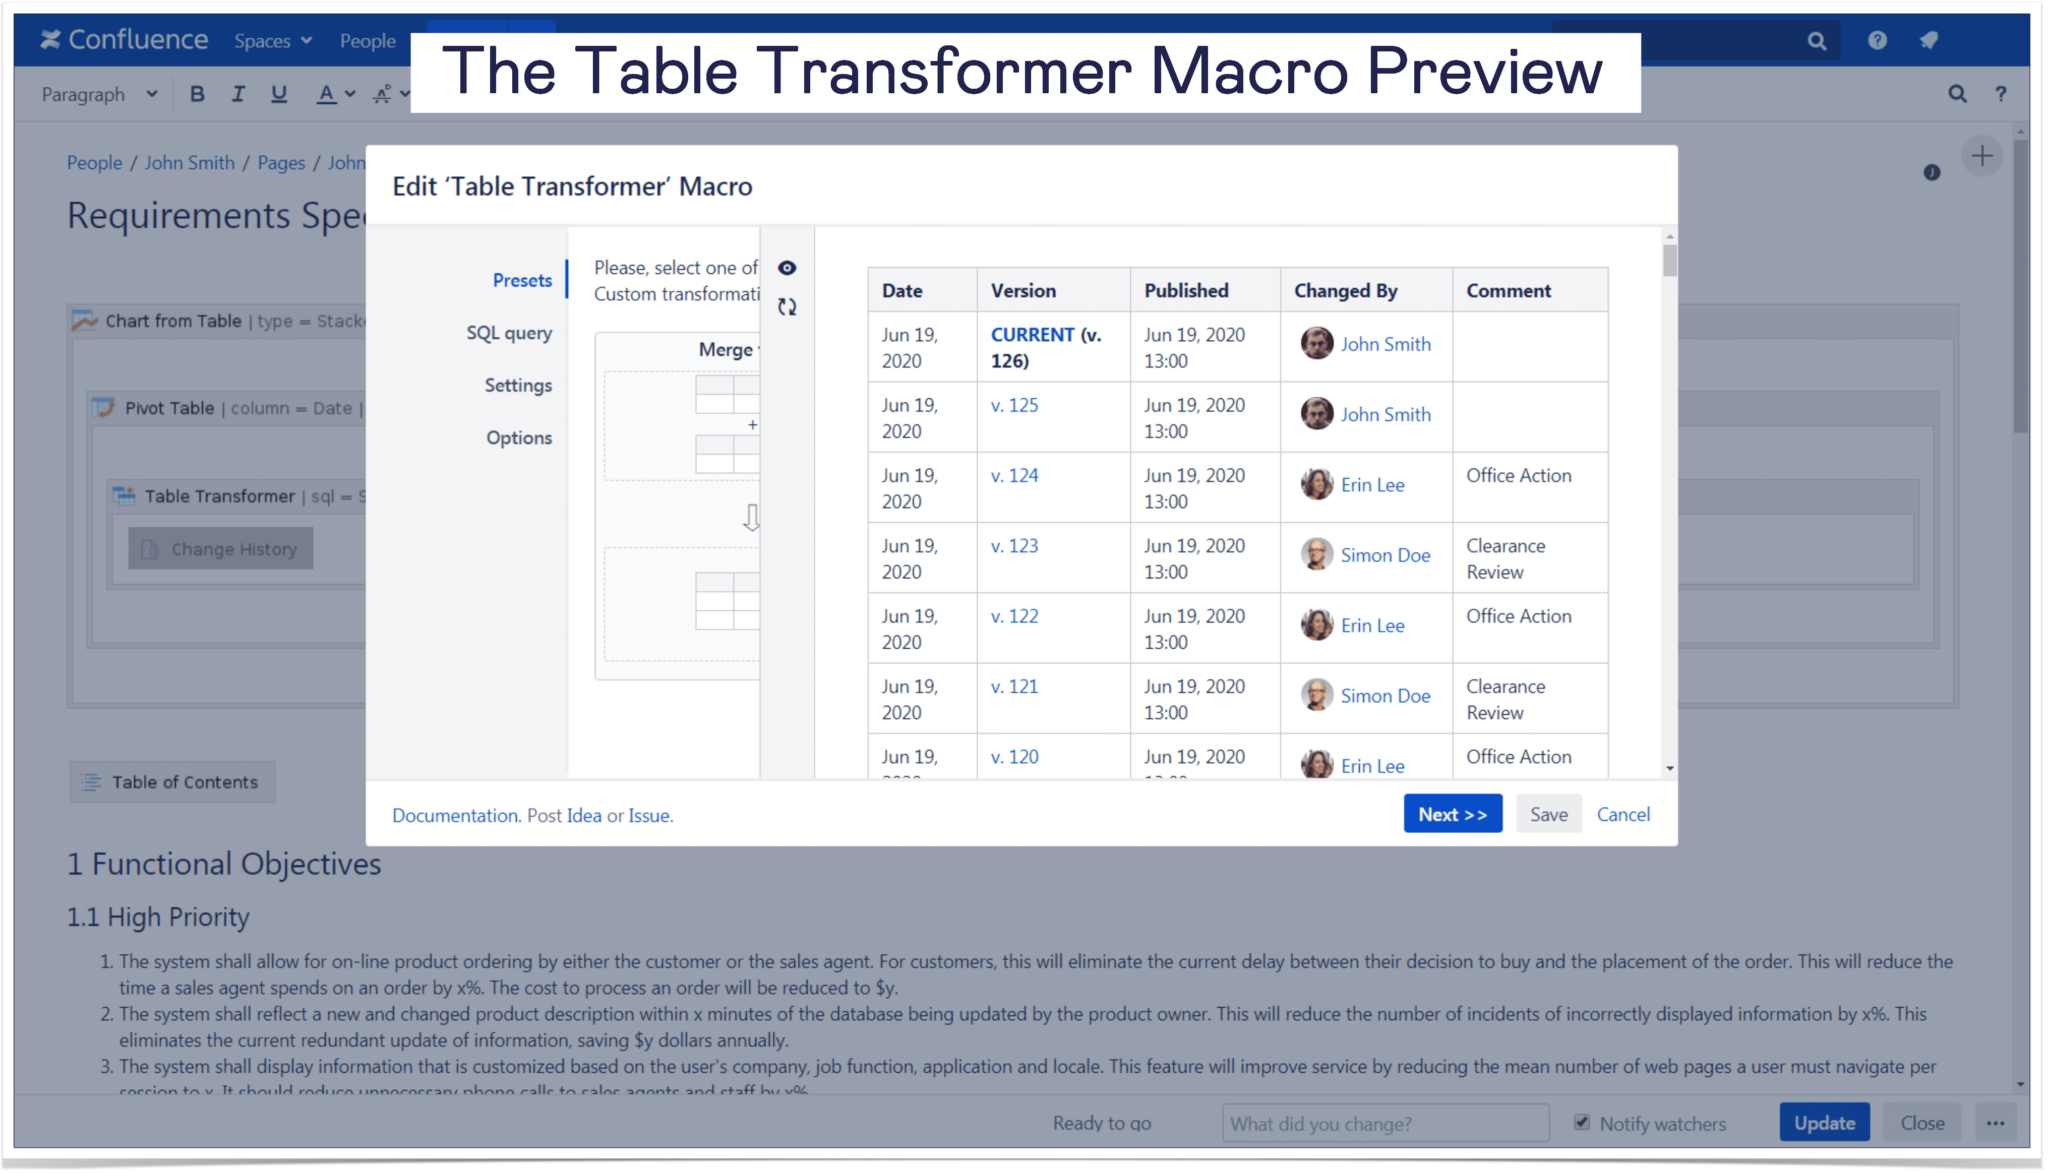
The Table Transformer macro converts the “Mon-DD-YYYY hh:mm” dates to the simple “Mon-DD-YYYY” format. Type in a custom SQL-query “SELECT FORMATDATE(T1.’Published’) AS ‘Date’, * FROM T1” and you’ll be able to group the comments by days later.
You will see the obtained result right in the macro preview.
Pivot Table
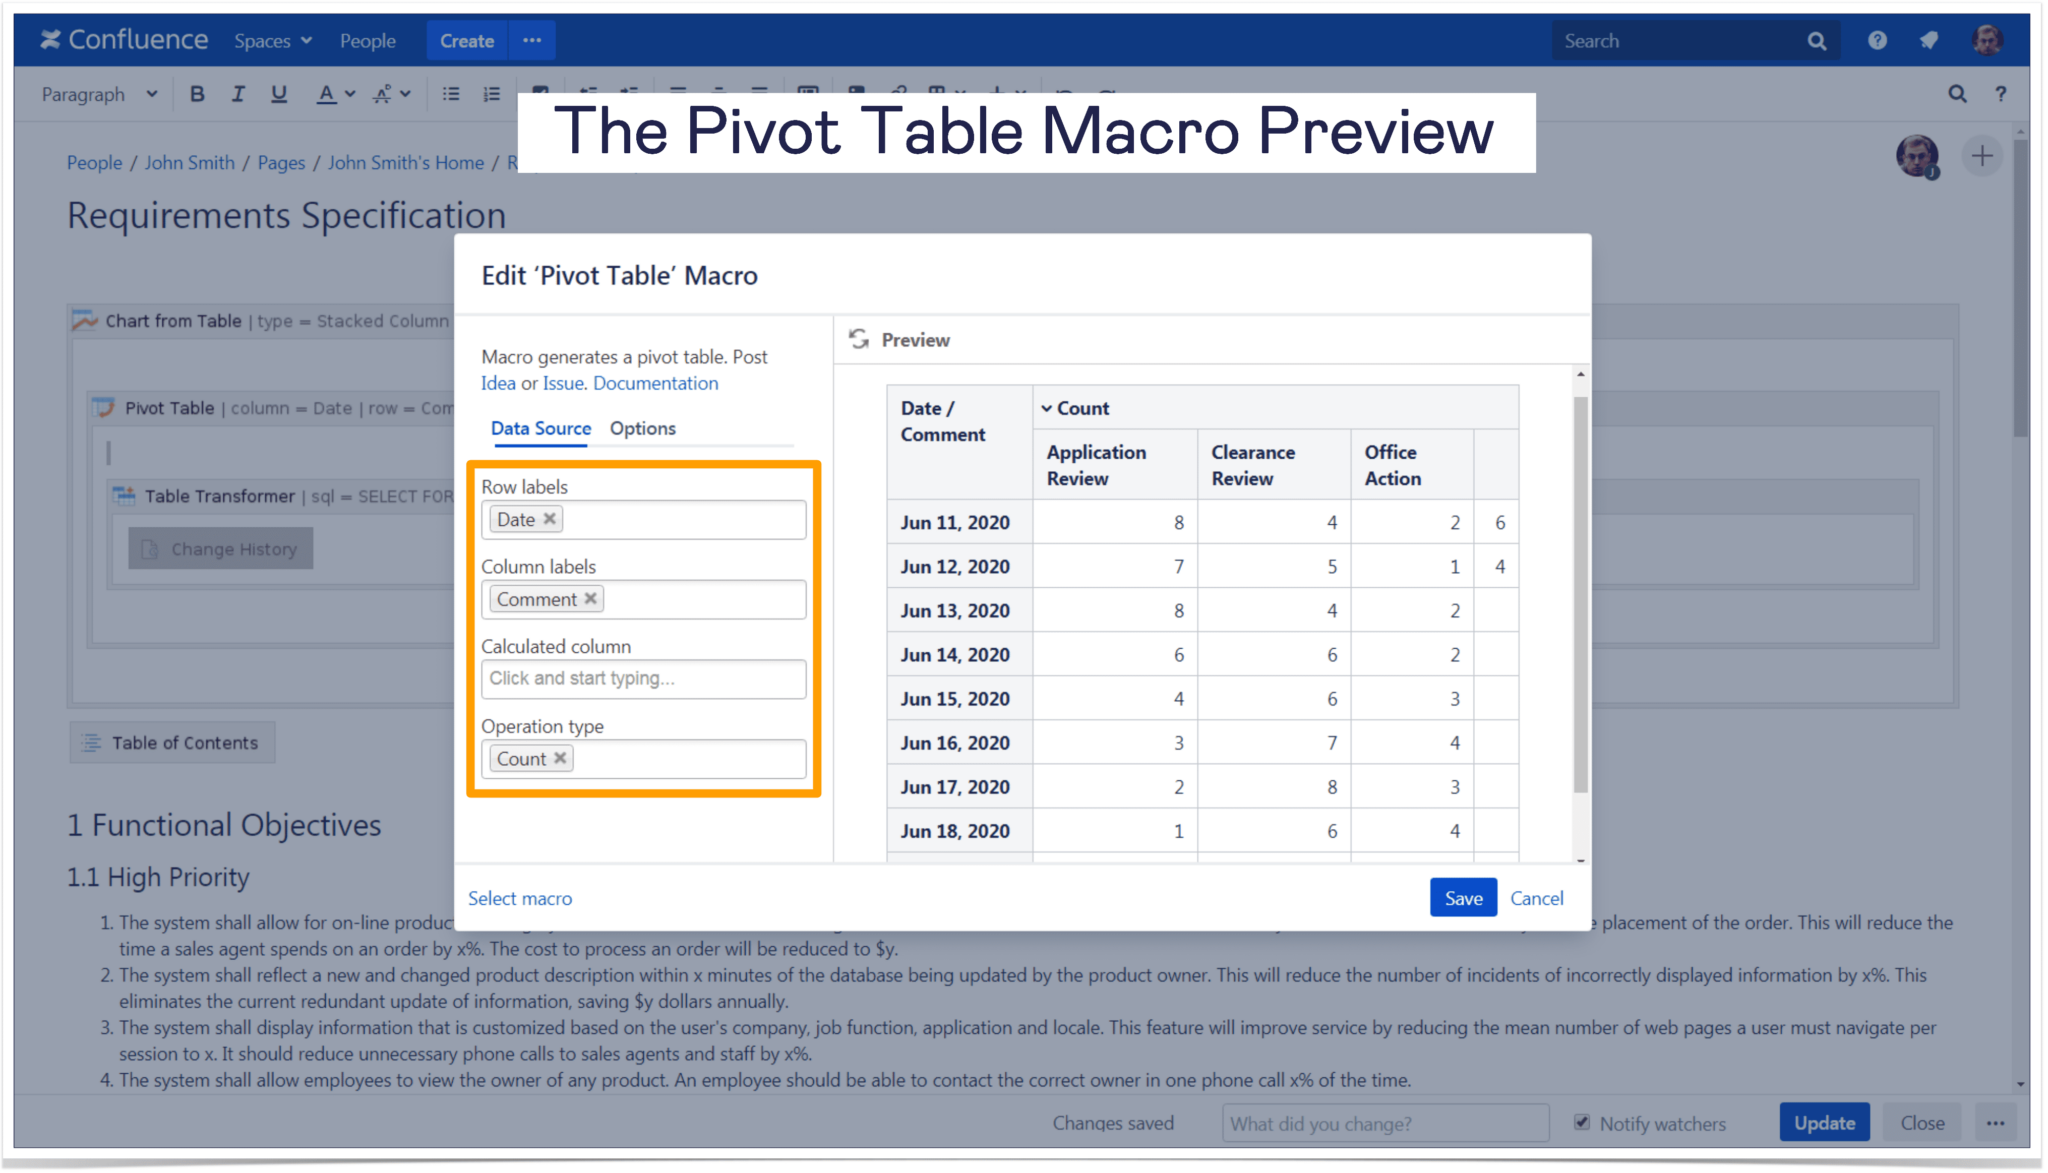
The Pivot Table macro helps you to aggregate the comments by types and days. The settings are very intuitive, besides you can always check the macro preview.
Chart from Table
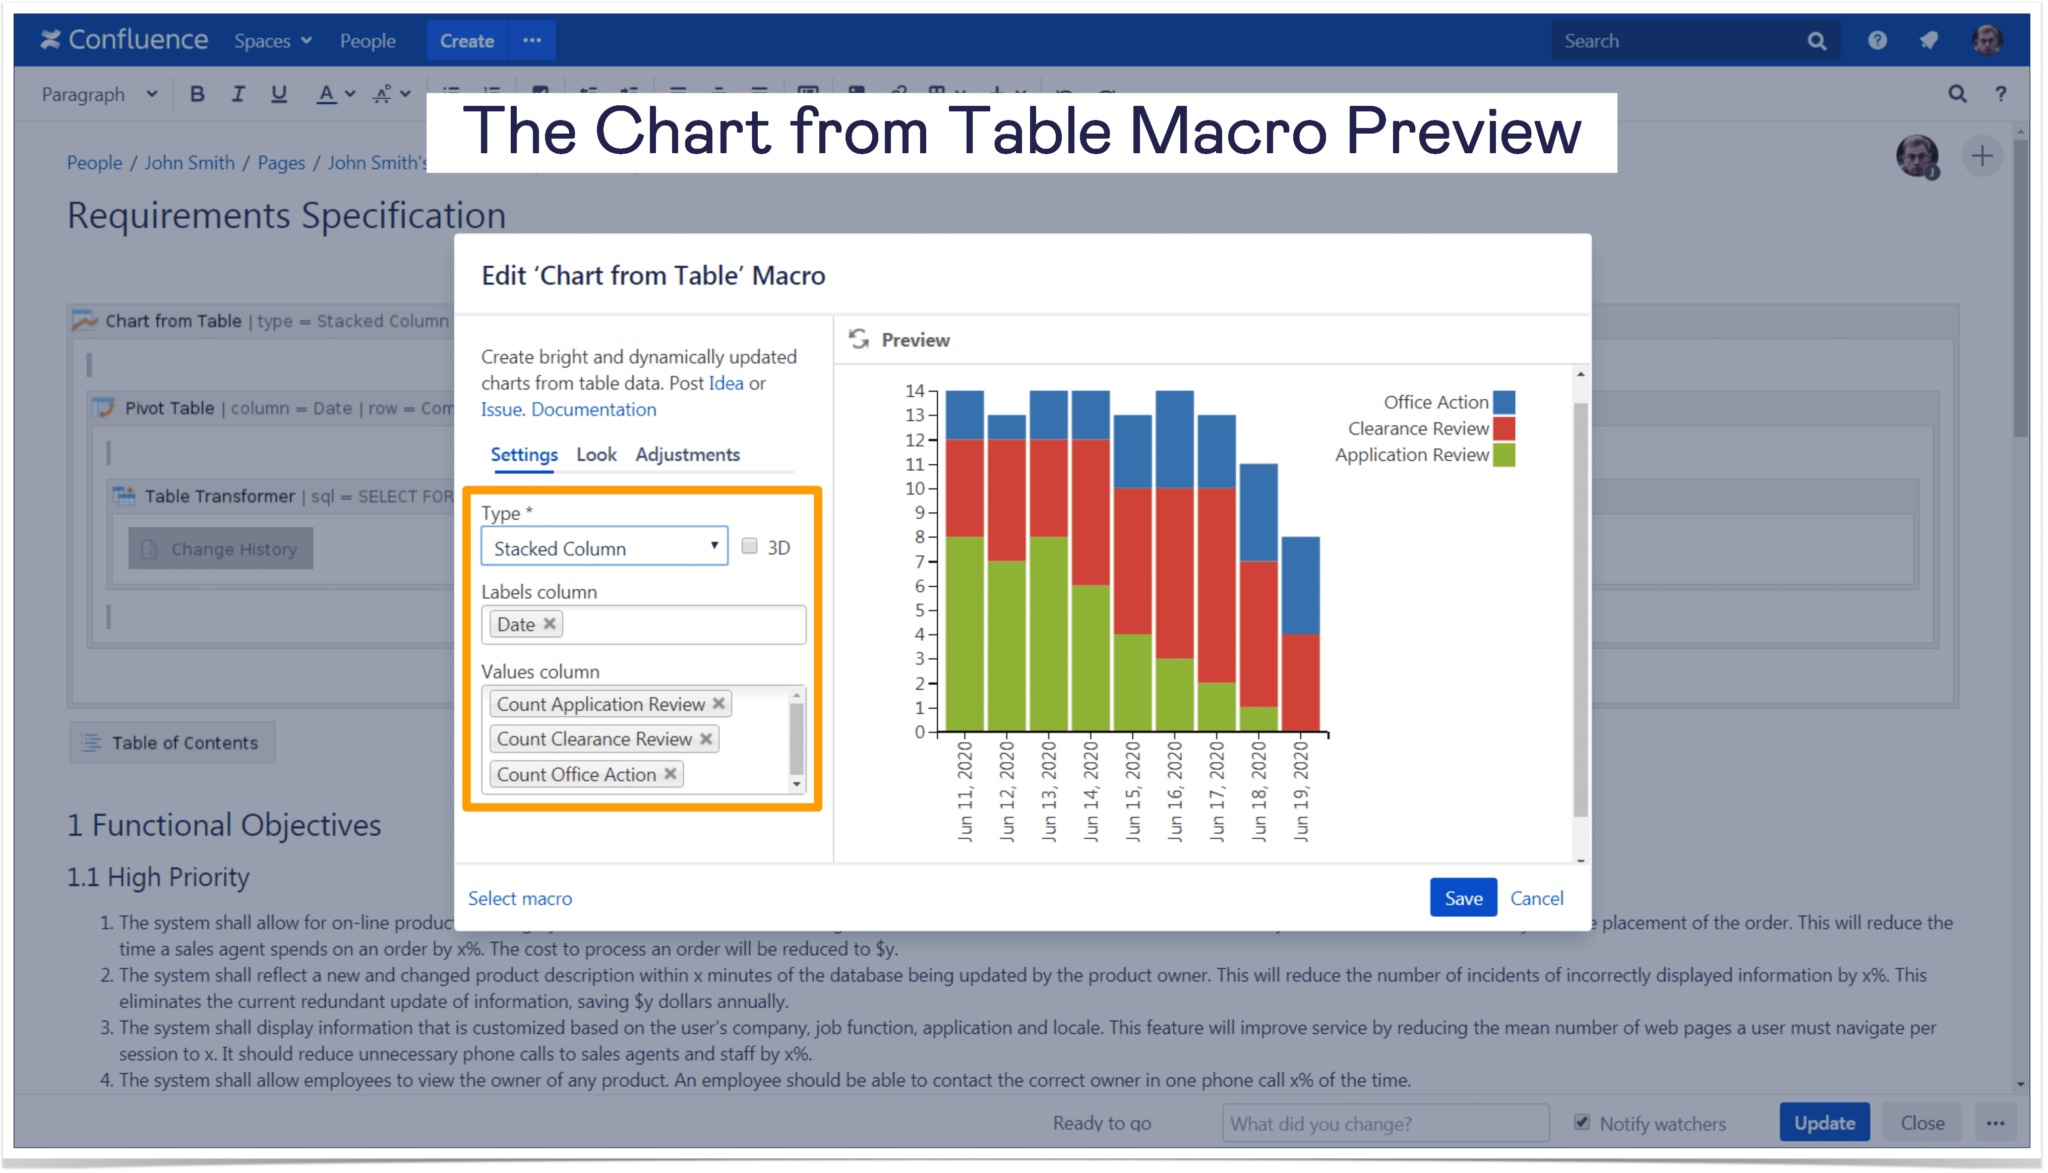
The last step is to visualize the pivot table with the help of the Chart from Table macro. Let’s choose the Stacked Column chart type as it’s shown on the screenshot below.
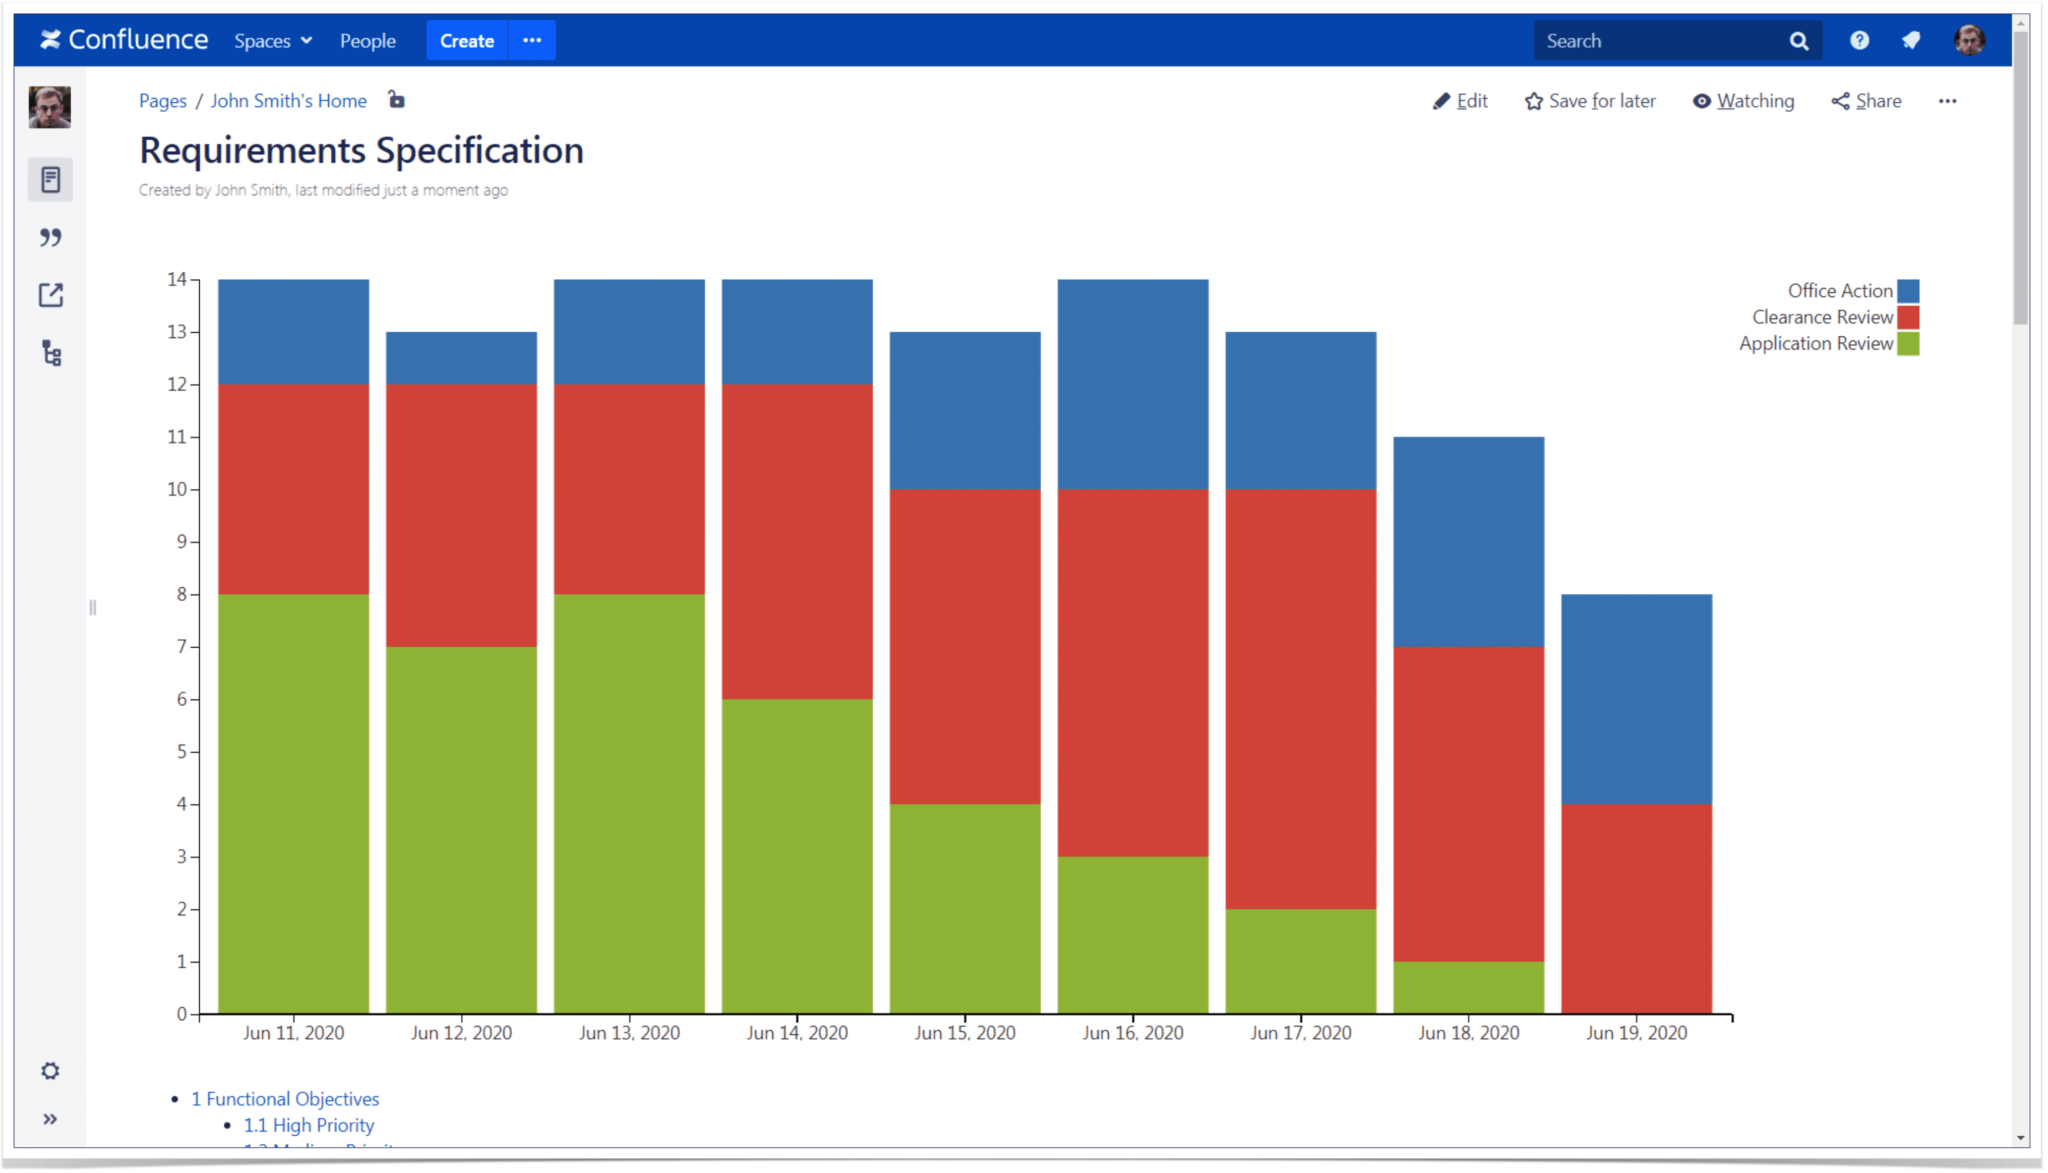
You get an easy-to-read chart where you can check the number and types of your colleagues’ changes.
The visualization helps you to catch the workflow trend. For example, at the beginning of the project, your teammates mostly worked on the application functionality. Five days later, the number of the Application Reviews decreased, and your co-workers focused on the security issues. The Office Action items reside in every column, so you can be sure that the customer gets all the required documentation on time.
Confluence Cloud
This blog post highlights the requirements management use case for Server and Data Center instances. You can implement the same task for the Cloud version of Confluence as well. The Table Filter and Charts for Confluence app is compatible with all the hosting types.
The steps for Confluence Cloud will be the same, and the only difference is that you’ll need to use the Table Toolbox macro for nesting multiple macros.


