How to See User Activity in Bitbucket Data Center

Tracking user activity is essential for maintaining transparency, accountability, and efficient teamwork. However, since Bitbucket does not provide an opportunity to see a particular user’s contributions, additional tools are needed. One of them is Awesome Graphs for Bitbucket. Let’s dive into all the options it provides for tracking user activity.
Awesome Graphs for Bitbucket is an app that helps engineering teams leverage user activity analytics in Bitbucket. It offers ready-to-use reports on team and individual levels and provides REST API endpoints for data export and customization.
See user activity in Bitbucket over the past year
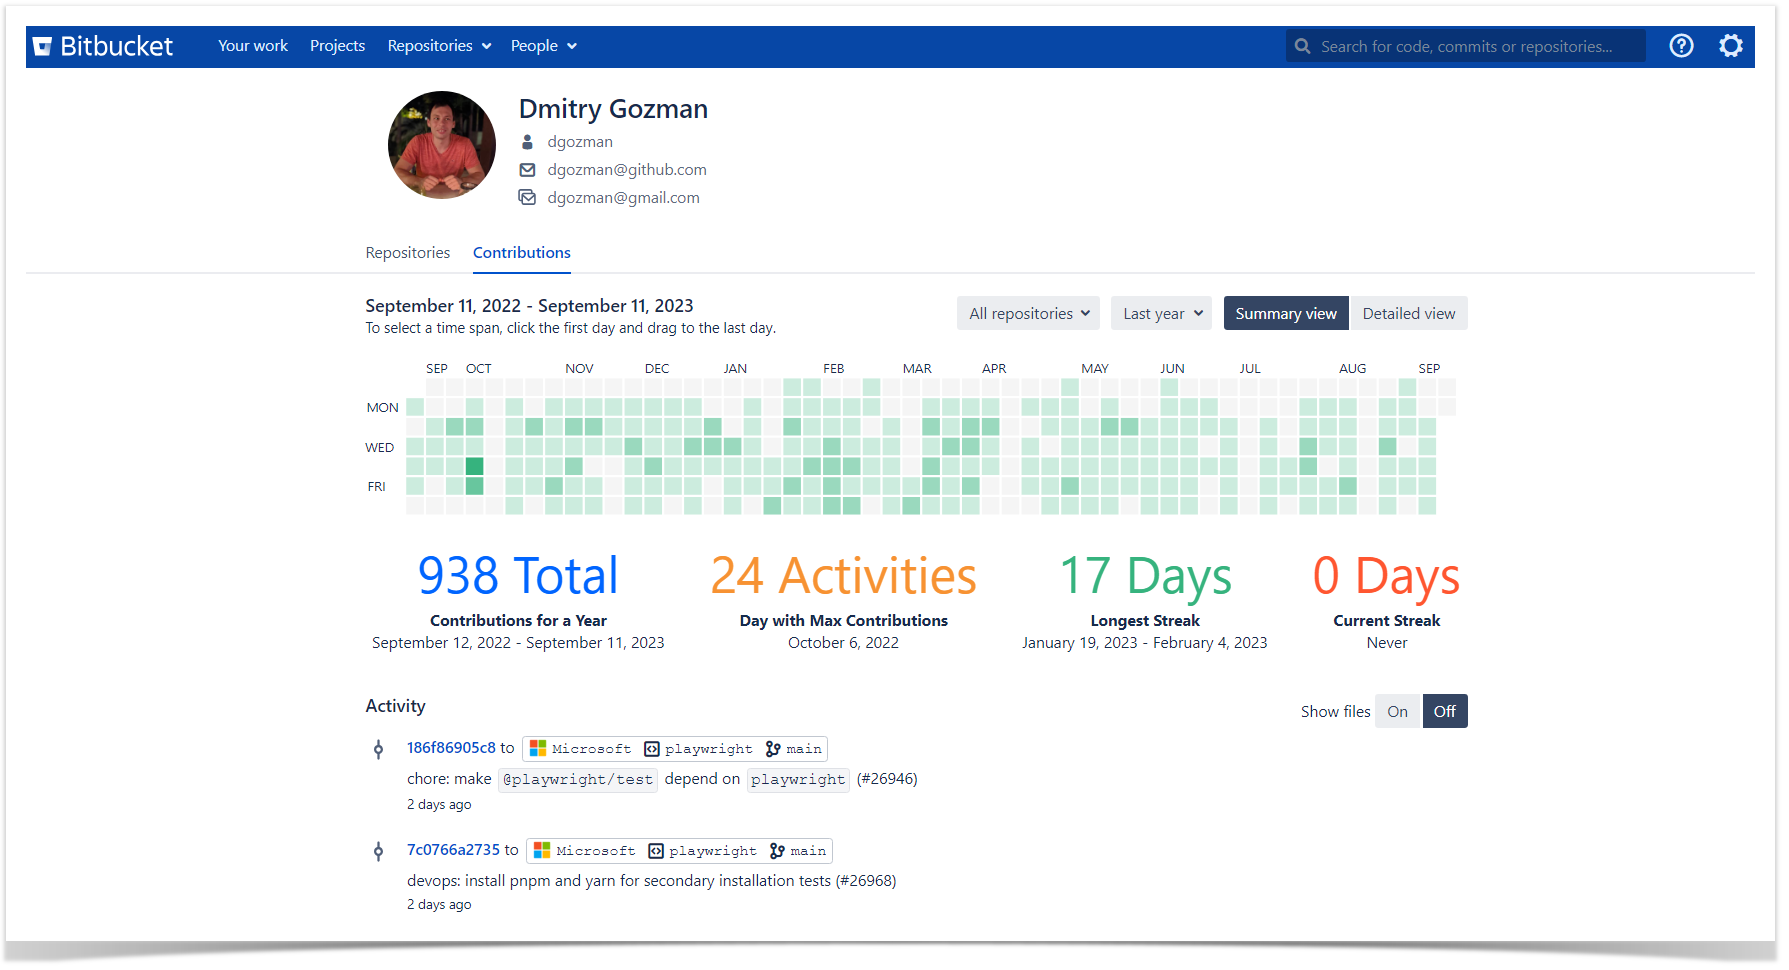
The Contribution graph displays the activity of a particular Bitbucket user over the past year. Each square represents the number of commits and pull requests a developer made on a particular day. Below the graph, some key insights are displayed as well as a list of all user’s commits and pull requests with their details.
Switching to the detailed view allows you to check how the developer distributed efforts between different projects and repositories and see a list of their activities on a specific one.
This graph will give you a comprehensive overview of Bitbucket user activity over the past year, along with daily statistics. It highlights not only the key trends but also provides detailed information, helping analyze how a developer allocates their efforts, find patterns in their work, and see their contributions to project development.
Track recent Bitbucket user activity
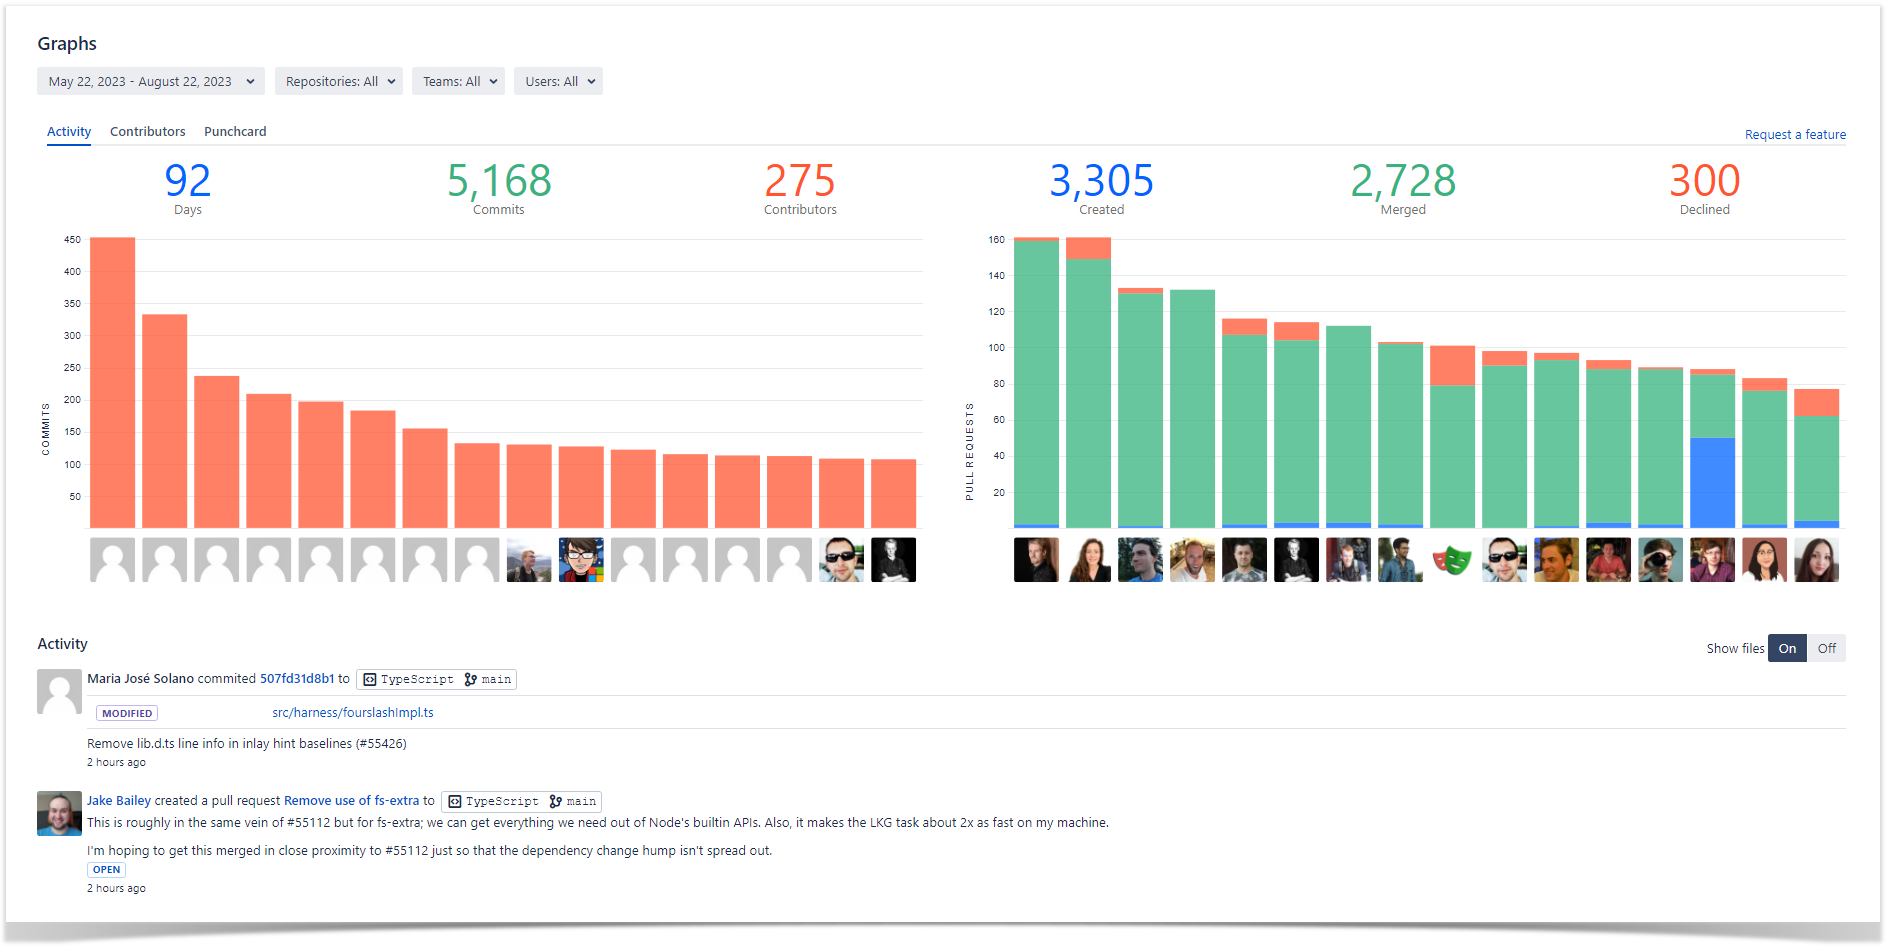
The Activity graph allows you to see recent user contributions to a particular project or repository. By default, it displays commits and pull requests charts with the number of activities made by top contributors. However, you can choose a particular user and see their activities on the project over the selected period. Below the graph, a list of all commits and pull requests with links to Jira issues, hashes, and Change Type lozenges are shown depending on the filters applied.
Here, you can easily track recent users’ activity on a particular project or repository, enhancing transparency and collaboration within your teams.
Export data using REST API
To build custom reports and meet particular requirements, Awesome Graphs for Bitbucket provides an opportunity to export user‘s commit, lines of code, or pull request data via REST API. It lets you get general statistics, retrieve all the details, and export data to a CSV file. Here is an example of the curl command to get a list of commits of a particular user, including commits made by the user’s aliases:
curl -X GET -u username:password "https://bitbucket.your-company-name.com/rest/awesome-graphs-api/latest/users/{userSlug}/commits"
This is what the response will look like:
{
  "values": [
    {
      "user": {
        "emailAddress": "yorlov@stiltsoft.com",
        "displayName": "Administrator",
        "name": "admin"
      },
      "author": {
        "displayName": "admin",
        "emailAddress": "yorlov@stiltsoft.com"
      },
      "authorTimestamp": "2023-03-05T22:58:18Z",
      "linesOfCode": {
        "added": 1,
        "deleted": 0
      },
      "parents": [],
      "repository": {
        "slug": "Commit Hook",
        "name": "commit-hook",
        "project": {
          "key": "TESTCONTAINERS",
          "name": "Testcontainers",
          "type": "NORMAL"
        }
      },
      "id": "9f2e24a147bb8f5a5a3d10b692703cc5784df8b5"
    },
    {
      "author": {
        "displayName": "avoronova",
        "emailAddress": "avoronova@stiltsoft.com"
      },
      "authorTimestamp": "2023-03-05T22:58:18Z",
      "linesOfCode": {
        "added": 2,
        "deleted": 2
      },
      "parents": [
        {
          "id": "06572e813597bc7d77c8"
        }
      ],
      "repository": {
        "slug": "Awesome Graphs for Bitbucket Server",
        "name": "awesome-graphs-for-bitbucket-server",
        "project": {
          "key": "AWEGRAPHS",
          "name": "Awesome Graphs",
          "type": "NORMAL"
        }
      },
      "id": "295760238d83b84647ae4c10ce16f13fa4d24672"
    }
  ],
  "isLastPage": false,
  "nextPageStart": 2,
  "start": 0,
  "size": 2,
  "limit": 2
}
You can find more information about the Export feature in our documentation. Awesome Graphs’ users can access the in-app documentation through the Export menu in the top-right corner of the People page.
Apart from this, Awesome Graphs allows you to see the following data on a user level:
- dynamics of commit or pull request activity
- total number of commits or pull requests made or total number of lines of code added and deleted over a particular period
- activity in the code review process
Thus, seamlessly integrating with Bitbucket, Awesome Graphs provides three easy ways to see user activity in Bitbucket and get a comprehensive view of their contributions, enabling an understanding of personal and team efforts, making informed decisions, and enhancing overall project success.


