How to Work With Tables in Confluence Cloud

If you need to structure information and present it in a way that makes sense, you will probably start with a table. With the help of tables, you can perfectly organize any kind of data, be it a finance report or your wedding guest list. Today, when you need to get more from tables, you can use spreadsheets taking advantage of Microsoft Excel or Google Sheets.
If your company uses Confluence, you can create tables in Confluence to manage information about employees and customers, track your plans, KPIs, and software requirements, or get an overview of your meeting notes, tasks, to-do lists, hypotheses, and more.
However, when you get started with Confluence Cloud, dealing with tables can be a bit challenging. No worries, we will show you how to make any Confluence table you create stand out.
What to start with
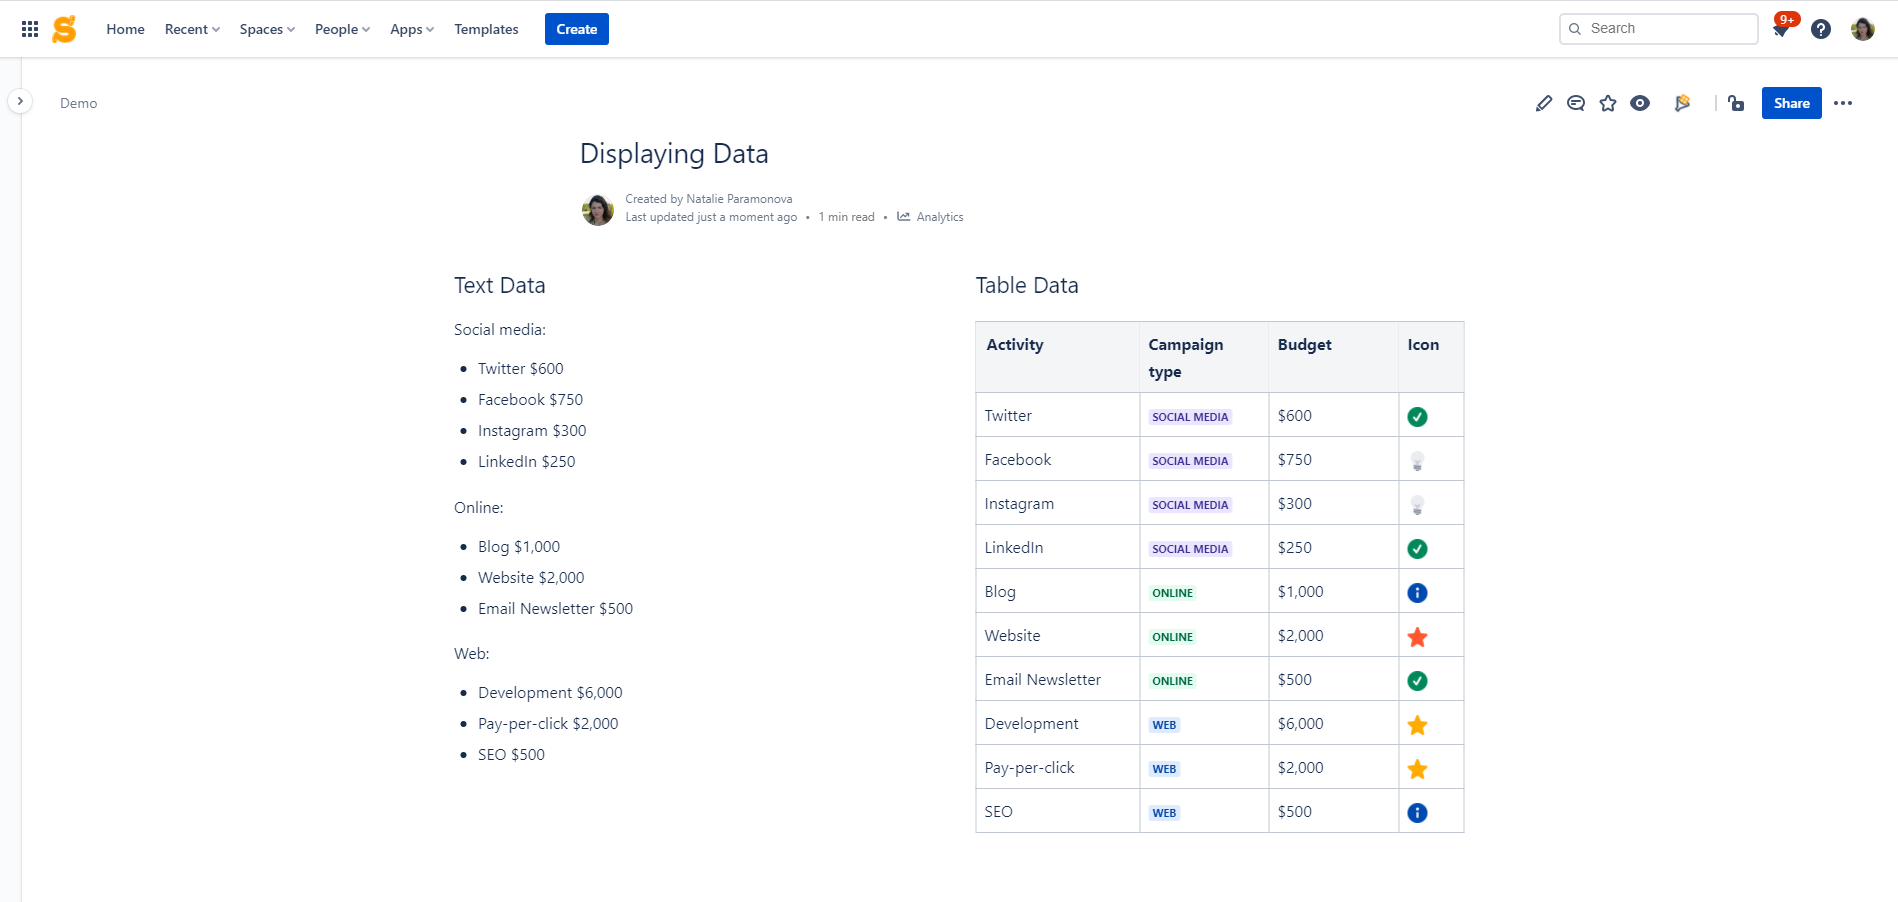
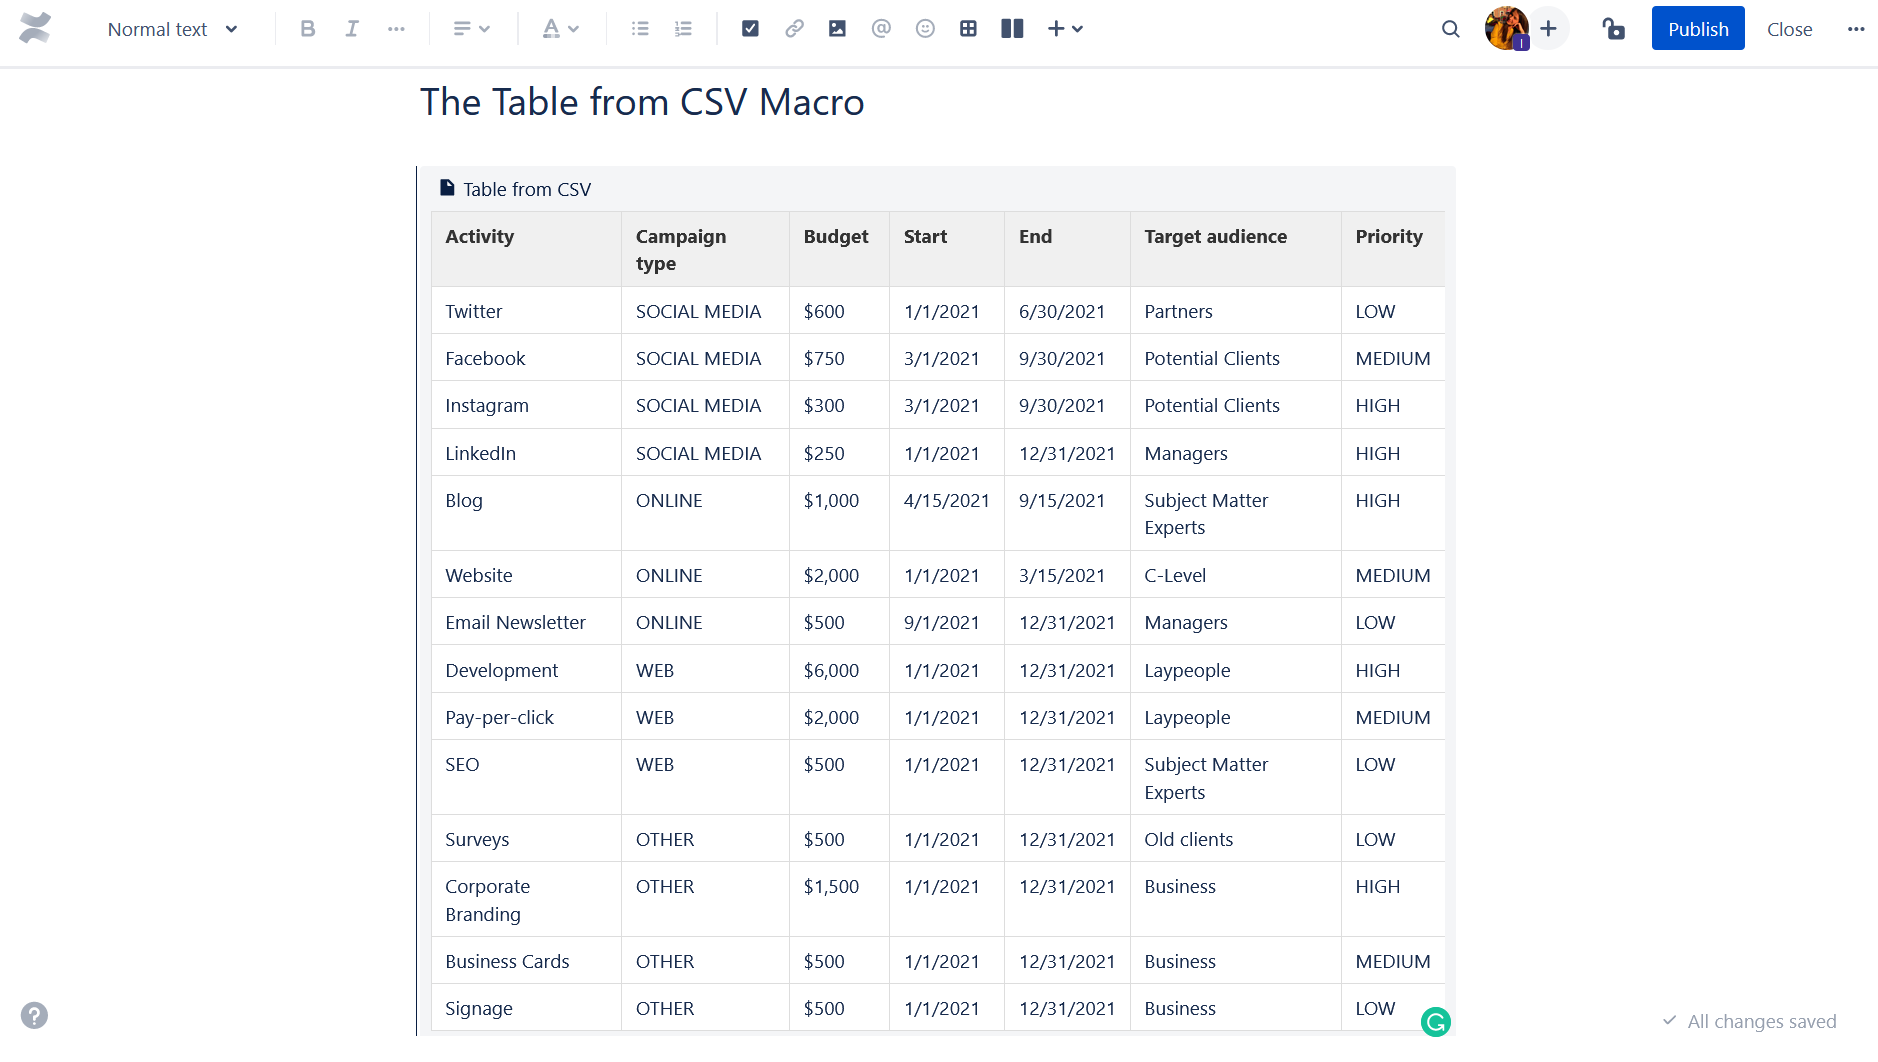
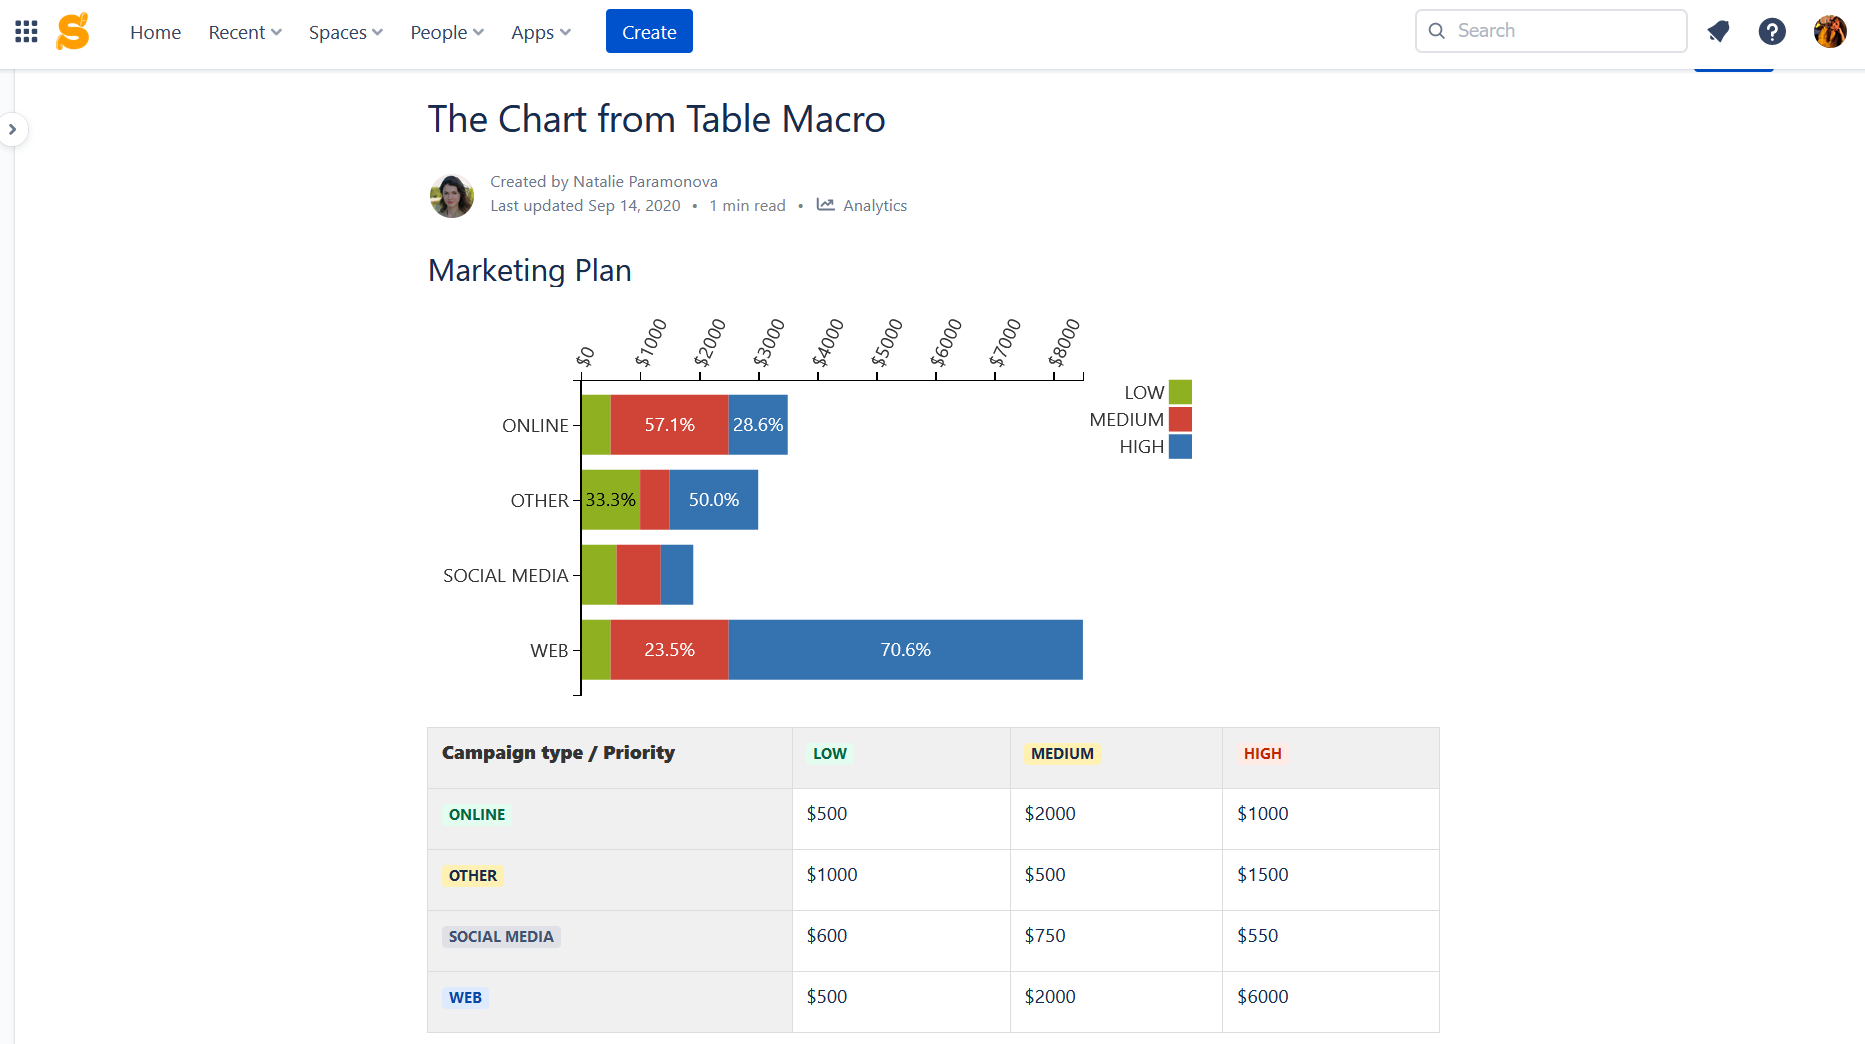
If you are in any doubts about whether tables can boost your productivity at work, let’s start with a simple example of displaying the same data in different ways. As you can see, the table allows you to categorize and interpret your business data in the blink of an eye.
In this post, we will address the FAQs about tables in Confluence Cloud and will show you how to get the most out of tables.
How to copy a table in Confluence Cloud
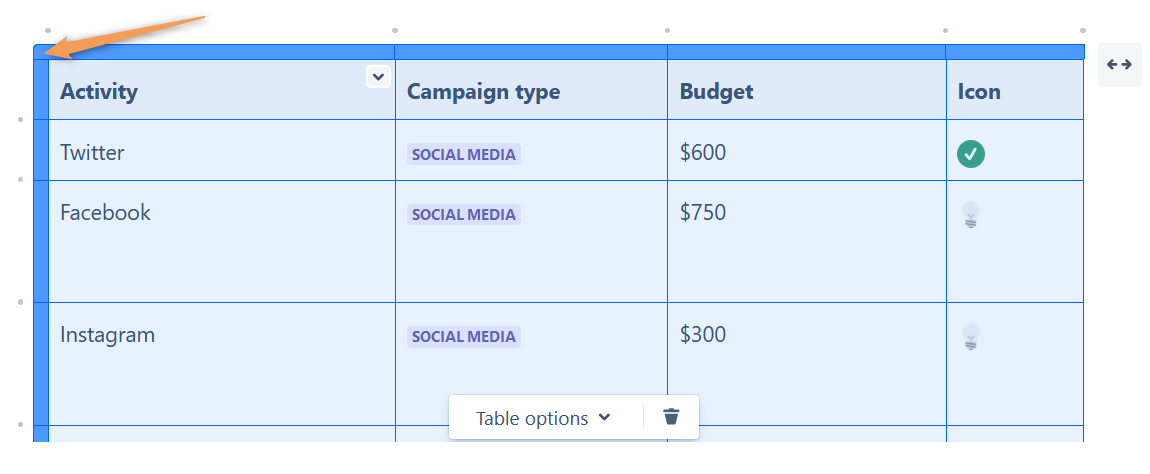
If you are using the new editor, make sure to click the upper left corner of the table first. Then you can press Сtrl+C in order to copy your table and Сtrl+V to insert it wherever you feel it belongs.
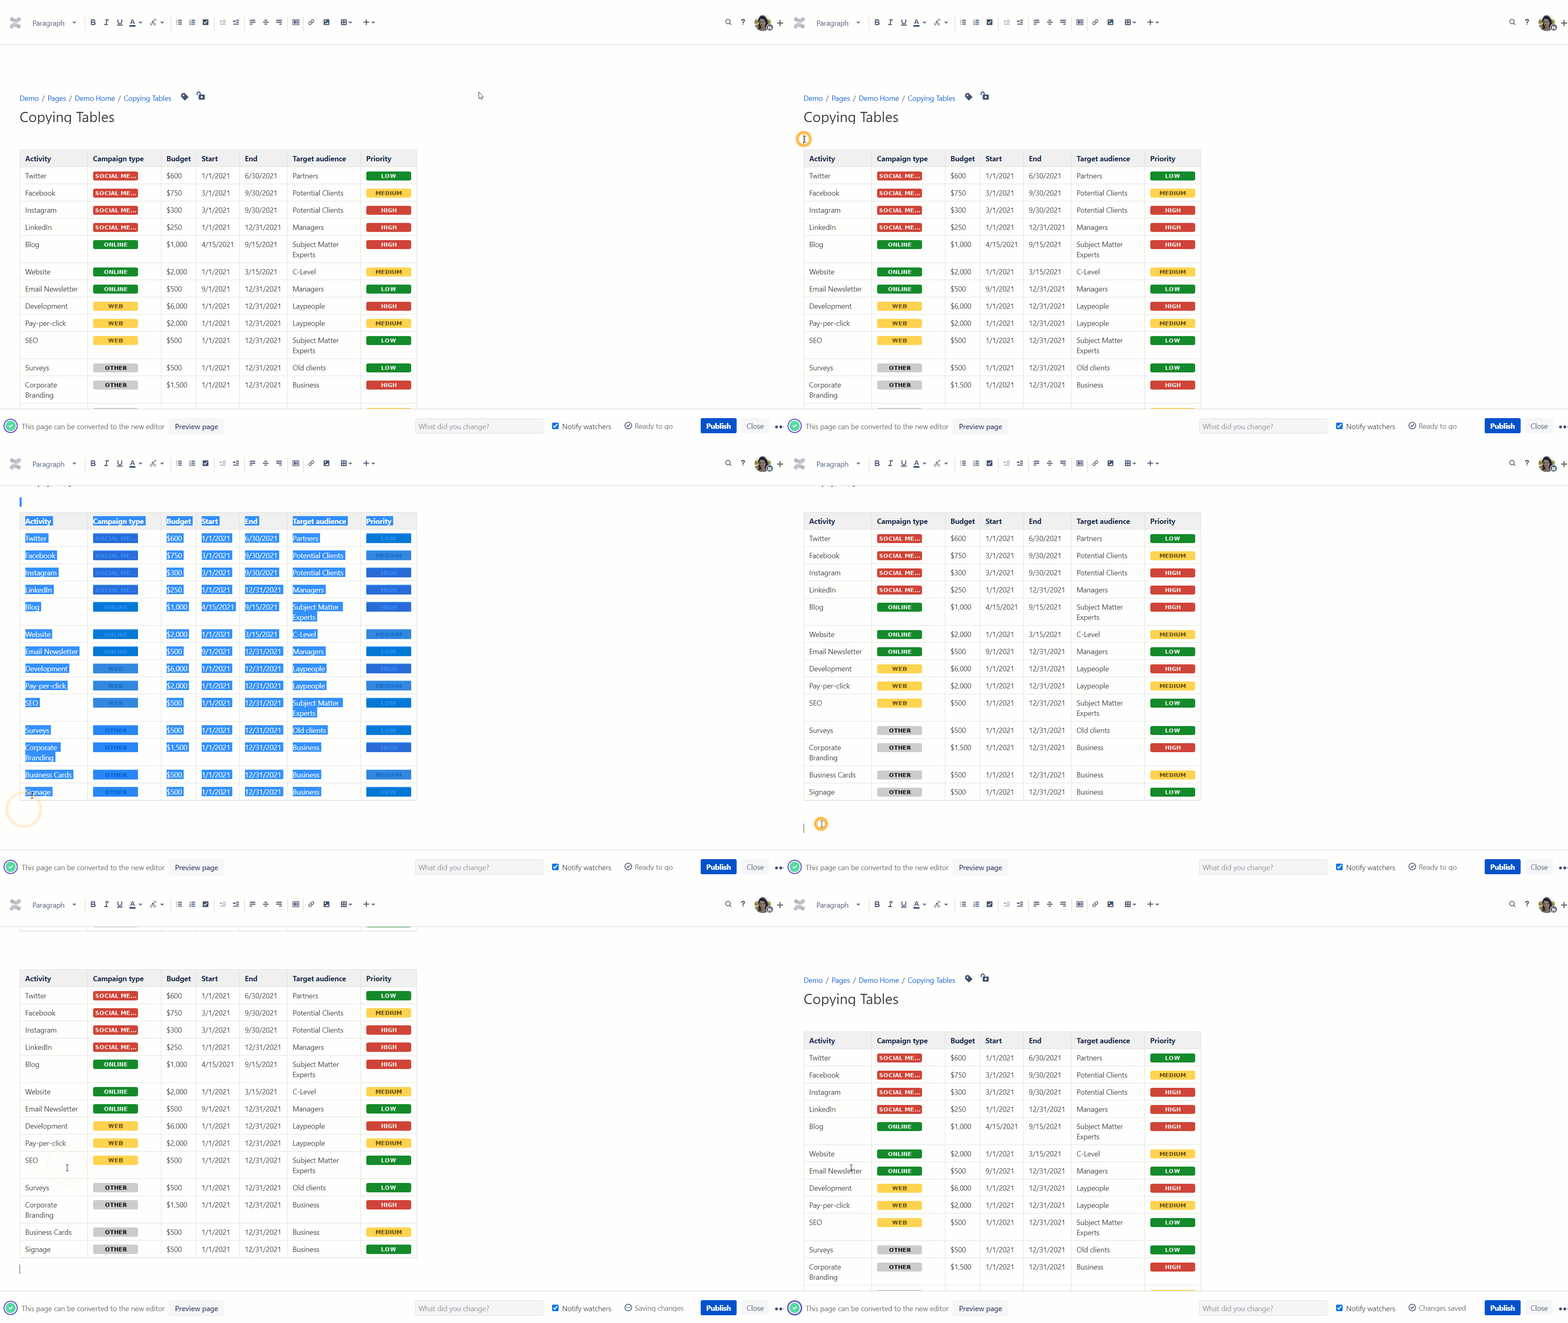
If you are using the old editor (or need to copy some information from the old editor to the new one), your need to put the mouse pointer over the table, hold down the Shift key, then put the mouse pointer under the table and after that press Copy and Paste.
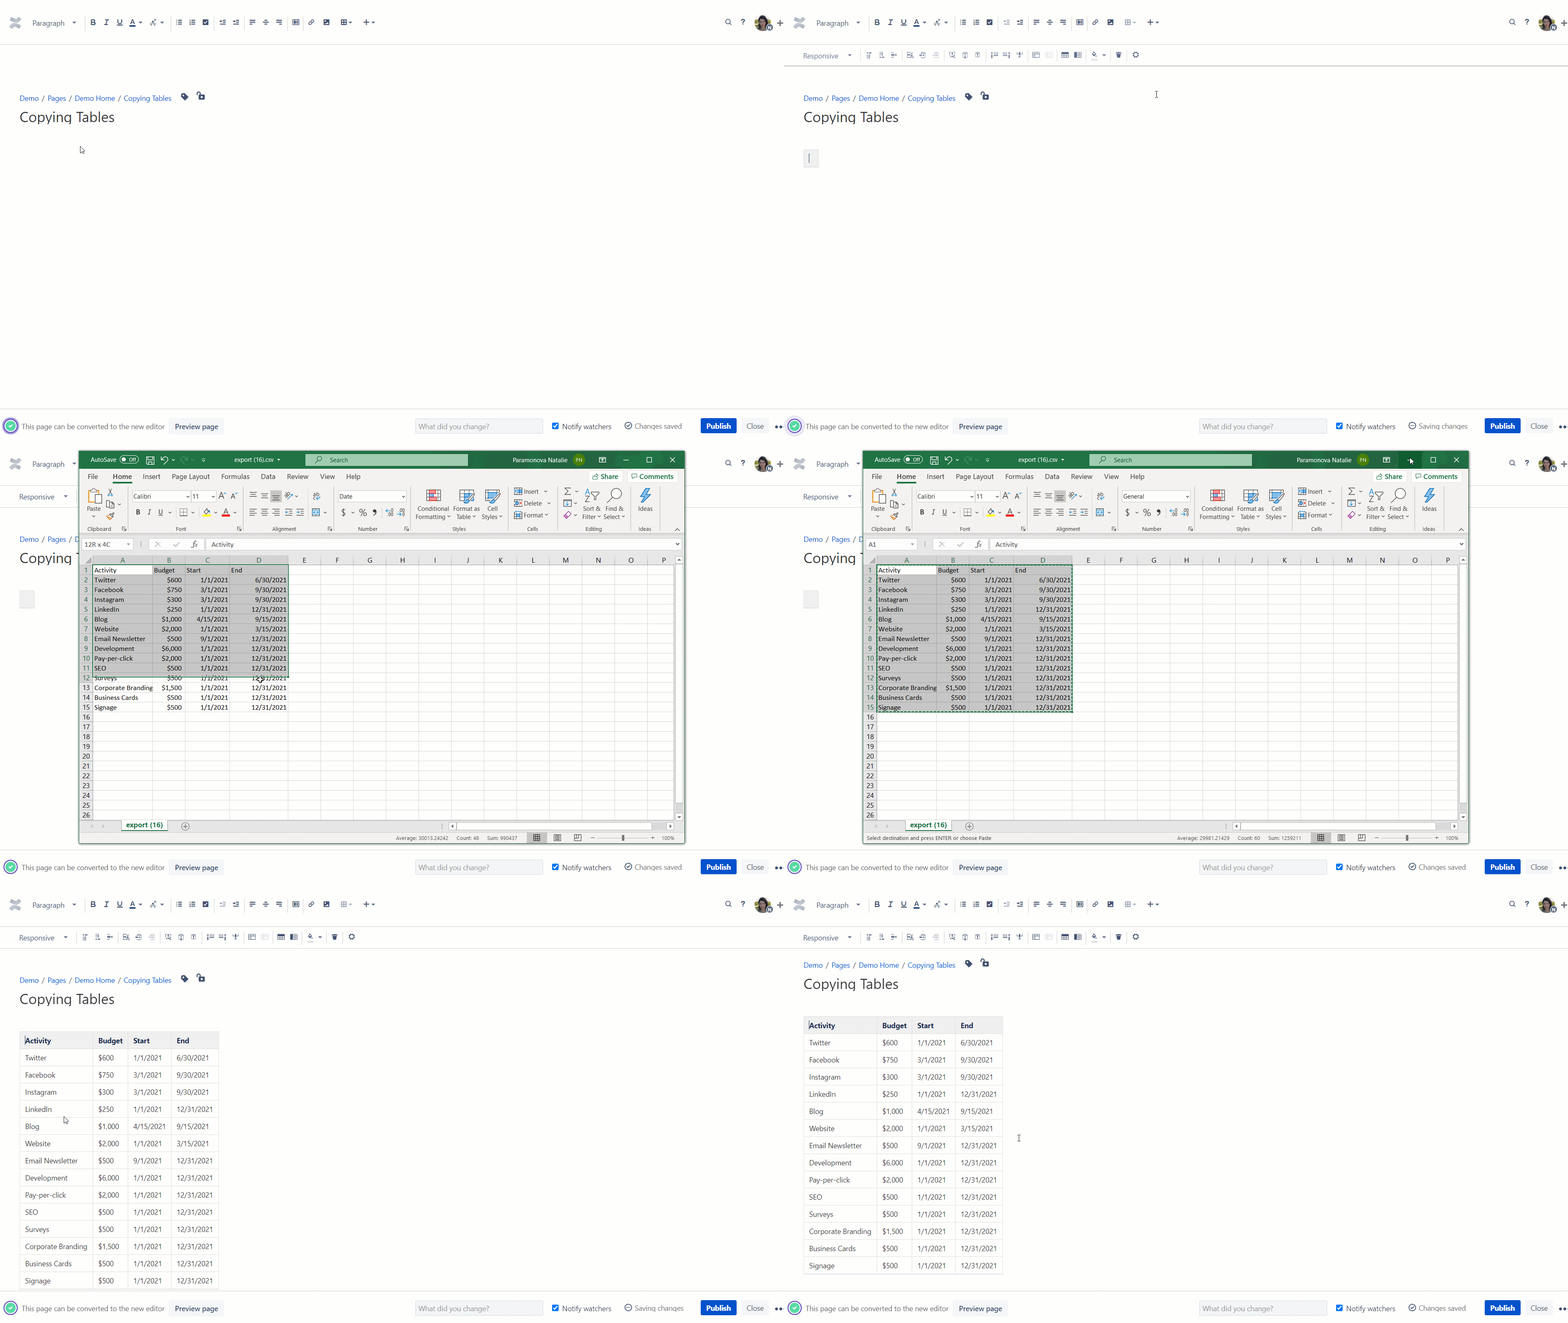
To copy data from Excel, you can easily copy it in the new editor by pasting the table right from Excel to Confluence. However, in the old editor, you need to insert one cell of the table to the Confluence page, place the mouse pointer into it, and then press Paste.
Pro tip:
Learn more about using Spreadsheets in Confluence
How to attach files with table data
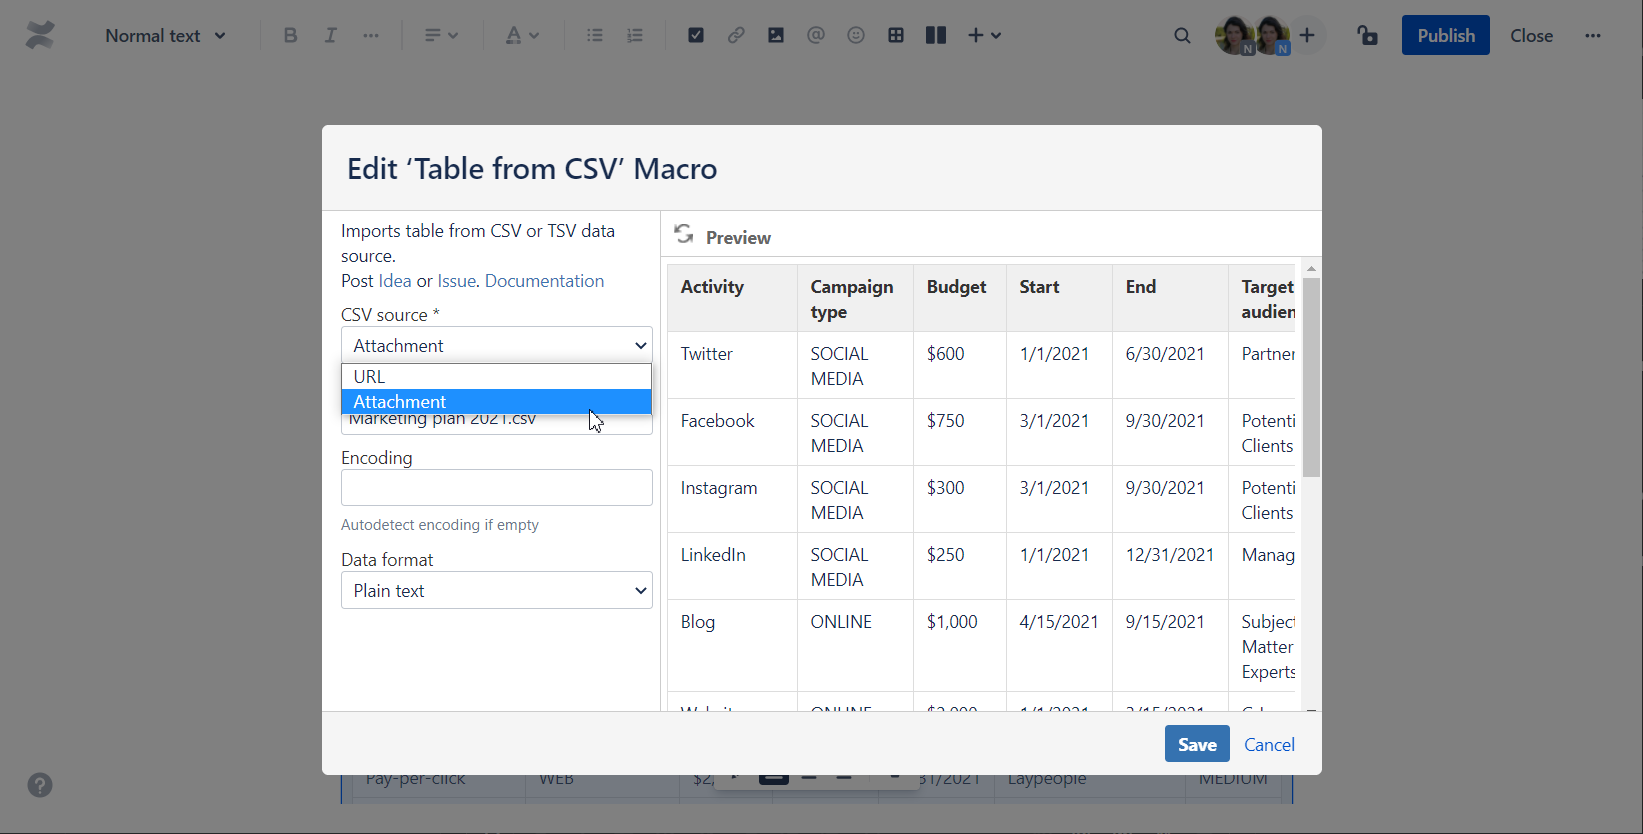
If you have data in the CSV (or JSON) format, you can display it in Confluence with the help of the Table from CSV or Table from JSON macros bundled in the Table Filter and Charts for Confluence app. You can either attach a file or output dynamic table data by URL.
You can also output tables from Google Sheets and Google Drive on Confluence pages with the help of the Table from CSV macro. Check this documentation for more details.
Working with tables in Confluence
Confluence doesn’t support data filtration and aggregation out of the box. Table Filter and Charts for Confluence can help you make your tables much easier to use, share, and update. You will also discover how to turn your Confluence tables into something really useful with the help of filters or provide dashboard-like reporting with pivots or charts, just let the app do the work
How to filter table data
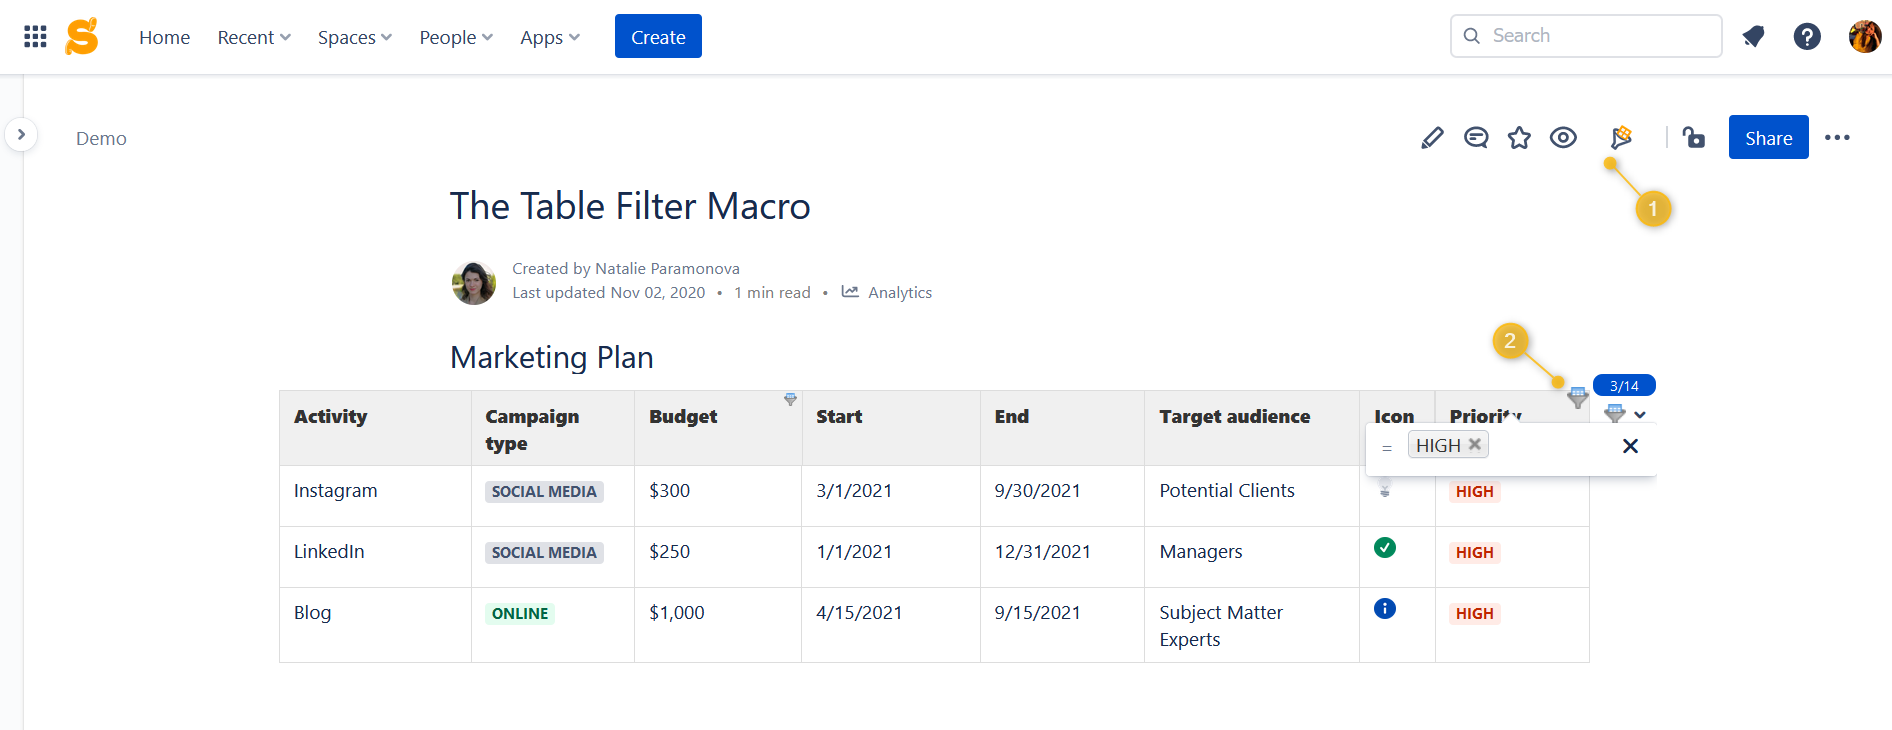
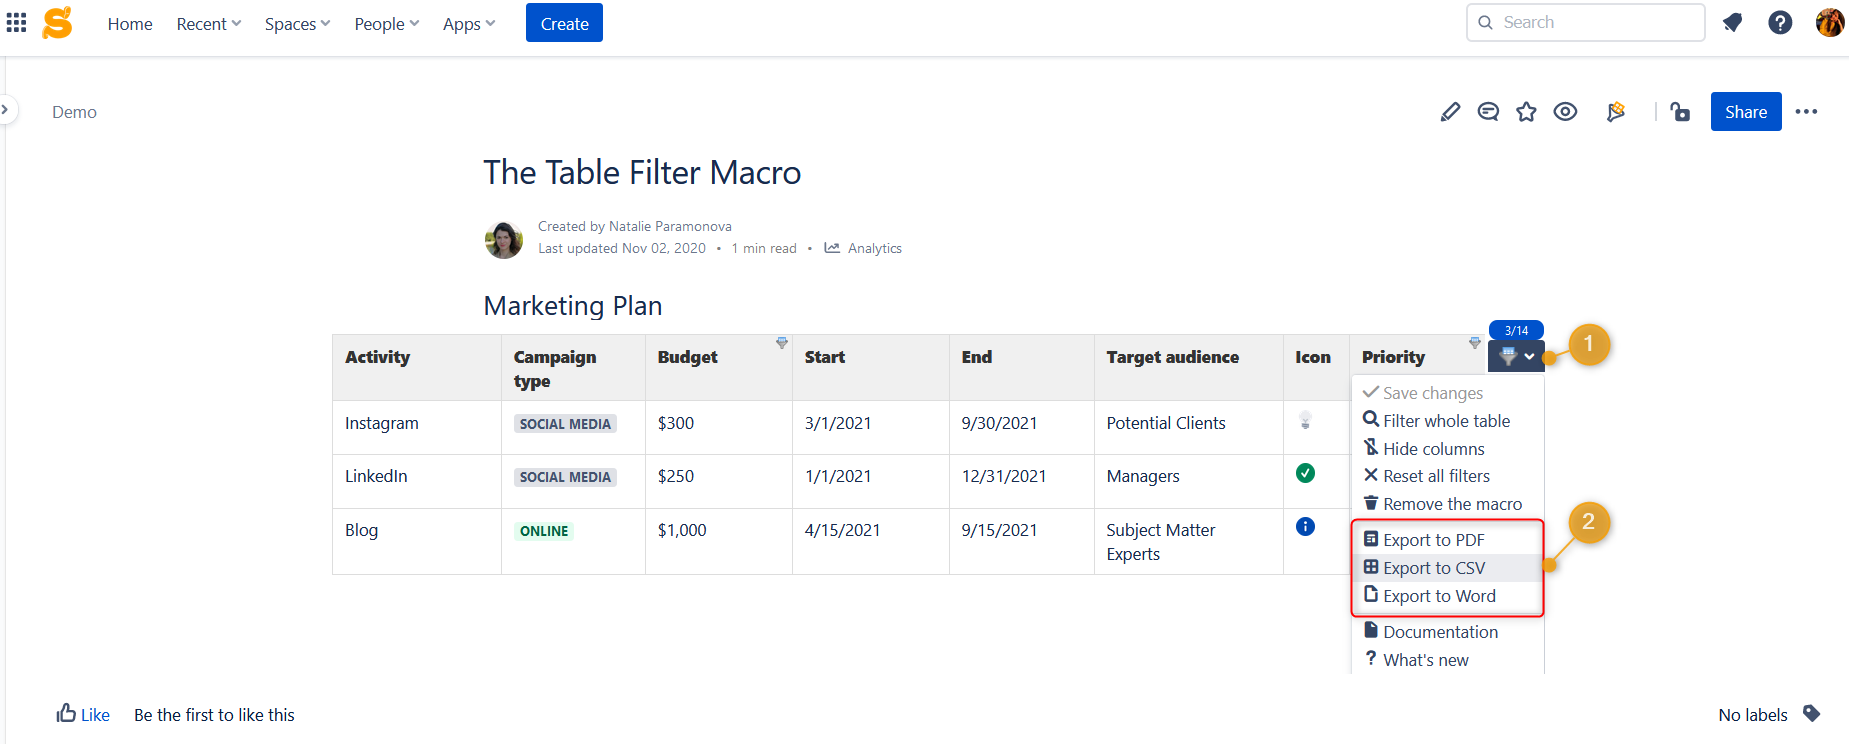
The Table Filter macro will be a real catch for users who work with large tables created manually or fetched from external resources to Confluence. This macro provides a set of five filters allowing you to split your data into independent data sets grouped by specific filtration criteria.
You can rapidly apply all types of filters and remove them saving all the modifications on the fly. Moreover, these filters are always at hand in the page view mode.
How to build pivot tables
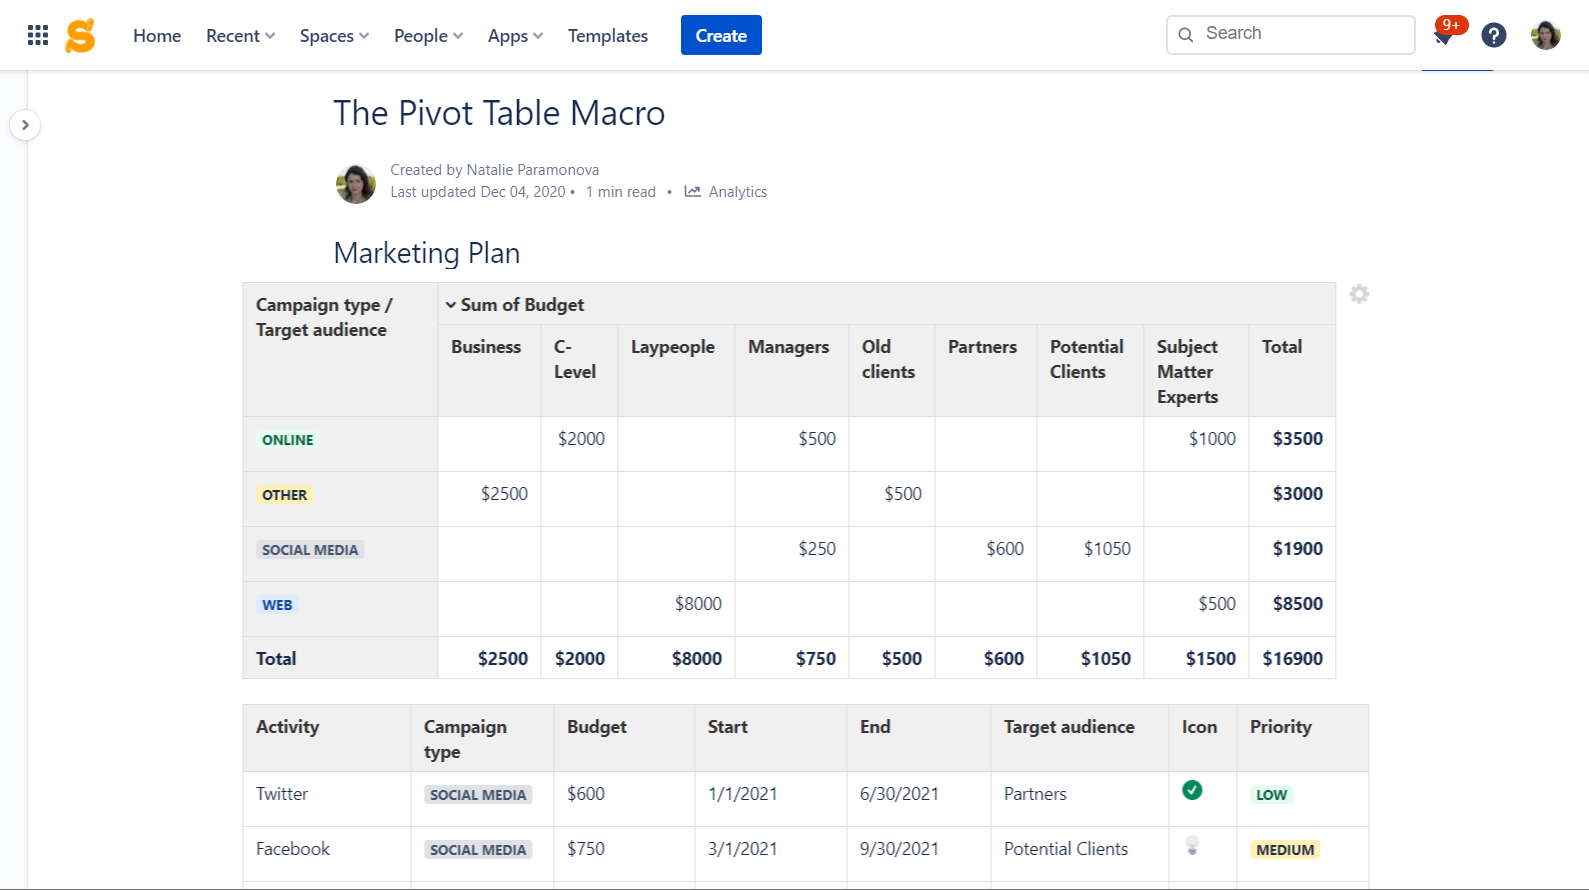
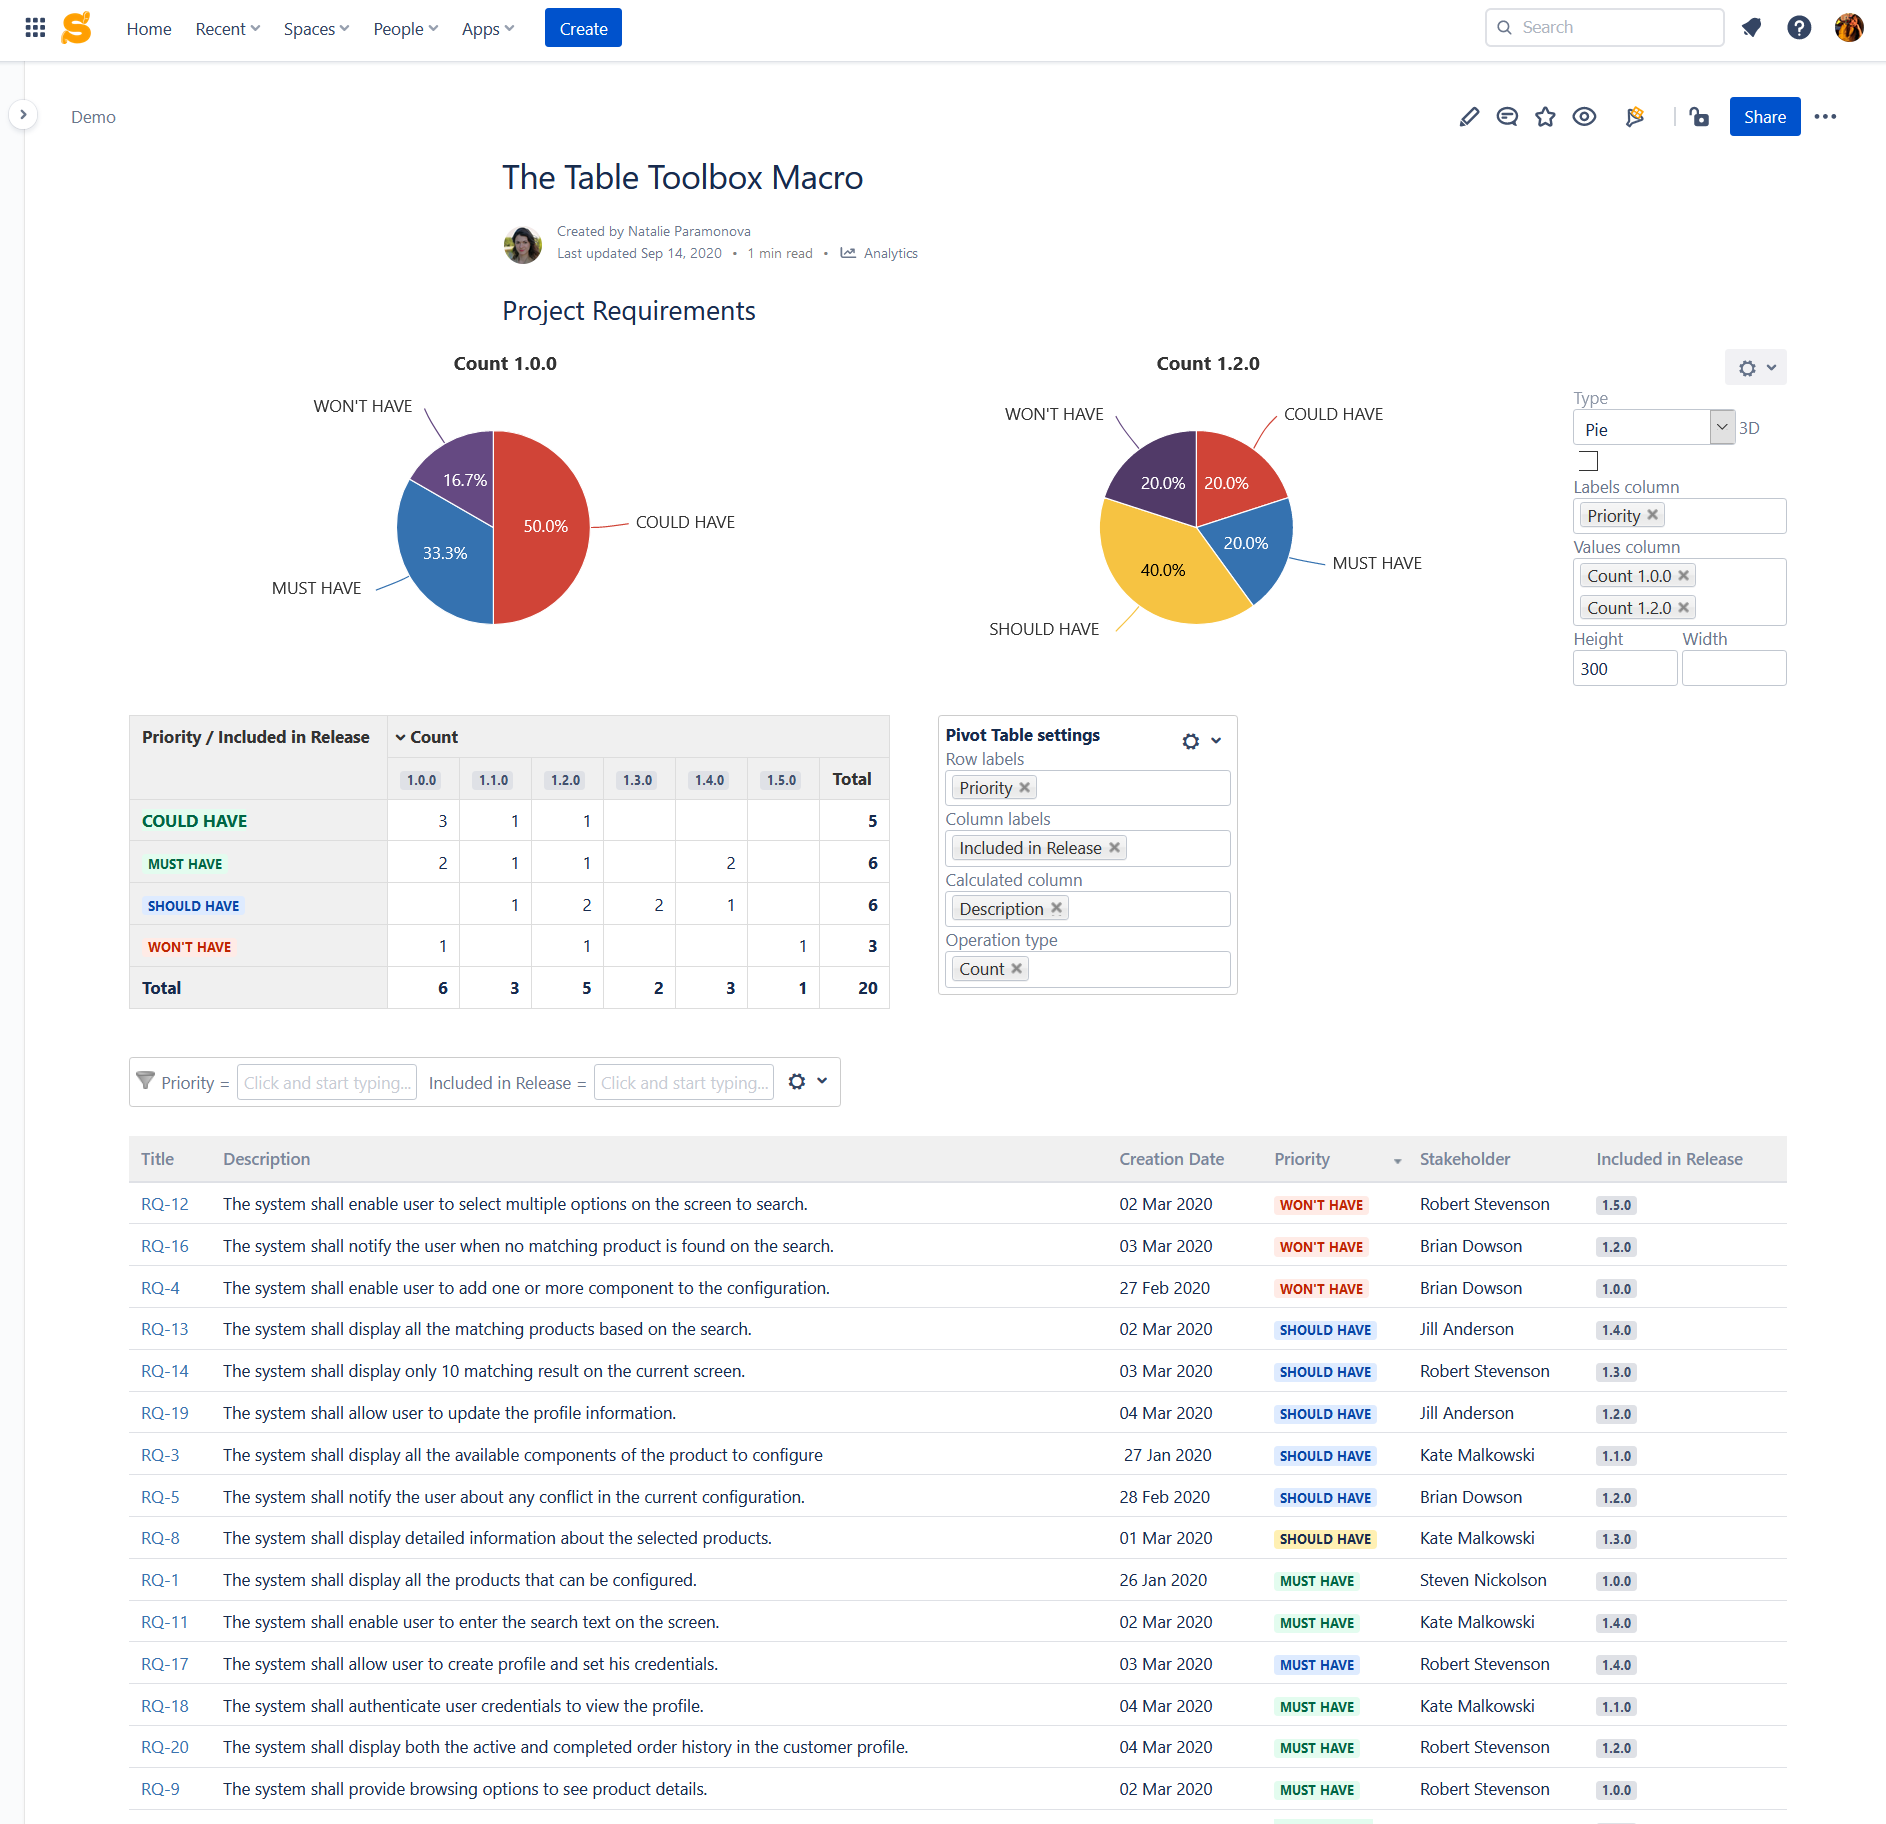
When you have a table with repeated labels and some financial data, you may find it useful to get it summarized and aggregated by labels. This is where a pivot table will be an ideal solution. The Pivot Table macro allows you to generate pivot tables on the basis of your source data tables created from scratch in Confluence or imported from an external resource or data feed.
To configure the Pivot table macro, select two table columns, one with repeated labels and the other with data values for data summarization or aggregation. Then you can select the appropriate operation type, define decimal and thousands of separators. And that’s done!
How to create charts and graphs
It is not a secret that the native Confluence Chart macro can be a bit inconvenient when you have to change the macro parameters on the fly. When you use the Chart from Table macro, you just need to insert the data table into the macro body and configure its parameters even in the page view mode.
You can select the columns with labels or dates and the column with data values and then choose the appropriate chart type. The set of available chart types includes pie, donut, column, bar, area, timeline, and more. Optionally, you can define the decimal separators, date format, dimensions of the chart, as well as hide the source table and the chart management pane.
How to export your filtered table data
You can swiftly export your filtered data into CSV, PDF, or Word. You need to click the Filter icon, choose the required format, check the export options, and click the Export button.
The great thing about the Table Filter for Confluence app is that all the macros can be easily combined with each other. When you have a large table, you can easily bundle all the above-mentioned macros and get an insightful chart on the basis of a pivot table with filtered results. If you change your filtered table, your pivot table and charts will update the data in realtime.
Things to keep in mind
As you can see working with tables in Confluence can be easy and tables can be fun. Table Filter and Charts for Confluence helps you set up a single base table and create multiple pivots and charts from it giving everyone in your company a reason to view content.
The available capabilities will satisfy most users, and the intuitive interface will not puzzle newbies in Confluence. The bundled macros will always help you filter table data, get the aggregated and summarized values, visualize table data with charts of different types, or combine all macros at once.
To try out this app and discover its features without installation, use our demo site.
If you have any questions or would like to suggest a topic for the next blog post about working with tables in Confluence, feel free to contact the Stiltsoft team.


