Data-Driven HR: Metrics and KPI in Onboarding and Learning

In the dynamic world of Human Resources, where decision-making is fundamental, the importance of data-driven insights cannot be overstated. Even in seemingly intangible areas like training, businesses aim to understand its effectiveness, its precise contribution to results, and whether the associated costs are justified.
In this article, we’ve compiled a list of metrics that enable data-driven discussions about onboarding and training. Some are automatically counted in an LMS, while others require additional resources and time. We’ll also offer insights into how to calculate the metrics and the benchmark values which they should align with.
Part 1: Metrics and KPIs for Internal Learning
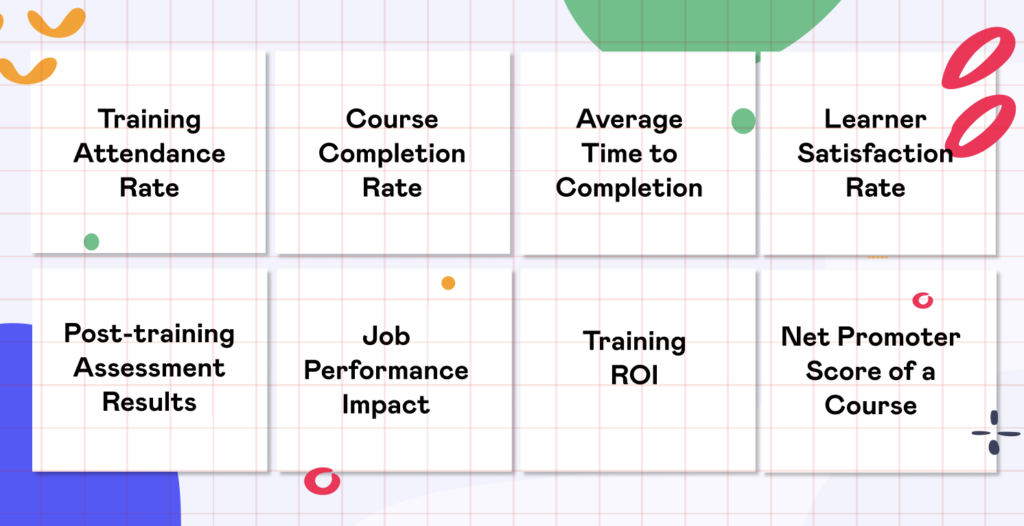
Training Attendance Rate
(Number of Attendees / Total Eligible Employees) x 100
Measuring employee engagement in scheduled training is crucial. Calculate it by dividing the number of attendees by the total eligible employees and multiplying by 100. Aim for 80-90% for mandatory sessions. The rates for optional training can vary greatly. You can also compare attendance rates by course type, topic, and more.
Course Completion Rate
(Number of Completers / Number Enrolled) x 100
Measure the percentage of employees who complete a course by dividing the number of completers by the total number enrolled and multiplying by 100. The industry average for eLearning course completion rates is disappointingly low, ranging between 20-30%. Aim for a higher standard, with targets set at 70-80% for mandatory courses and 50-60% for optional ones. Keep a close eye on this metric and adjust to the course to improve completion rates.
Average Time to Completion
Total Time Spent / Number of Completers
Evaluate the average time to finish a learning program by dividing the total time spent by the number of completers. Aim for completion within 75-100% of the estimated or planned time.
Learner Satisfaction Rate
(Satisfied Responses / Total Responses) x 100
The only way to find out if your learners are satisfied with your training is to ask them and calculate the percentage of positive responses out of total responses. Aim for 70-80% satisfaction. Keep the content updated and adjusted to participants need to keep at a high level.
Post-training Assessment Results
If you add a quiz as a part of a course to check learners understanding, you can look at the percentage of correct answers. The benchmark for a passing score is 80% or higher.
Quick tip: If your company uses Atlassian Confluence as an intranet or a knowledge base, you can create training courses right in your workspace in Confluence. Here’s how.
Job Performance Impact
Start by figuring out what exactly you want to improve through training. After the training, compare performance metrics post-training with those pre-training. Aim for a 10-20% improvement.
Training ROI (Return on Investment)
(Benefits – Costs) / Costs x 100
If you’ve managed to measure Job Performance Impact, it becomes easier to go further and gauge the financial return from training investments by using the formula above. Aim for a positive ROI. Remember, you don’t have to count ROI for every training program. Keep it simple and pick around 5% of them for this kind of analysis. Choose the ones that are more complicated and really shake things up in the business.
Net Promoter Score of a Course
The Net Promoter Score evaluation concept can also be applied to training. To calculate the Net Promoter Score (NPS) of a course, ask participants a straightforward question: “On a scale of 0 to 10, how likely are you to recommend this course to others?” Categorize their responses into Promoters (score 9-10), Passives (score 7-8), and Detractors (score 0-6). Subtract the percentage of Detractors from the percentage of Promoters to obtain the Net Promoter Score. NPS ranges from -100 to +100. A positive score indicates more promoters than detractors. Aim for a positive score, ideally above 30.
Part 2: Metrics and KPIs for Onboarding
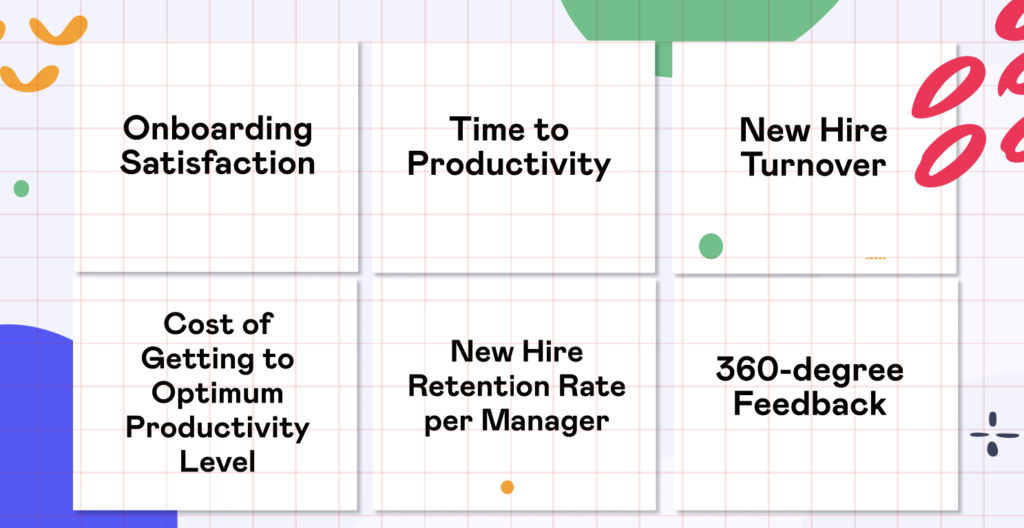
Onboarding Satisfaction
(Satisfied Responses / Total Responses) x 100
Measure new hires’ satisfaction with onboarding by calculating the percentage of satisfied responses out of total responses. Aim for 70-80% satisfaction.
Quick tip: Explore a case study on how onboarding can be organized in a tech company.
Time to Productivity
Defining how productive employees are can be tricky since there’s no one-size-fits-all measure. Figuring out how long it takes for someone to get productive (Time to Productivity) can be complicated and time-consuming. One way to do it is by setting specific goals (KPIs) for each job and then tracking how long it takes for a new person to meet those goals. But there’s a simpler solution. Instead of going into all the details, just ask the managers how long they think it takes for new employees to become fully productive and compare it with what actually happens. This can both help you track how quickly different teams and roles get up to speed and catches any differences between managers’ expectations and reality when hiring and onboarding new folks.
Cost of Getting to Optimum Productivity Level
Time to Productivity * (Employee salary cost + manager (mentor) salary cost)
Once you’ve managed Time to Productivity, evaluate the financial investment required for peak productivity. Calculate this by multiplying Time to Productivity by the sum of the employee’s salary cost and the manager’s (mentor’s) salary cost.
New Hire Turnover (Voluntary and Involuntary)
(New hires who have left the organization during a period / New hires from that same period ) x 100
Understanding and managing turnover is crucial. Calculate New Hire Turnover by dividing the number of new hires who left the organization by the total number of new hires in that same period, then multiply by 100 for a percentage. Consistency is key when comparing different periods. Implement strategies to reduce turnover and enhance the longevity of new hires.
New Hire Retention Rate per Manager
(Number of Retained Employees under a Manager / Total New Hires under a Manager)
Calculate the percentage of new hires that a manager successfully retains. An optimal retention rate typically falls within the 80-90% range, signifying a manager’s ability to engage and nurture their team. If the rate is lower, it may indicate potential issues in leadership or a need for additional support and development opportunities for the manager.
360-degree Feedback
Collect comprehensive feedback to assess new hires’ impact by aggregating feedback from peers, managers, and subordinates. Striving for a balance between positive and constructive feedback ensures a fair and accurate assessment.
Conclusion
In the HR realm, success is measurable. Armed with these metrics and KPIs, HRs and Learning Managers can track progress and pave the way for continuous improvement. Remember, the power lies both in the data and the actions it inspires. Also, keep in mind that sometimes a single metric does not provide insight into whether it is good or not, and you need to look at it over time. So, go ahead, measure, analyze, and elevate your organization’s learning and onboarding experiences.
Additional materials for HR pro:


