How to Perform Code Review and Track Team Activity in Bitbucket

August 8, 2019
#How To#Bitbucket#Case Study
6 min

Resolution Time Distribution Reports have helped a lot during the development of a high priority module to increase the reviewers, review frequency and also track team activity in Bitbucket.

Eduard Pal, Innoface

Innoface GmbH, one of our customers, is one of the leading providers of interfaces between PDM and ERP systems worldwide. Its applications help ensure a direct and reliable flow of information between engineering and logistics. They also offer additional products and services in order to facilitate seamless integration of the involved systems.

Innoface product development team uses Awesome Graphs for Bitbucket mostly for making data-driven management decisions. They find it very useful to:

  • track the activity of each developer and a team in general;
  • check if code review goes according to the plans;
  • predict time to resolve pull requests.

Let’s see how Innoface benefits from using Awesome Graphs for Bitbucket.

Tracking team activity in Bitbucket

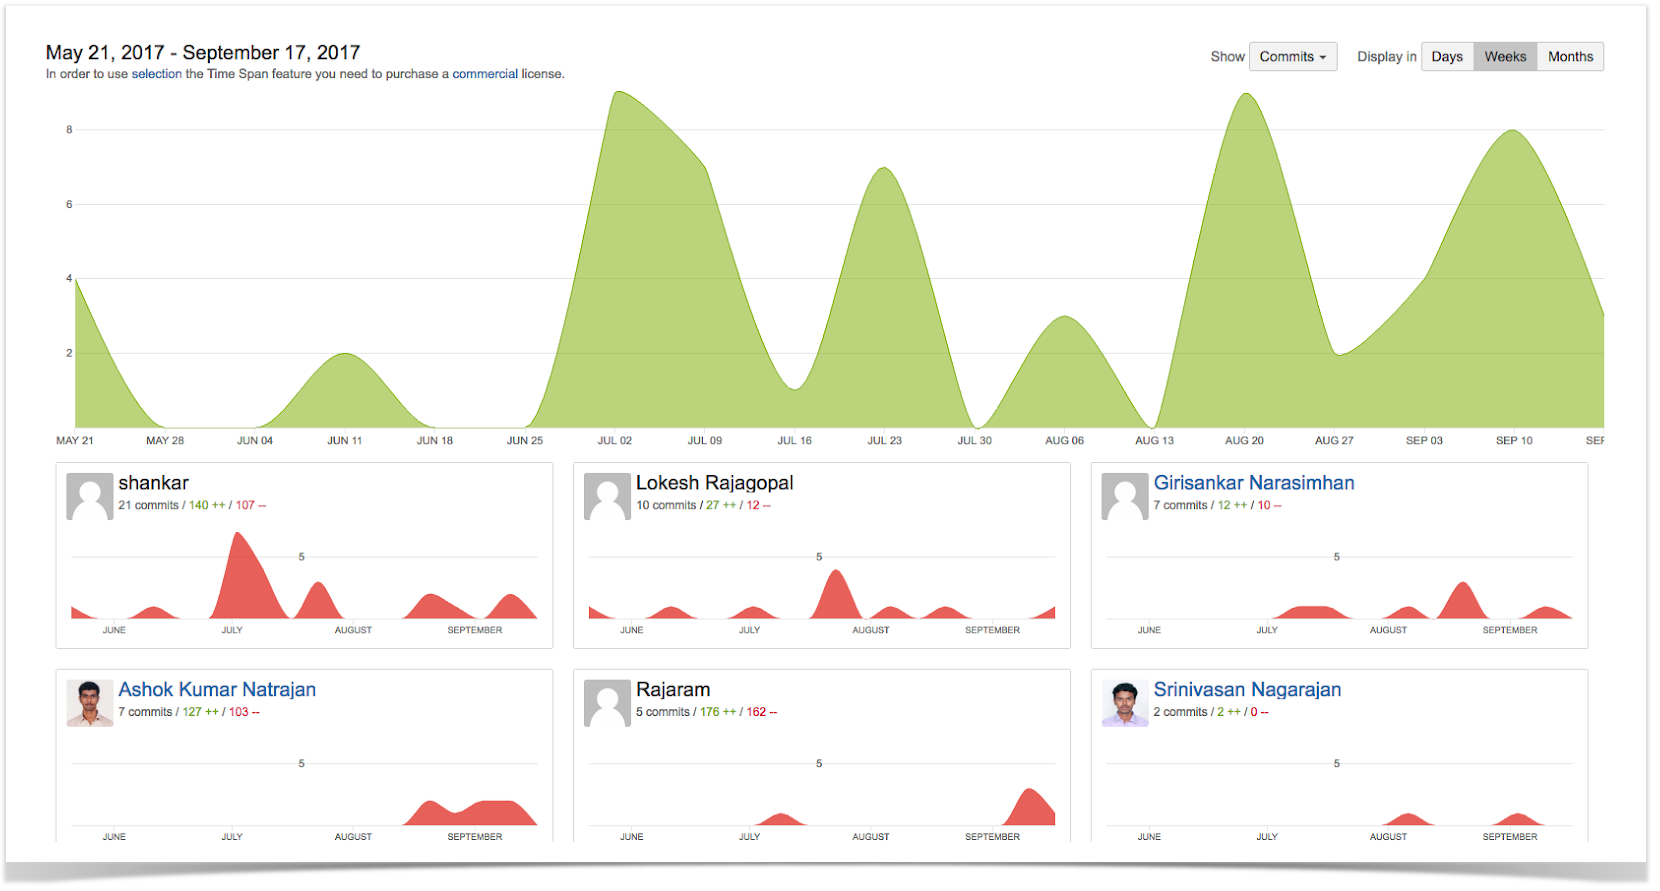
Activity graph helps Innoface have a high-level overview of the total number of commits and contributors in a specific period, for example, a week. It also provides an opportunity to track the number of open pull requests from all the contributors and the repositories.

Using this graph, the manager can assess the activeness of a contributor. This gives the manager an idea of whether an employee is following the company’s development policy or not as well.

tracking team activity in Bitbucket

Based on the number of open pull requests, the manager in Innoface can actually plan time to review the code and merge them. This graph also gives an opportunity to process the pull requests from the contributors that are working on the high-priority projects.

Analyzing code review practices

Innoface management finds Resolution Time Report very helpful when it comes to tracking the frequency of processing the pull requests.

analyze code review in Bitbucket

The manager uses this report in order to see the frequency with which the reviewers are processing the pull requests. Based on the data that this report provides, it’s easier to make a reasonable decision and to assign either more reviewers or increase the frequency of the reviewers, especially for the high-priority projects.

Predicting pull requests resolution time

Resolution Time Distribution report helps Innoface estimate resolution time for future pull requests to make more accurate release dates planning.

pull request resolution time in Bitbucket

The manager of a product team uses this report in addition to the Resolution Time Report in order to estimate the resolution time for future pull requests.

Conclusion

Awesome Graphs greatly enriches the Bitbucket user experience for Innoface. With its help, it becomes much easier to make decisions based on data and keep an eye on how efficient their development practices are.

Read more case studies to see how our customers benefit from using Awesome Graphs for Bitbucket in their work:

Start a free trial of Awesome Graphs

Related posts

    Awesome Graphs for Bitbucket: Exclude Files from Lines of Code Statistics

    March 22, 2019
    #Bitbucket#How To
    9 min

    Awesome Graphs for Bitbucket is an app visualizing statistics of Git repositories in terms of commits, pull requests, and lines of code. The Contributors graph, and the Code Frequency graph show how many lines of code were added and deleted in the repository in general and by each developer. 

    Sometimes lines of code statistics doesn’t represent correctly the actual effort and value that developers bring to the repository. For example, if a new library was added, it will bring hundreds of new lines while a task itself was easy to do and took half an hour.

    To make your data more precise and informative, there’s a feature in Awesome Graphs that allows the exclusion of files from lines of code (LOC) statistics.

    Why Exclude Files from LOC Stats

    This feature will be helpful for users, who:

    • Include source code from third-party libraries, and don’t want to count it towards individual code contributions.
    • Want automated code generated files not to be included into LOC statistics. 
    • Version a lot of configuration in very large xml files, and don’t want to count their updates as additions of thousands of LOC.
    • Want to include in LOC statistics only files with selected extensions (i.e. c, cpp, h).
    • Want to count in LOC statistics only files from the selected directory (i.e. src).

    How it works

    Repository administrators can add patterns in a gitignore format telling what files have to be excluded from LOC statistics of a repository.  

    bitbucket repository settings

    It is possible to exclude:

    • particular files
    • all files with selected extensions
    • all files from selected directories
    • everything except files with selected extensions
    • everything except files from selected directories

    When an administrator adds or modifies patterns, Awesome Graphs re-indexes the repository and displays graphs with new LOC statistics.

    Benefits Examples

    You can see examples of this feature usage in public repositories.

    Statistics for the main directory of a repository

    Let’s view the Contributors graph for the jquery repository. It shows additions of LOC in the whole repository.

    contributors bitbucket

    The repository exists since 2006, but according to the graph there was no significant activity there till 2014.

    It would be great to make the graph more informative and calculate LOC statistics only for the directory containing the main source code – src. We exclude from statistics all files except files from this directory and get a new graph showing the most important activity happened in the key folder of the repository. 

    contributors graph bitbucket

    Exclusion of files helped to get new insights:

    • There was intensive activity in 2006-2008, 2011, and 2014.
    • There was no significant activity after 2016.
    • Only two of top four contributors to the repository are also in the top four contributors to main source code.

    In the first graph there were peaks of activity showing additions of 50K and even 250K lines of code per week. In the second graph the largest peak shows addition of 25K lines of code, others – about 5K. This data represents the real work of developers more accurately.

    Exclusion of third-party libraries from statistics

    Let’s view the  graph for the kubernetes repository.

    Bitbucket Code Frequency

    There are two peaks of activity: addition and deletion of more than 300K lines of code. They represent not actual work, but operations with third party libraries. Huge peaks of additions and deletions caused a large scale of Y axis. Due to this all other activity seems to be non-significant.

    Let’s exclude from lines of code statistics files from the directory third_party.

    The graph has become more accurate. Peak values disappeared. The scale of Y axis decreased allowing to get a better understanding of the activity in the repository.

    Get more informative LOC statistics

    Using Awesome Graphs for Bitbucket, you can enrich your commits, lines of code reporting with the REST API the app provides. For example, you can easily count each pull request size to decide whether it needs to be decreased. Read more about it in our blog post.

    Try the app for free discover more benefits and unleash the potential of your teams.

    Related posts

      3 New Bitbucket Apps to Take Care of Your PRs – Fourth Quarter 2018

      January 31, 2019
      #How To#Bitbucket
      7 min

      It can be a bit hard to keep up with all of the great new apps that appear on the Atlassian Marketplace every quarter. Luckily, we are doing the work for you and share our picks of the most interesting solutions for Atlassian products in our blog. This time we’ve chosen the most interesting apps for Bitbucket users released between October 1 and December 31.

      Check out our top 3 apps for Bitbucket Server:

      Here are the best Bitbucket apps released in the first, second and third quarters of 2018 you may have missed.

      You can also try Awesome Graphs for Bitbucket for free, this app helps you analyze the average time taken to resolve pull requests and build even more useful reports to visualize your team’s work. Learn more about how this solution can make your life easier.

      Pull Request Labels

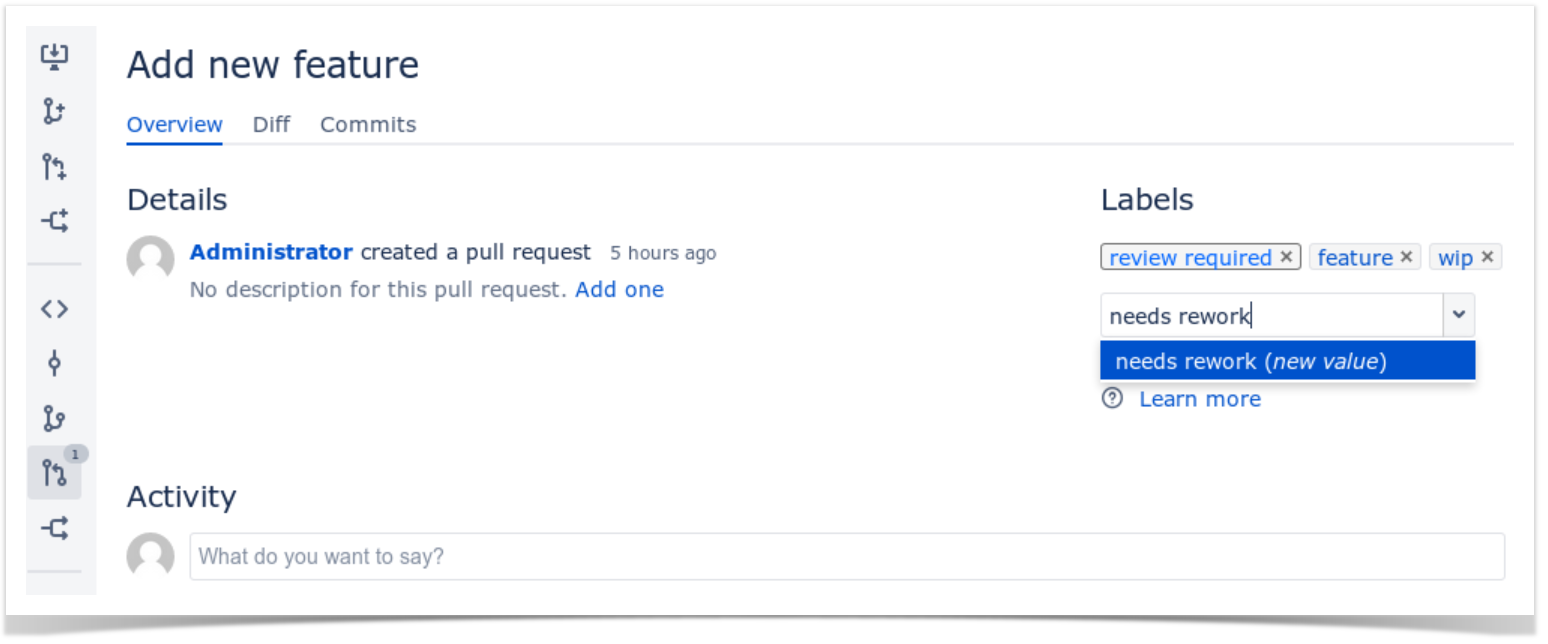
      Pull Request Labels is an app that helps you assign labels to your pull requests to better organize your work on projects. For a big project with lots of contributors and pull requests, the capability to label PRs seems invaluable. This way all members of your team can get quick insights into a pull request seeing its state and purpose.

      After you created a label, you can use it for any pull request within the repository it is tied to signifying its priority or any other information you find useful. You can easily manage and edit labels staying on the pull request page by clicking the Edit button.

      So when you open a pull request and want your colleague to review it, you can now mark it with the Review Required label letting others know that your PR is ready for review. Just find the required label in the drop-down menu.

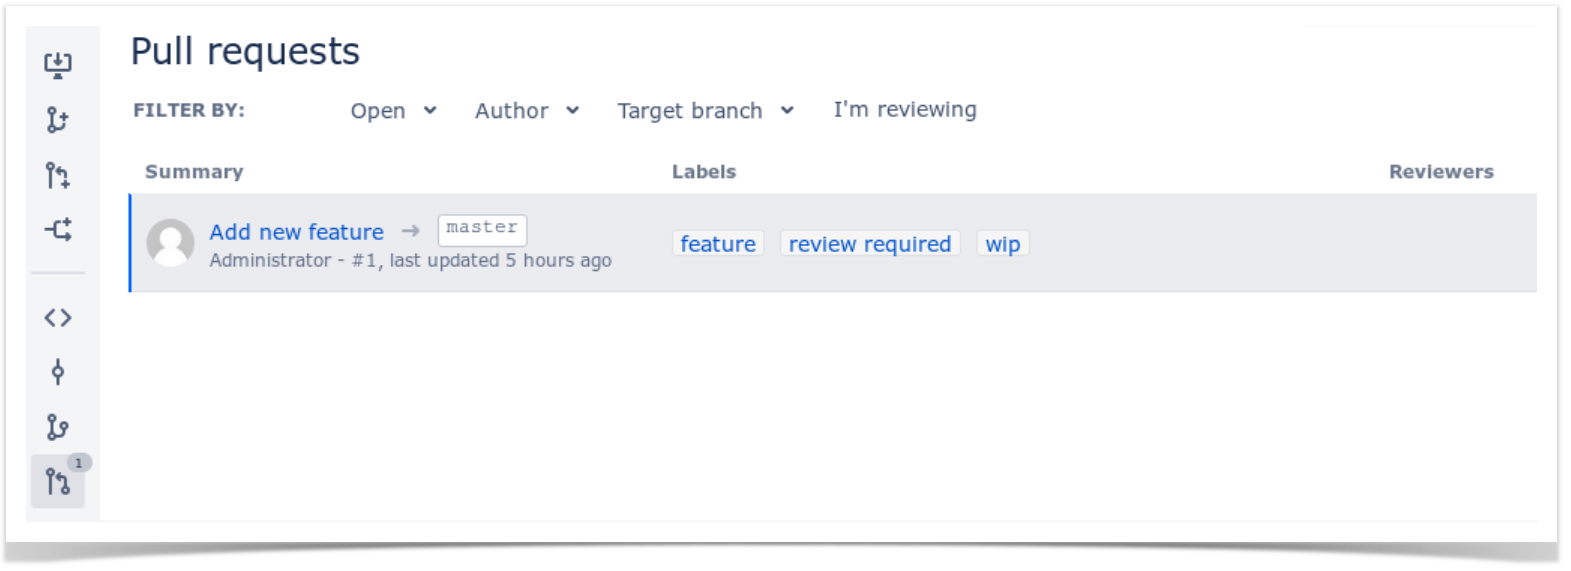
      You can check all labels related to the PR in the pull request table.

      This app is currently in alpha stage and its developer is planning to add more features in the nearest future.

      Pricing: Pull Request Labels is free to use.

      Prevent merge when needs work

      When you work with multiple reviewers on your pull requests, you may want to prevent merge in case one of your colleagues marks the pull request as ‘Needs Work. Prevent merge when needs work is an app that makes your merge operations easier.

      Now you can disable the Merge button when one of reviewers sets the Needs Work status on a pull request preventing the automerge.

      When one of your teammates commits new changes after approval, all approvals will be deleted.

      Pricing: Prevent merge when needs work is free to use.

      Pull request’s dependencies

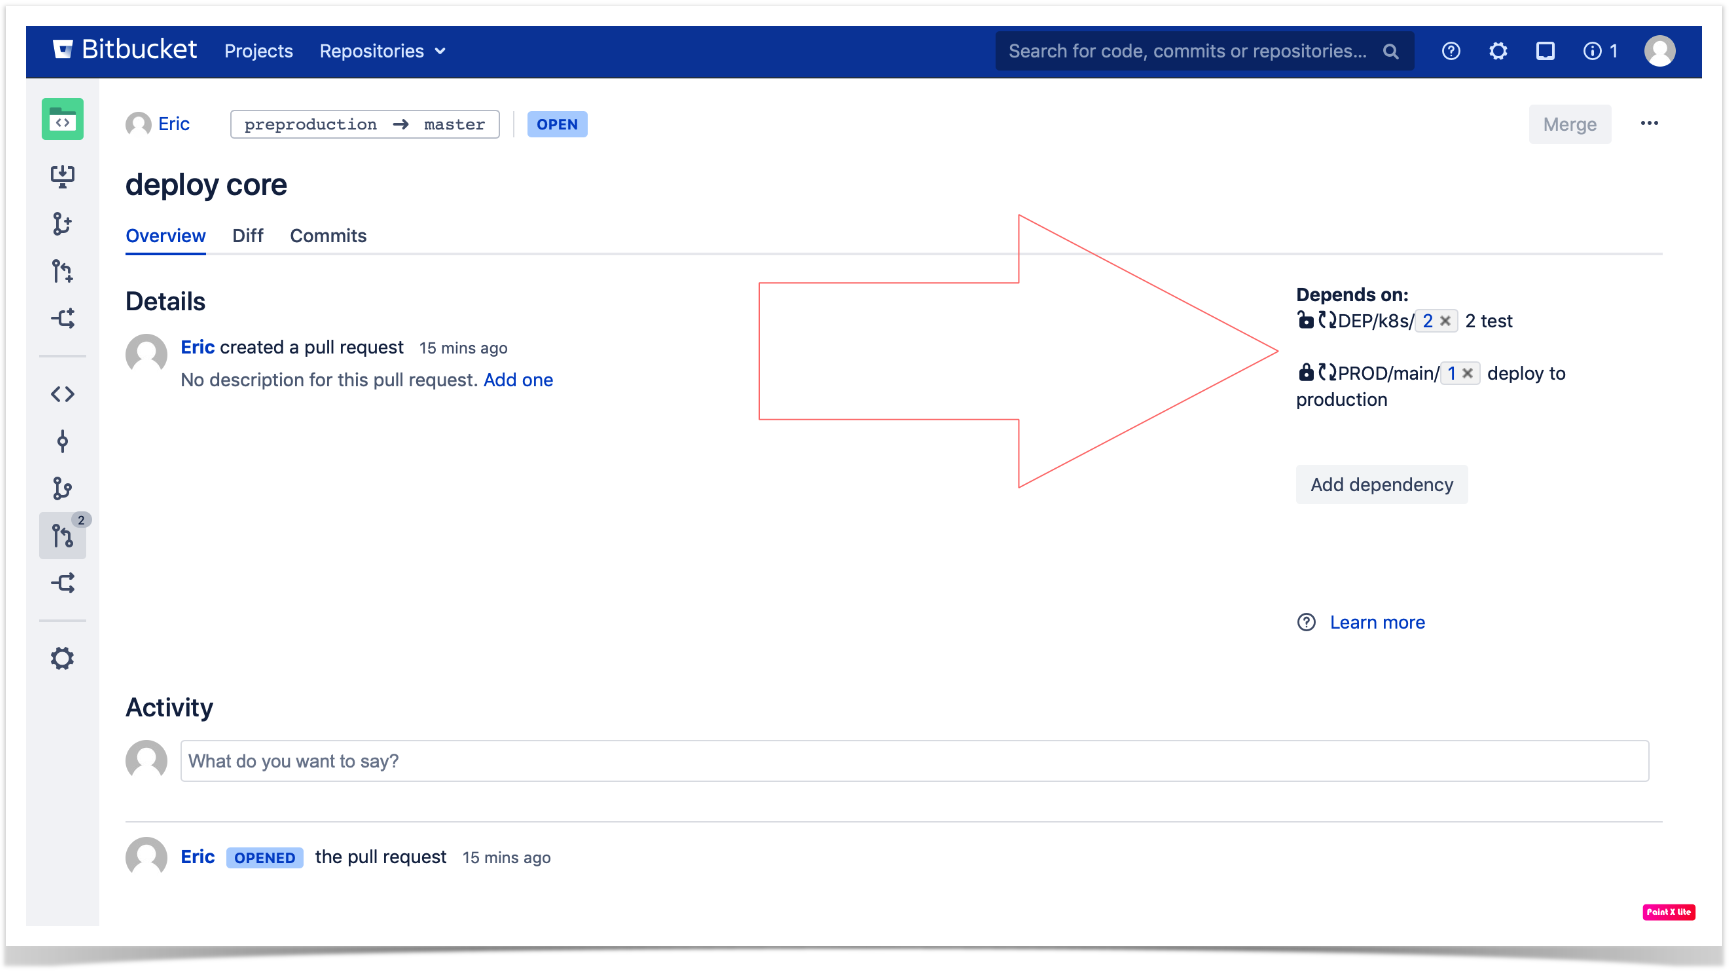
      Pull request’s dependencies is a useful app if you are working on several separate projects in different Bitbucket repositories and need to make changes in one project that will later require an update to another project. Now you can create and add dependencies to all open pull requests choosing the type of dependency (blocking or non blocking).

      This app prevents you from merging PRs with open pull requests in dependencies. You can see the detailed list of related dependencies with their statuses.

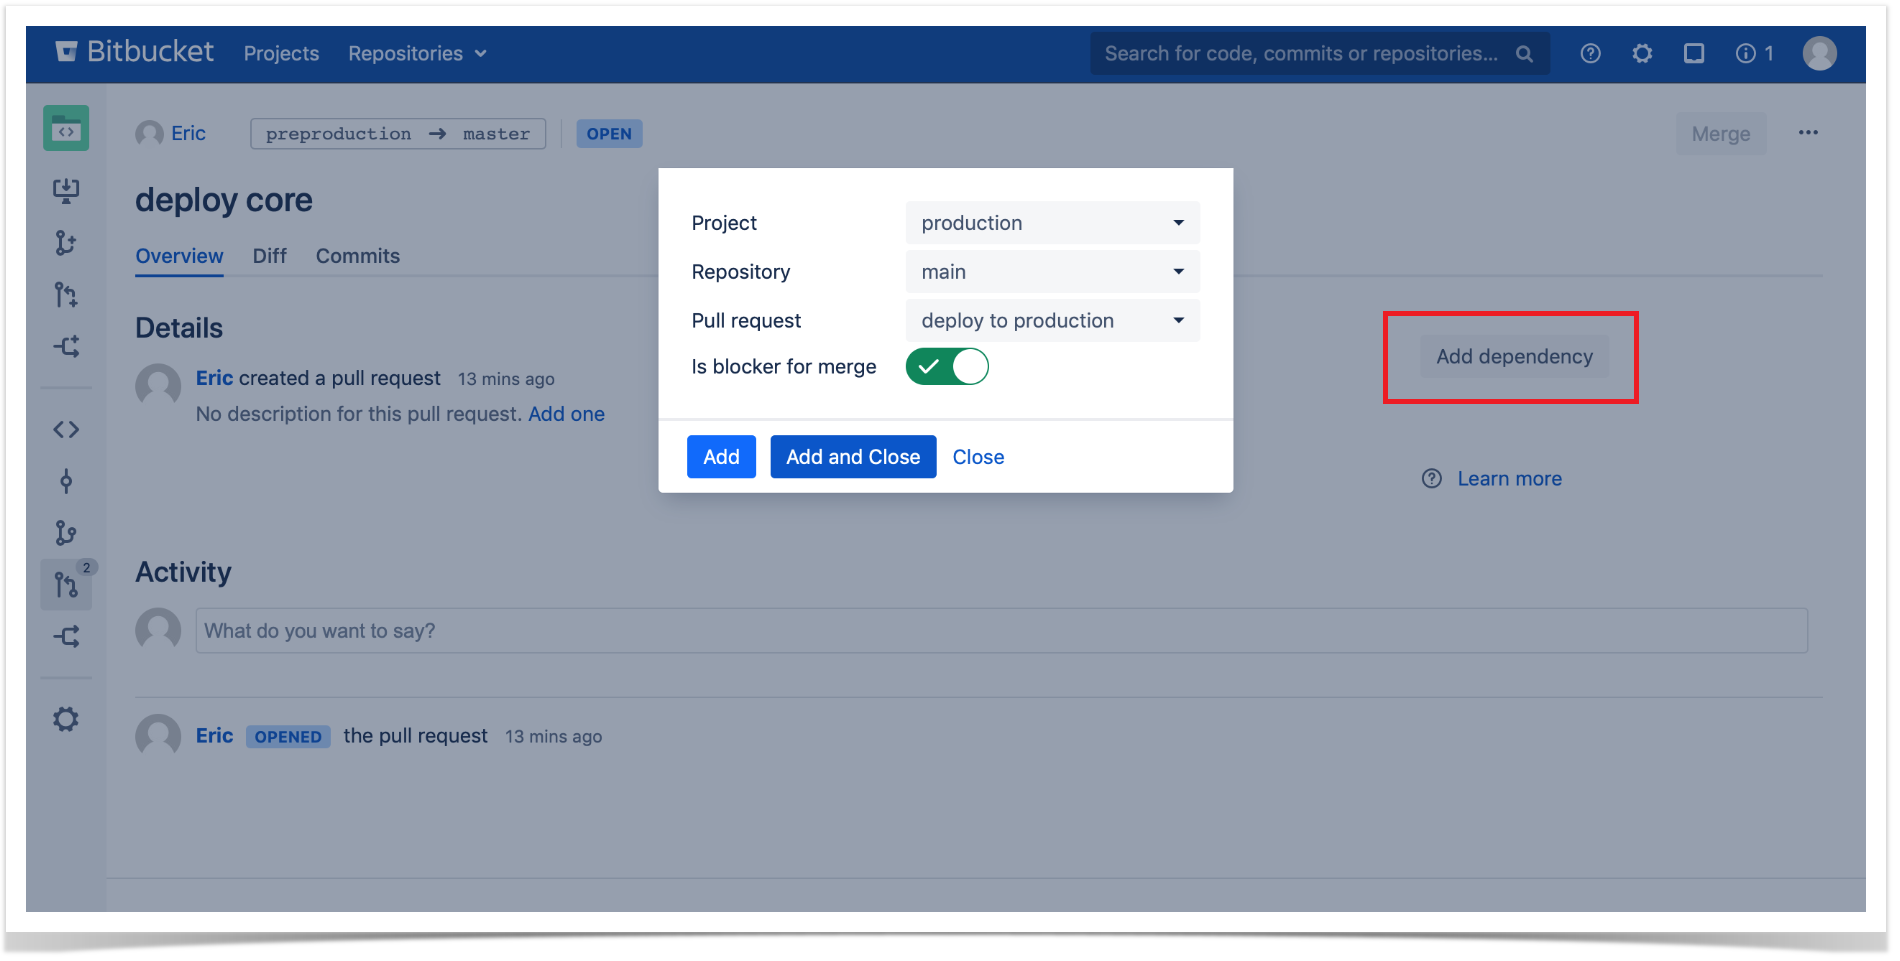
      You can add several dependent pull requests from any project and repository. If you activate the Is blocker for merge option during this process, you can close the current pull request only when the linked one is closed.

      This app also allows you to remove any irrelevant dependencies.

      Pricing: The price of Pull request’s dependencies starts from $25 for 25 users and ends at $2,000 for 2,000 users.

      If you have any questions, feel free to comment on this blog post. Stay tuned and subscribe for email notifications about new posts in our blog – enter your email in the ‘Newsletter’ section on the sidebar.


      Related posts

        New in Awesome Graphs for Bitbucket Cloud: Lines of Code Statistics and Aggregated Stats for All Repos

        December 6, 2018
        #News#Bitbucket
        3 min

        Awesome Graphs for Bitbucket Cloud visualizes statistics of Git repositories. View this video to see the new features and the improvements we’ve recently made to the app or keep reading.

        Lines of code statistics

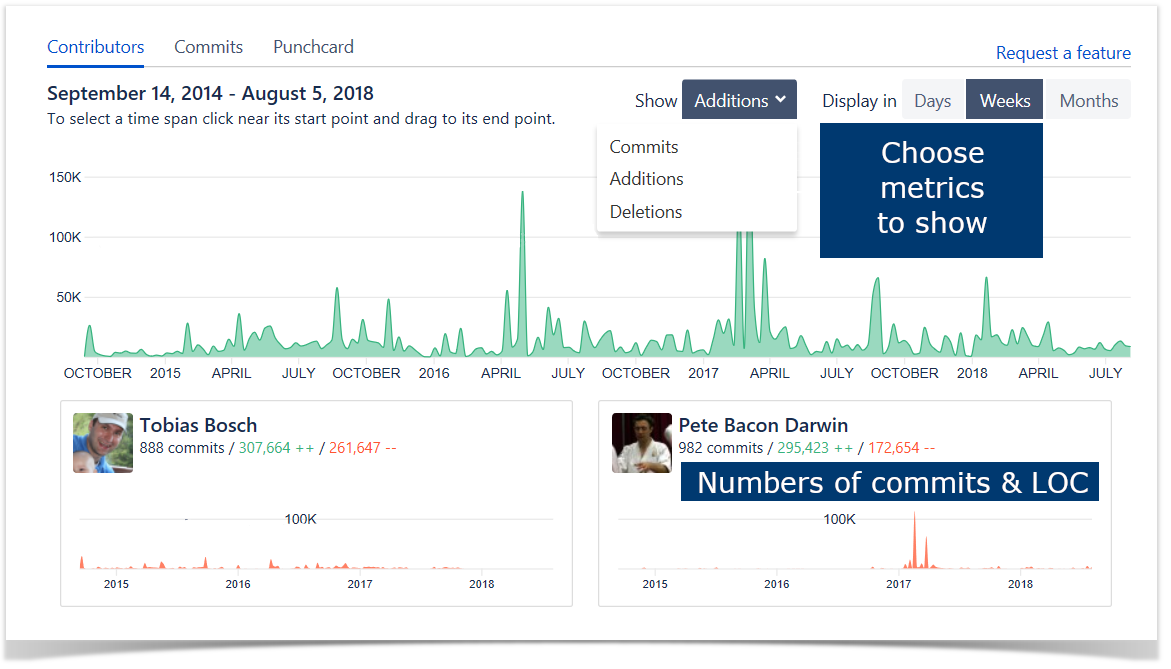
        Previously Contributors graph showed only commits statistics. Now it visualizes repository and user activity in terms of lines of code (LOC).

        You can choose what data to show on the summary graph and individual contributor graphs:

        • commits
        • added lines of code
        • deleted lines of code

        Lines of code metrics are more informative than the number of commits. They will help you to get a better understanding of project activity and efficiency of your team members.

        Contributors graph

        Aggregated stats for all repositories

        Now Awesome Graphs can show ContributorsCommits, and Punchcard graphs with aggregated statistics across all repositories of a user or a team.

        This feature will help you to:

        • see your personal progress
        • monitor performance of your team
        • evaluate work of your team members

        Aggregated stats in Contributors graph

        Awesome Graphs for Bitbucket Cloud is an analytical tool visualizing repository and user activity. With it, you can evaluate team’s performance, track process improvements, and deliver products faster by eliminating guesswork. Try the app now for free!

        Learn more about how to install Awesome Graphs or click here to install the app.

        Related posts

          3 New Bitbucket Apps to Stay on Top of Your Projects – Third Quarter 2018

          November 8, 2018
          #How To#Bitbucket
          6 min

          With so many apps for Atlassian products on the Atlassian Marketplace, it can be pretty tough to cover every solution out there if you want to power up your Bitbucket. That’s why we’ve taken the time to try out and recommend a couple of new apps for users who want to get the most out of their Bitbucket experience. Here is our top three apps appeared on the Atlassian Marketplace in the third quarter:

          You can also check our picks of the most interesting Bitbucket apps released in the first and the second quarters of 2018.

          Commit Graph for Bitbucket Server

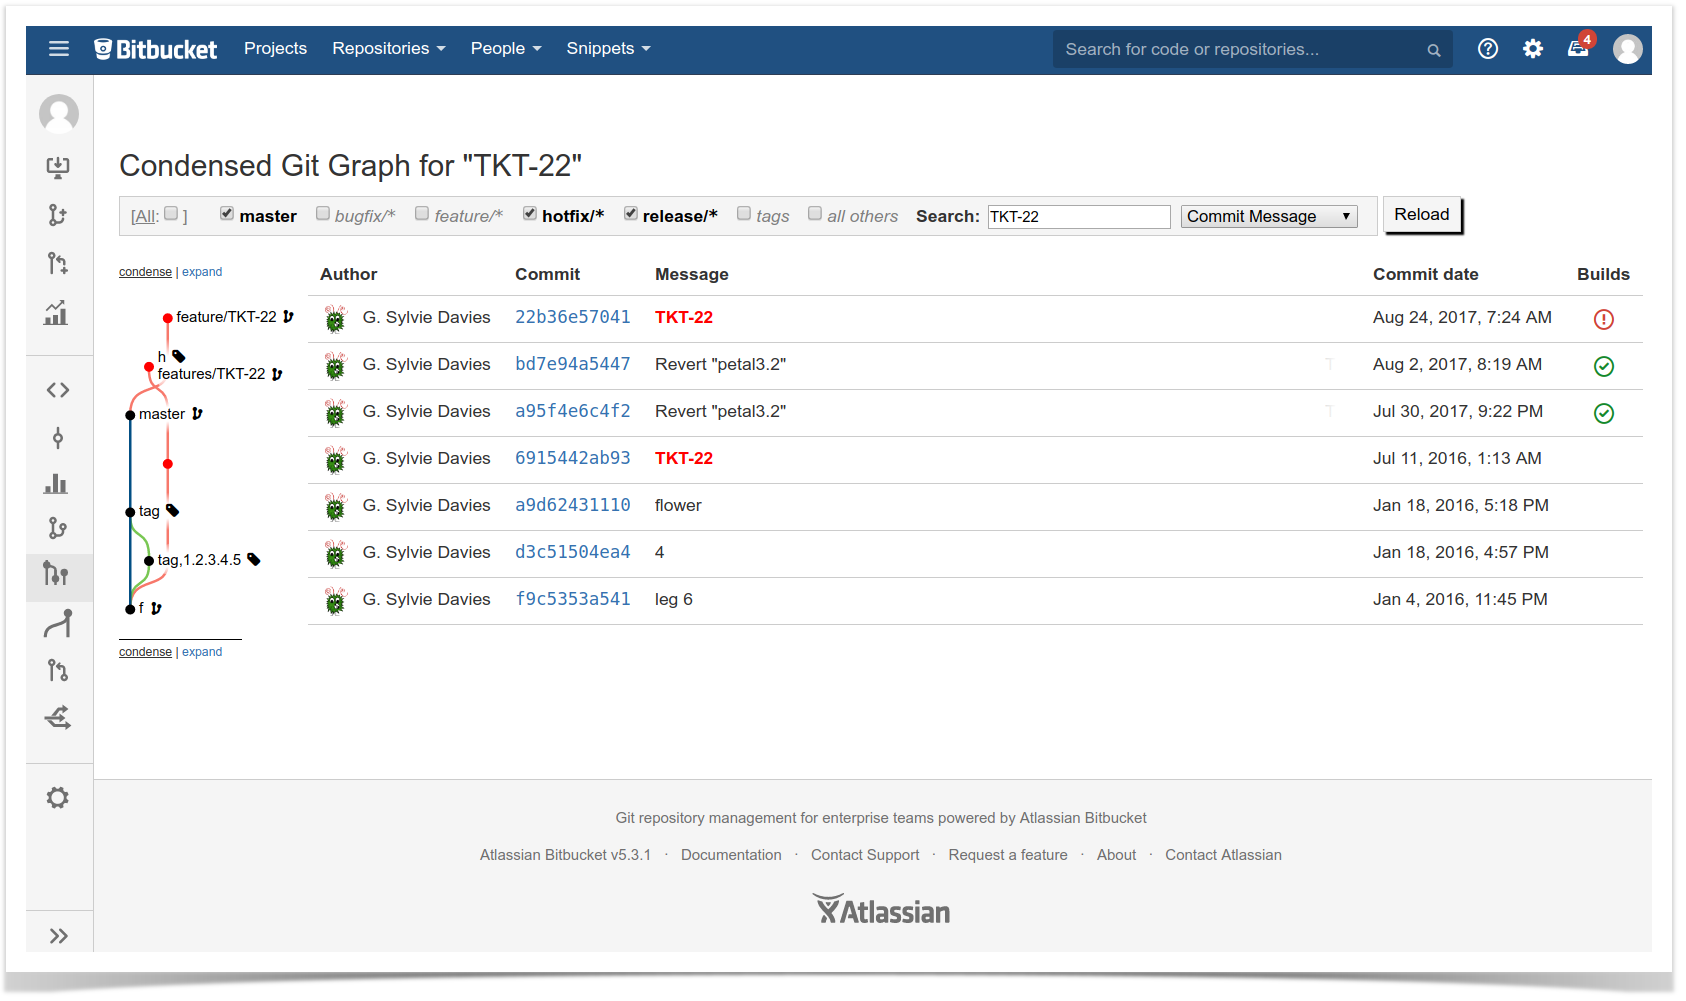
          Commit Graph for Bitbucket Server appeared on the Marketplace in 2016 as a part of the paid PR-Booster app. Now it is an independent free add-on that helps you get a clear overview of commit activity across branches in a nice way so you can identify them quickly. This graph integrated into the Commits page allows your team correctly render octopus merges and orphan branches.

          You can easily filter and search user names, Jira tickets, and more. You will see the results in a condensed git graph.

          This app does not cache, persist, or index any data, works on large Data Center instances and is compatible with all branching strategies.

          Pricing: Commit Graph for Bitbucket Server is free to use.

          SonarCloud

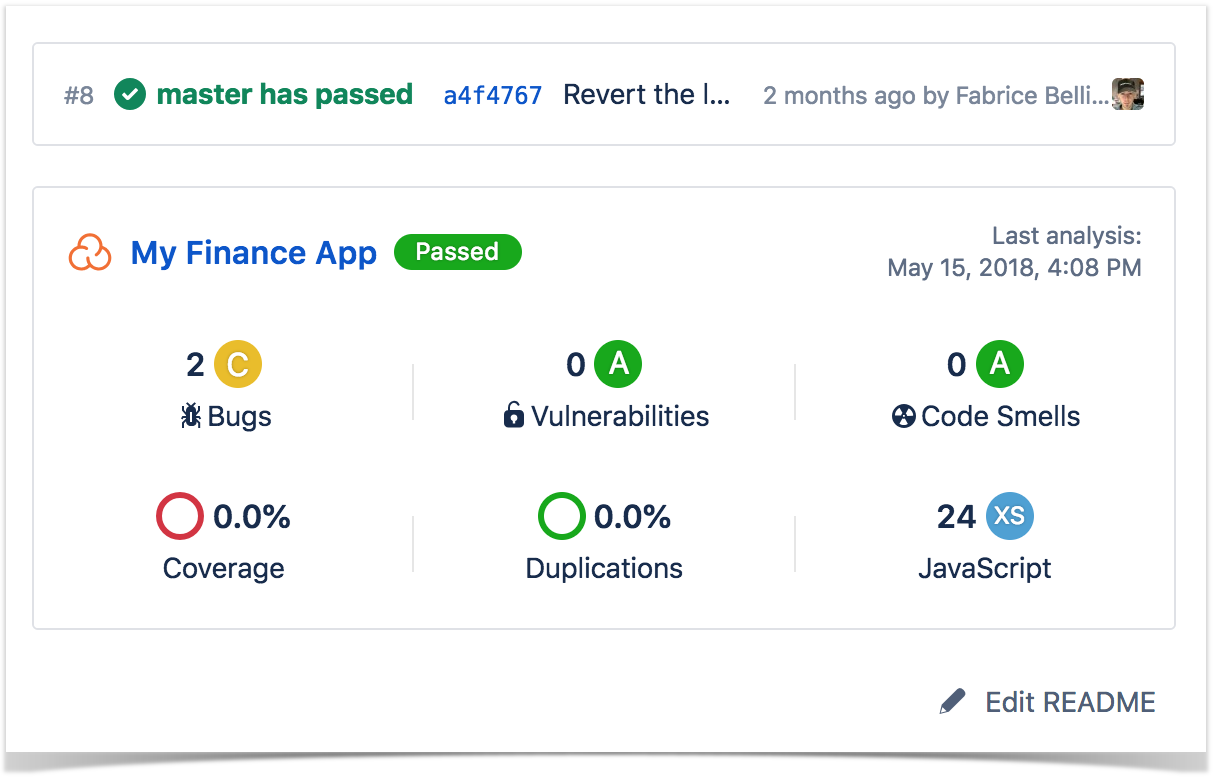
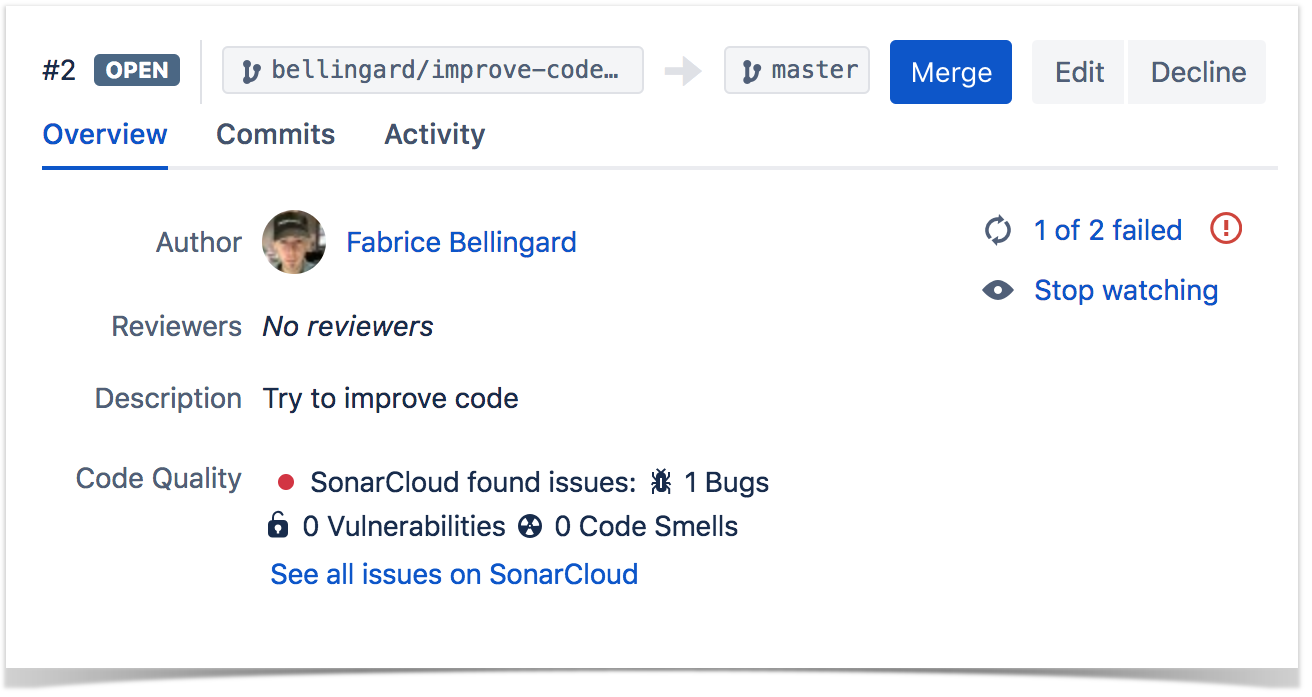
          SonarCloud is a handy tool that helps you analyze your source code detecting the various issues that may influence the code quality. Moreover, this app supports all major programming languages, including Java, JavaScript, TypeScript, C#, C/C++, and more.

          Powerful static code analyzers of the SonarCloud app help you track bugs and quality issues providing you with the overall picture of your code commit by commit. This apps allows you to detect and fix issues before they are merged into the master branch.

          The Sonar Cloud team will offer you a paid plan in case you need to run a private check for the closed source code

          Pricing: SonarCloud is free to use.

          Project Size List for Bitbucket

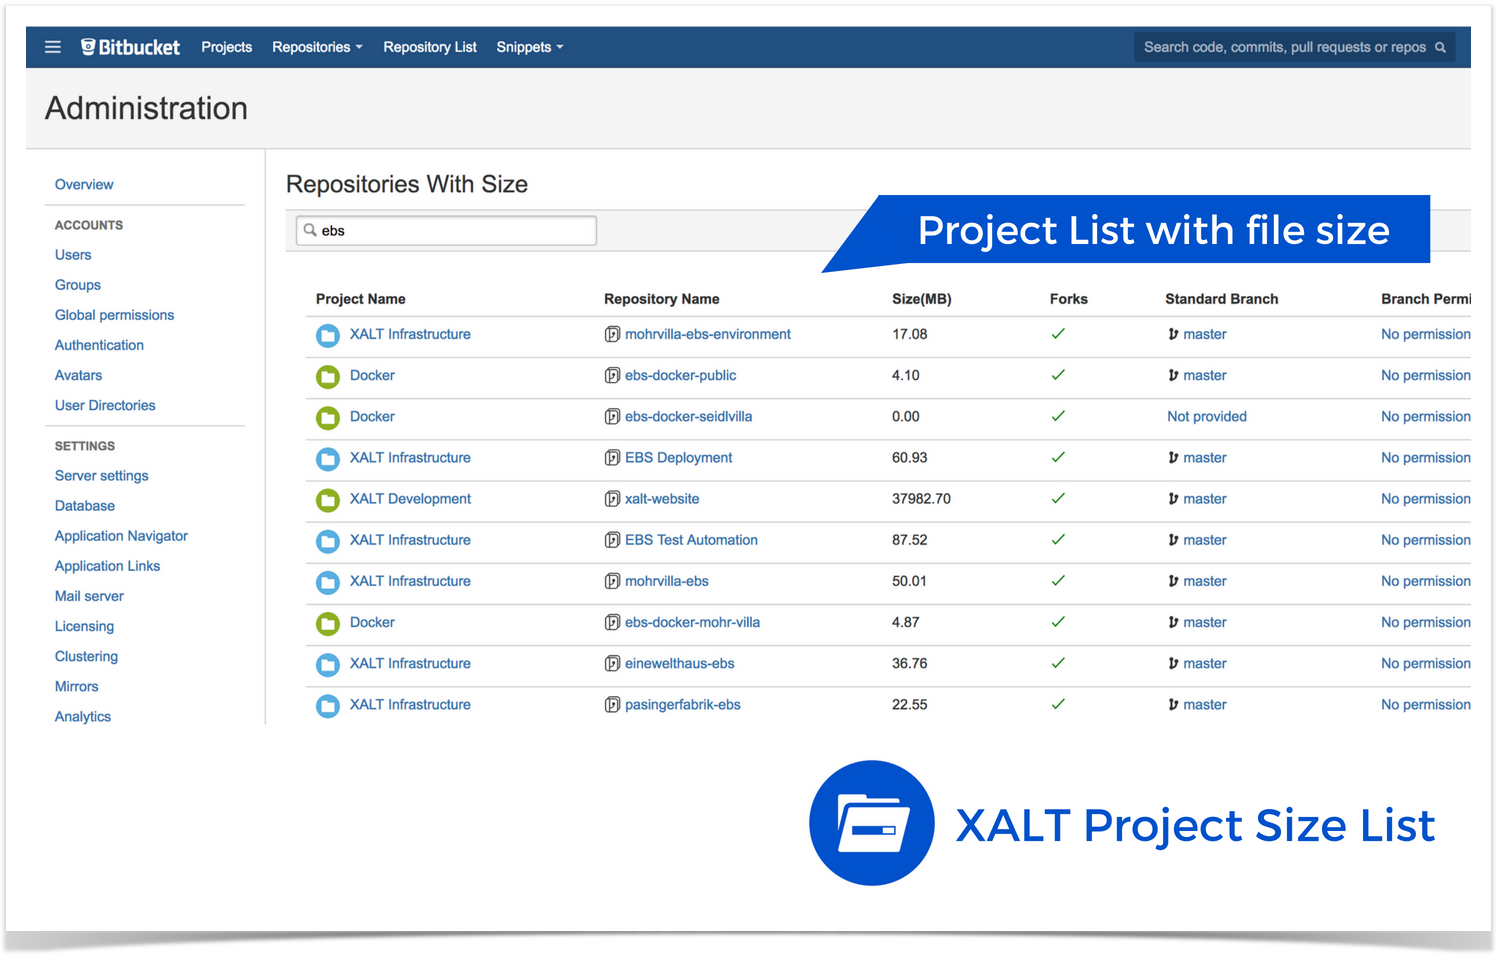
          Project Size List for Bitbucket is a tool that lets developers view all projects with their storage space (MB) used on the hard disk. Now you can sort your projects by size.

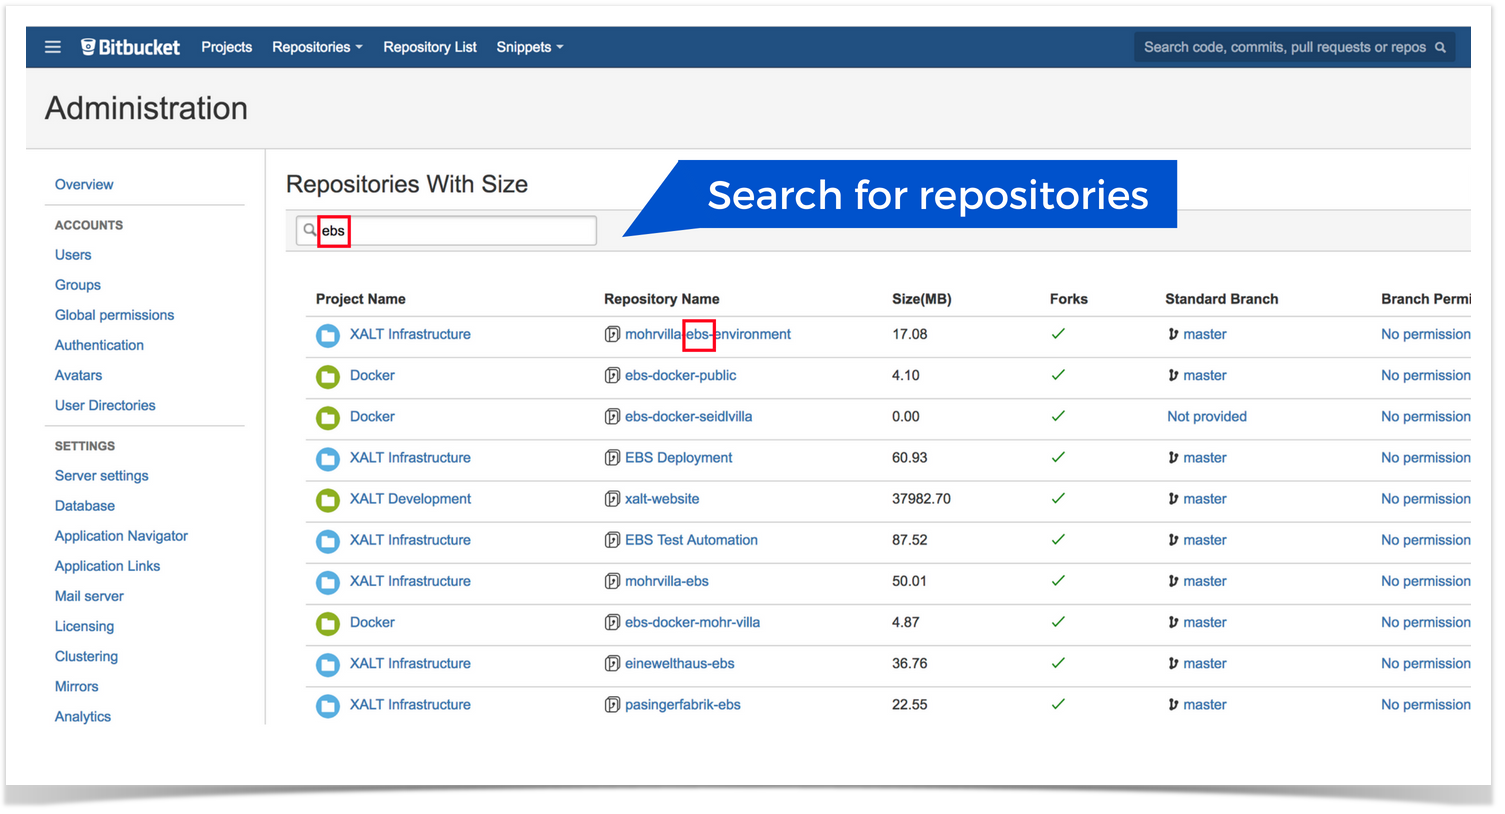
          You can create project tables in Bitbucket to list your repositories and projects including information about their size, forks, branches and branch permissions. This app also helps you search specific projects and repositories.

          If you want to get more information about your projects, for example, pull request and commits metrics, you can try out Awesome Graphs for Bitbucket. This app allows you to quickly evaluate the performance of your team and get the insights into your projects’ history and code quality.

          Pricing: Project Size List for Bitbucket is free to use.

          If you have any questions, feel free to comment on this blog post. Stay tuned and subscribe for email notifications about new posts in our blog – enter your email in the ‘Newsletter’ section on the sidebar.

          Related posts

            New in Awesome Graphs: Analyzing Pull Requests Resolution Time, Monitoring Repository Indexing, and More

            November 1, 2018
            #News#Bitbucket#Analytics
            6 min

            Our app Awesome Graphs for Bitbucket visualizes statistics of commits, pull requests, and lines of code helping to monitor and analyze code development and code review.
            During the past year we’ve added new great features and made significant improvements. Let us tell you how you can benefit from them.

            Pull requests’ resolution time distribution

            We’ve created a new pull requests report – Resolution Time Distribution.

            This report helps you to answer such questions:

            • How long does it usually takes to resolve pull requests?
            • Are there more pull requests with a long or short resolution time?
            • What is an expected resolution time for future pull requests?
            • What pull requests of the period had the shortest/longest resolution times?
            • How long it took to resolve a particular pull request?

            Resolution time distribution report

            In the report you will see pull requests grouped by time taken to resolve them (merge or decline).

            You will see median, 25 and 75 percentile of pull requests’ resolution time. This data can help you to estimate resolution time of future pull requests.

            For any time interval (blue bar on the chart) you will be able to see a list of all pull requests with their resolution time and reviewers. For more detailed analysis you can easily switch to a particular pull request to see code changes and discussion during review.

            List of pull requests in Resolution time distribution report

            Learn more about this report

            Admin tools for monitoring repository indexing

            We’ve created powerful tools helping to administer Awesome Graphs. These tools are helpful when monitoring Awesome Graphs performance during repository indexing and troubleshooting app related issues.

            JMX Metrics

            Performance of Awesome Graphs can be monitored via JMX. It provides administrators with the way to understand what is happening in the app. You can estimate how much time repository indexing will take, see if there are any issues while indexing repositories or refs, monitor resource consumption.

            JMX metrics of Awesome Graphs

            More information in logs

            Awesome Graphs creates comprehensive logs. It helps to easily investigate app related issues.

            In Bitbucket UI and in support zip admins can see information about data indexed by Awesome Graphs:

            • total number of indexed contributors
            • total number of indexed commits
            • number of repositories in indexing queue

            Detailed information about repository indexing is recorded in awesome-graphs.log file located in the Bitbucket home directory.

            Alerts to admins

            If a repository could not be indexed admins will get a notification via Bitbucket alerts. It helps to quickly detect and solve problems.

            Alert to admins in Bitbucket

            Learn more about administering Awesome Graphs

            Improved performance

            We’ve significantly improved performance of Awesome Graphs during repository indexing:

            • Commit data are indexed in batches to decrease memory usage.
            • While indexing forks only unique commits are stored in the database. If the same commit exists both in a fork and an original repository, it is not duplicated. This change helps to improve performance and reduce database size. For one of our customers with 10.000+ repositories the size of the table was reduced by four times.
            • Awesome Graphs uses adaptive throttling. With it Bitbucket examines the total physical memory on the machine and determines a maximum ticket number that the machine can safely support. This approach improves the system performance during repository indexing. Learn more about adaptive throttling.

            We are always happy to receive feedback from customers. Feel free to contact us if you have any questions or would like to suggest new features.

            Awesome Graphs has become more awesome. Try this app for free

            Related posts