How to Export Commit and Pull Request Data from Bitbucket to CSV
Being a universal file type, CSV serves as a go-to format for integrations between applications. It allows for transferring a large amount of data across the systems, blending it, and building custom reports. To export commit and pull request data from Bitbucket Data Center to a CSV file, you can use the Awesome Graphs for Bitbucket app.
In this article, we’ll show you two ways how to use the app to export engineering data to CSV for further integration, organization, and processing in analytics tools and custom solutions.
Awesome Graphs is an app for Bitbucket that helps development teams leverage engineering reporting. Trusted by companies like Apple and Mastercard, it offers REST API and CSV data export for custom automated solutions as well as an array of built-in reporting options for quality insights in one click.
What commit and pull request data you will get
The methods described later in the article will give you two kinds of generated CSV files, depending on whether you export data about commits or PRs.
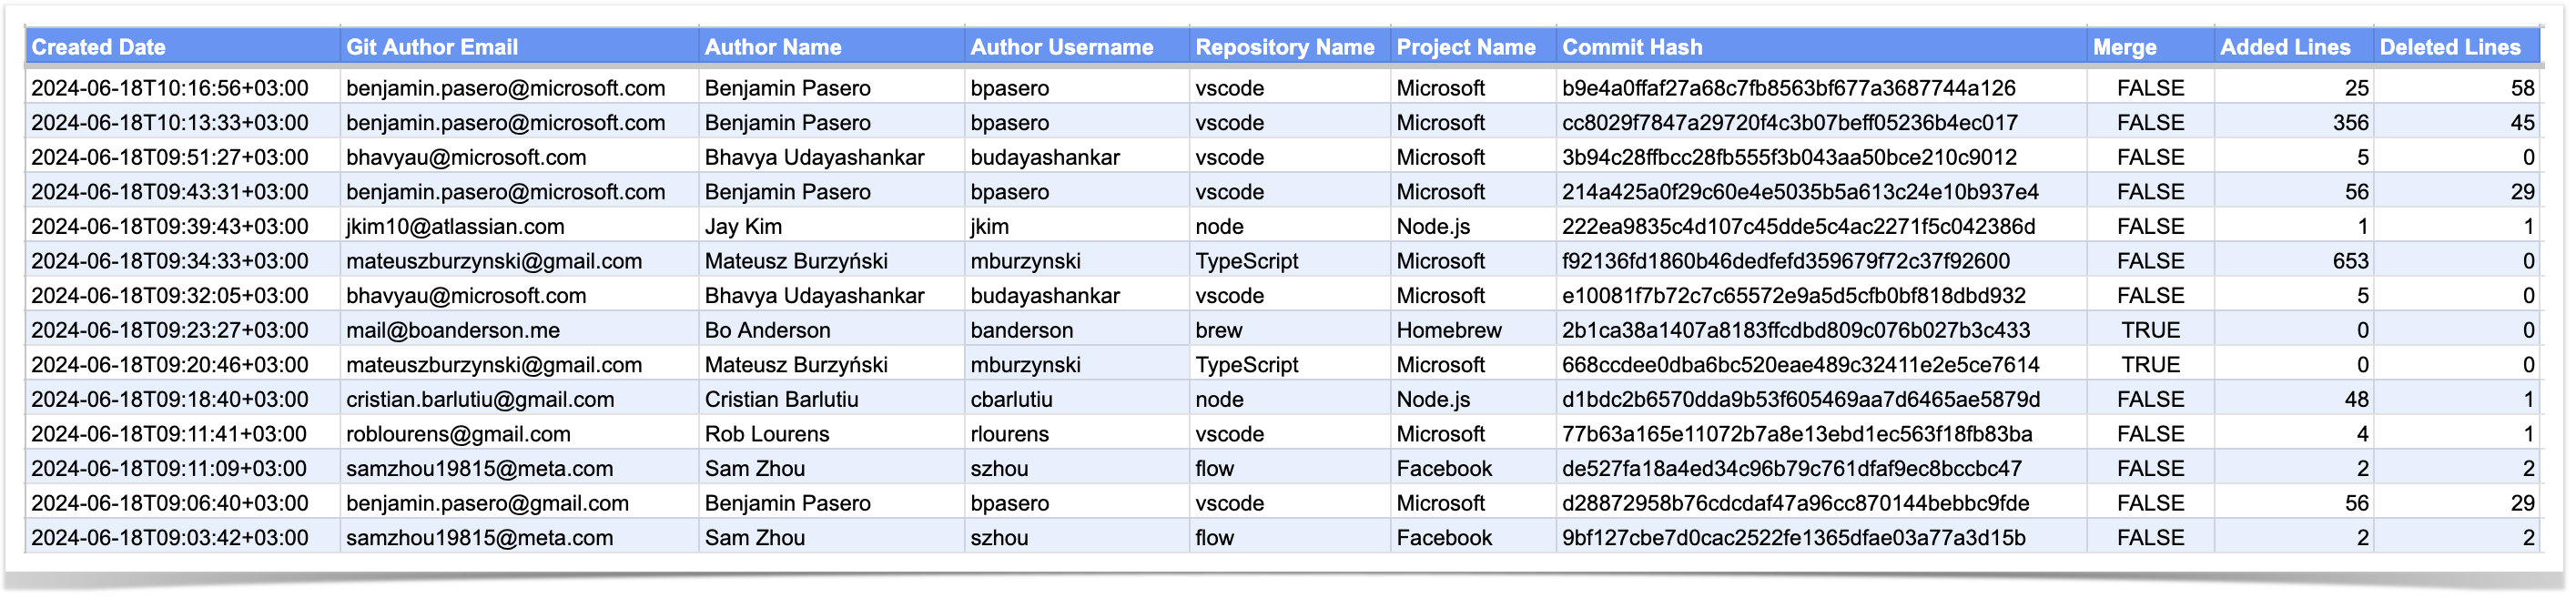
In the case of commit data, you’ll get a list of commits with the following details:
- creation date
- author’s email, name, and username
- repository and project name
- commit hash
- whether it is a merge commit or not
- number of lines of code added and deleted
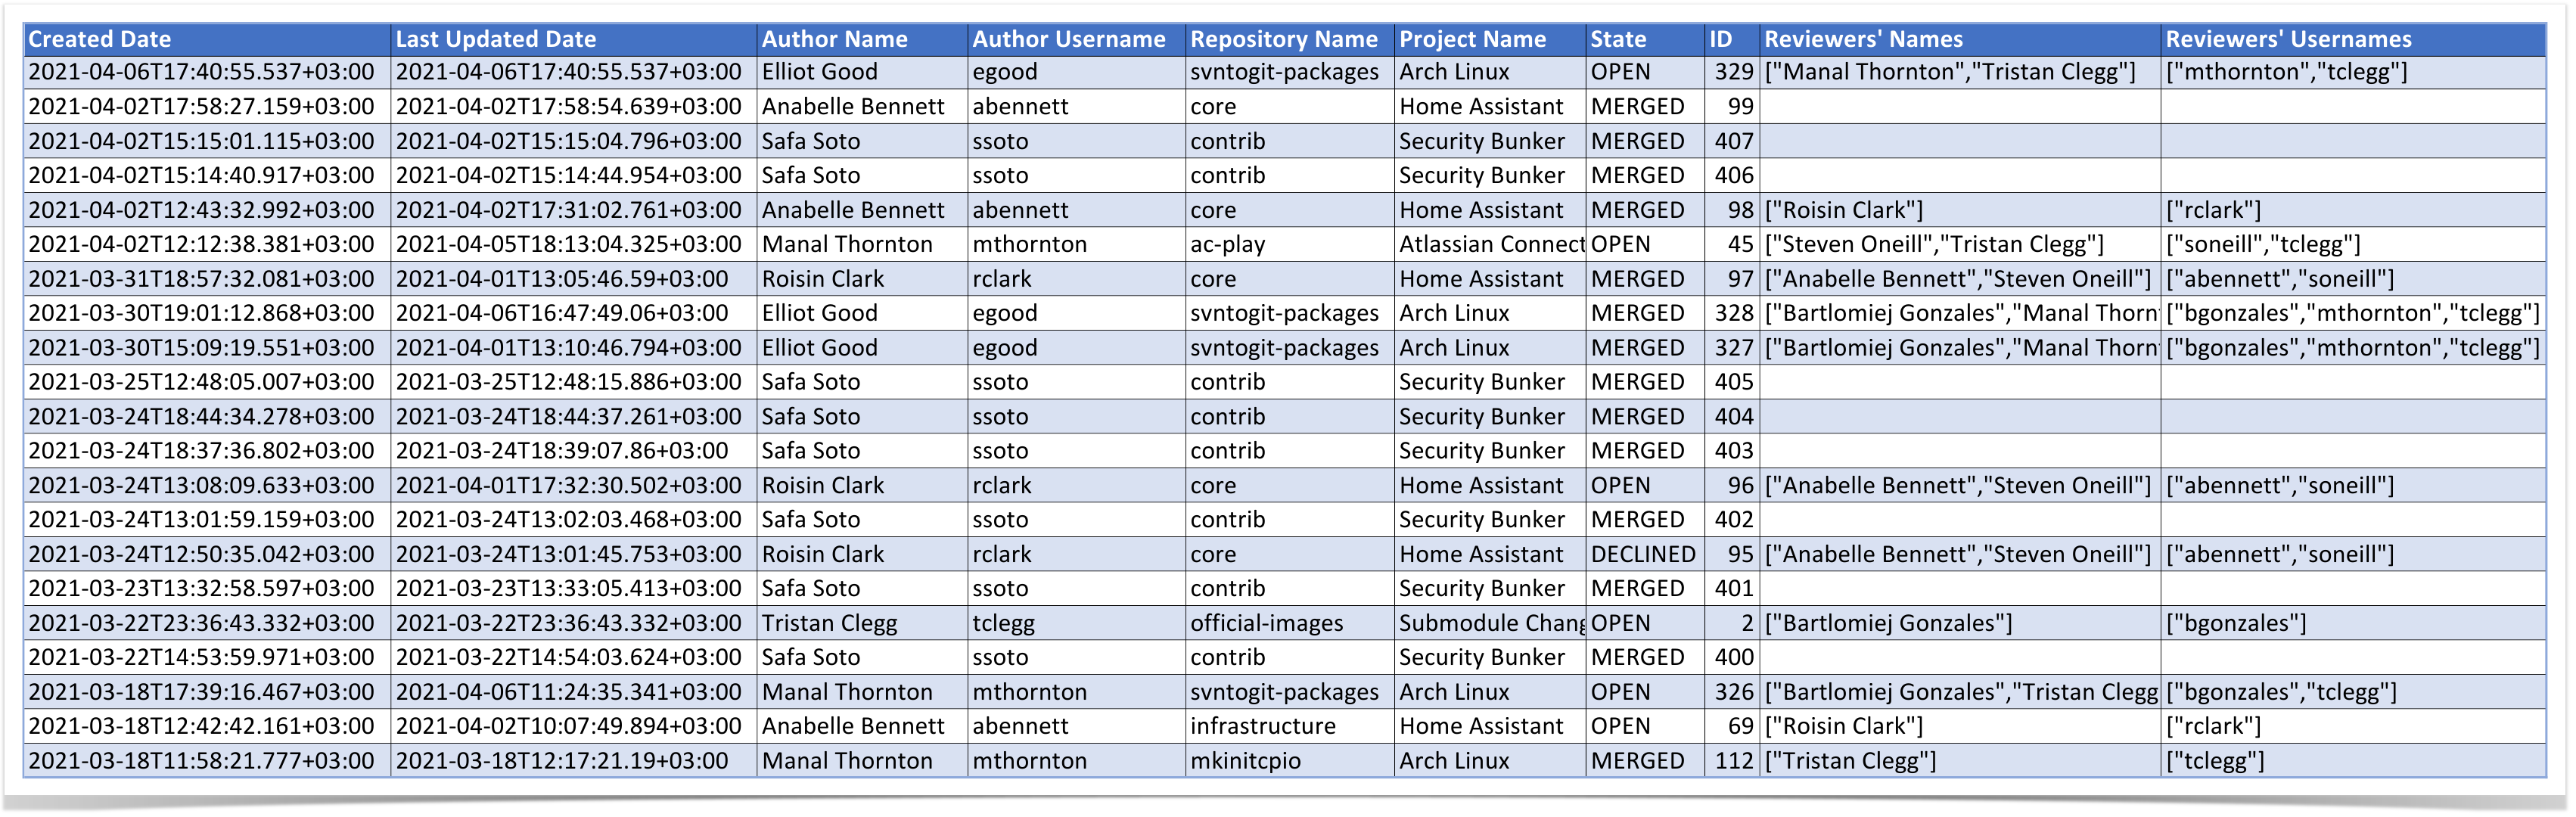
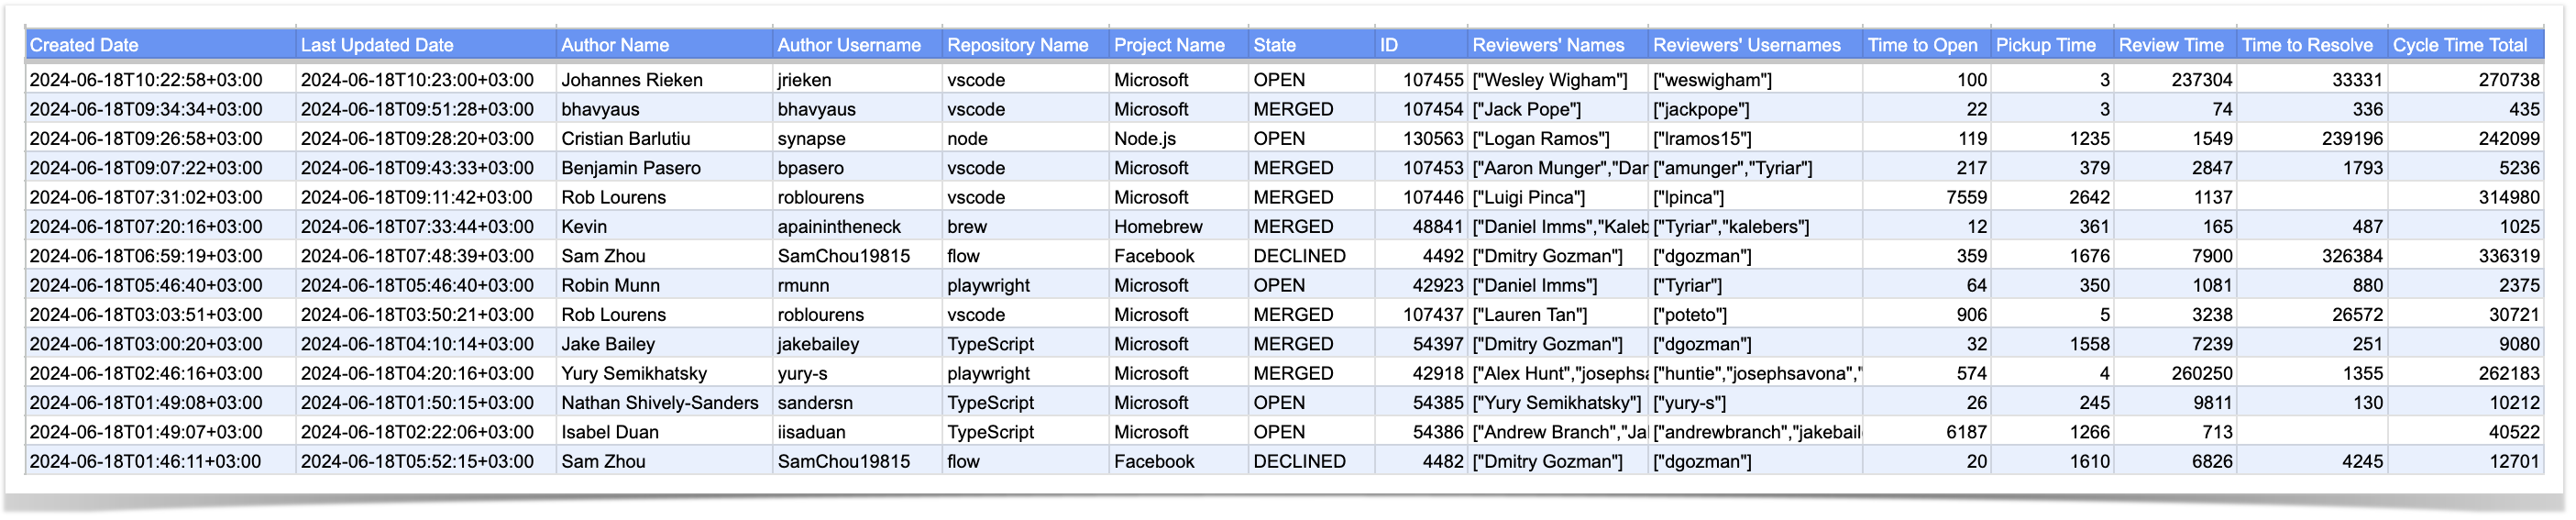
The resulting CSV with a list of pull requests will contain the following information:
- pull request creation and last updated date
- author’s name and username
- repository and project name
- PR state and its ID
- reviewers’ names and usernames
- PR cycle time and its phases: time to open, pickup time, review time, time to resolve
Exporting from the People page
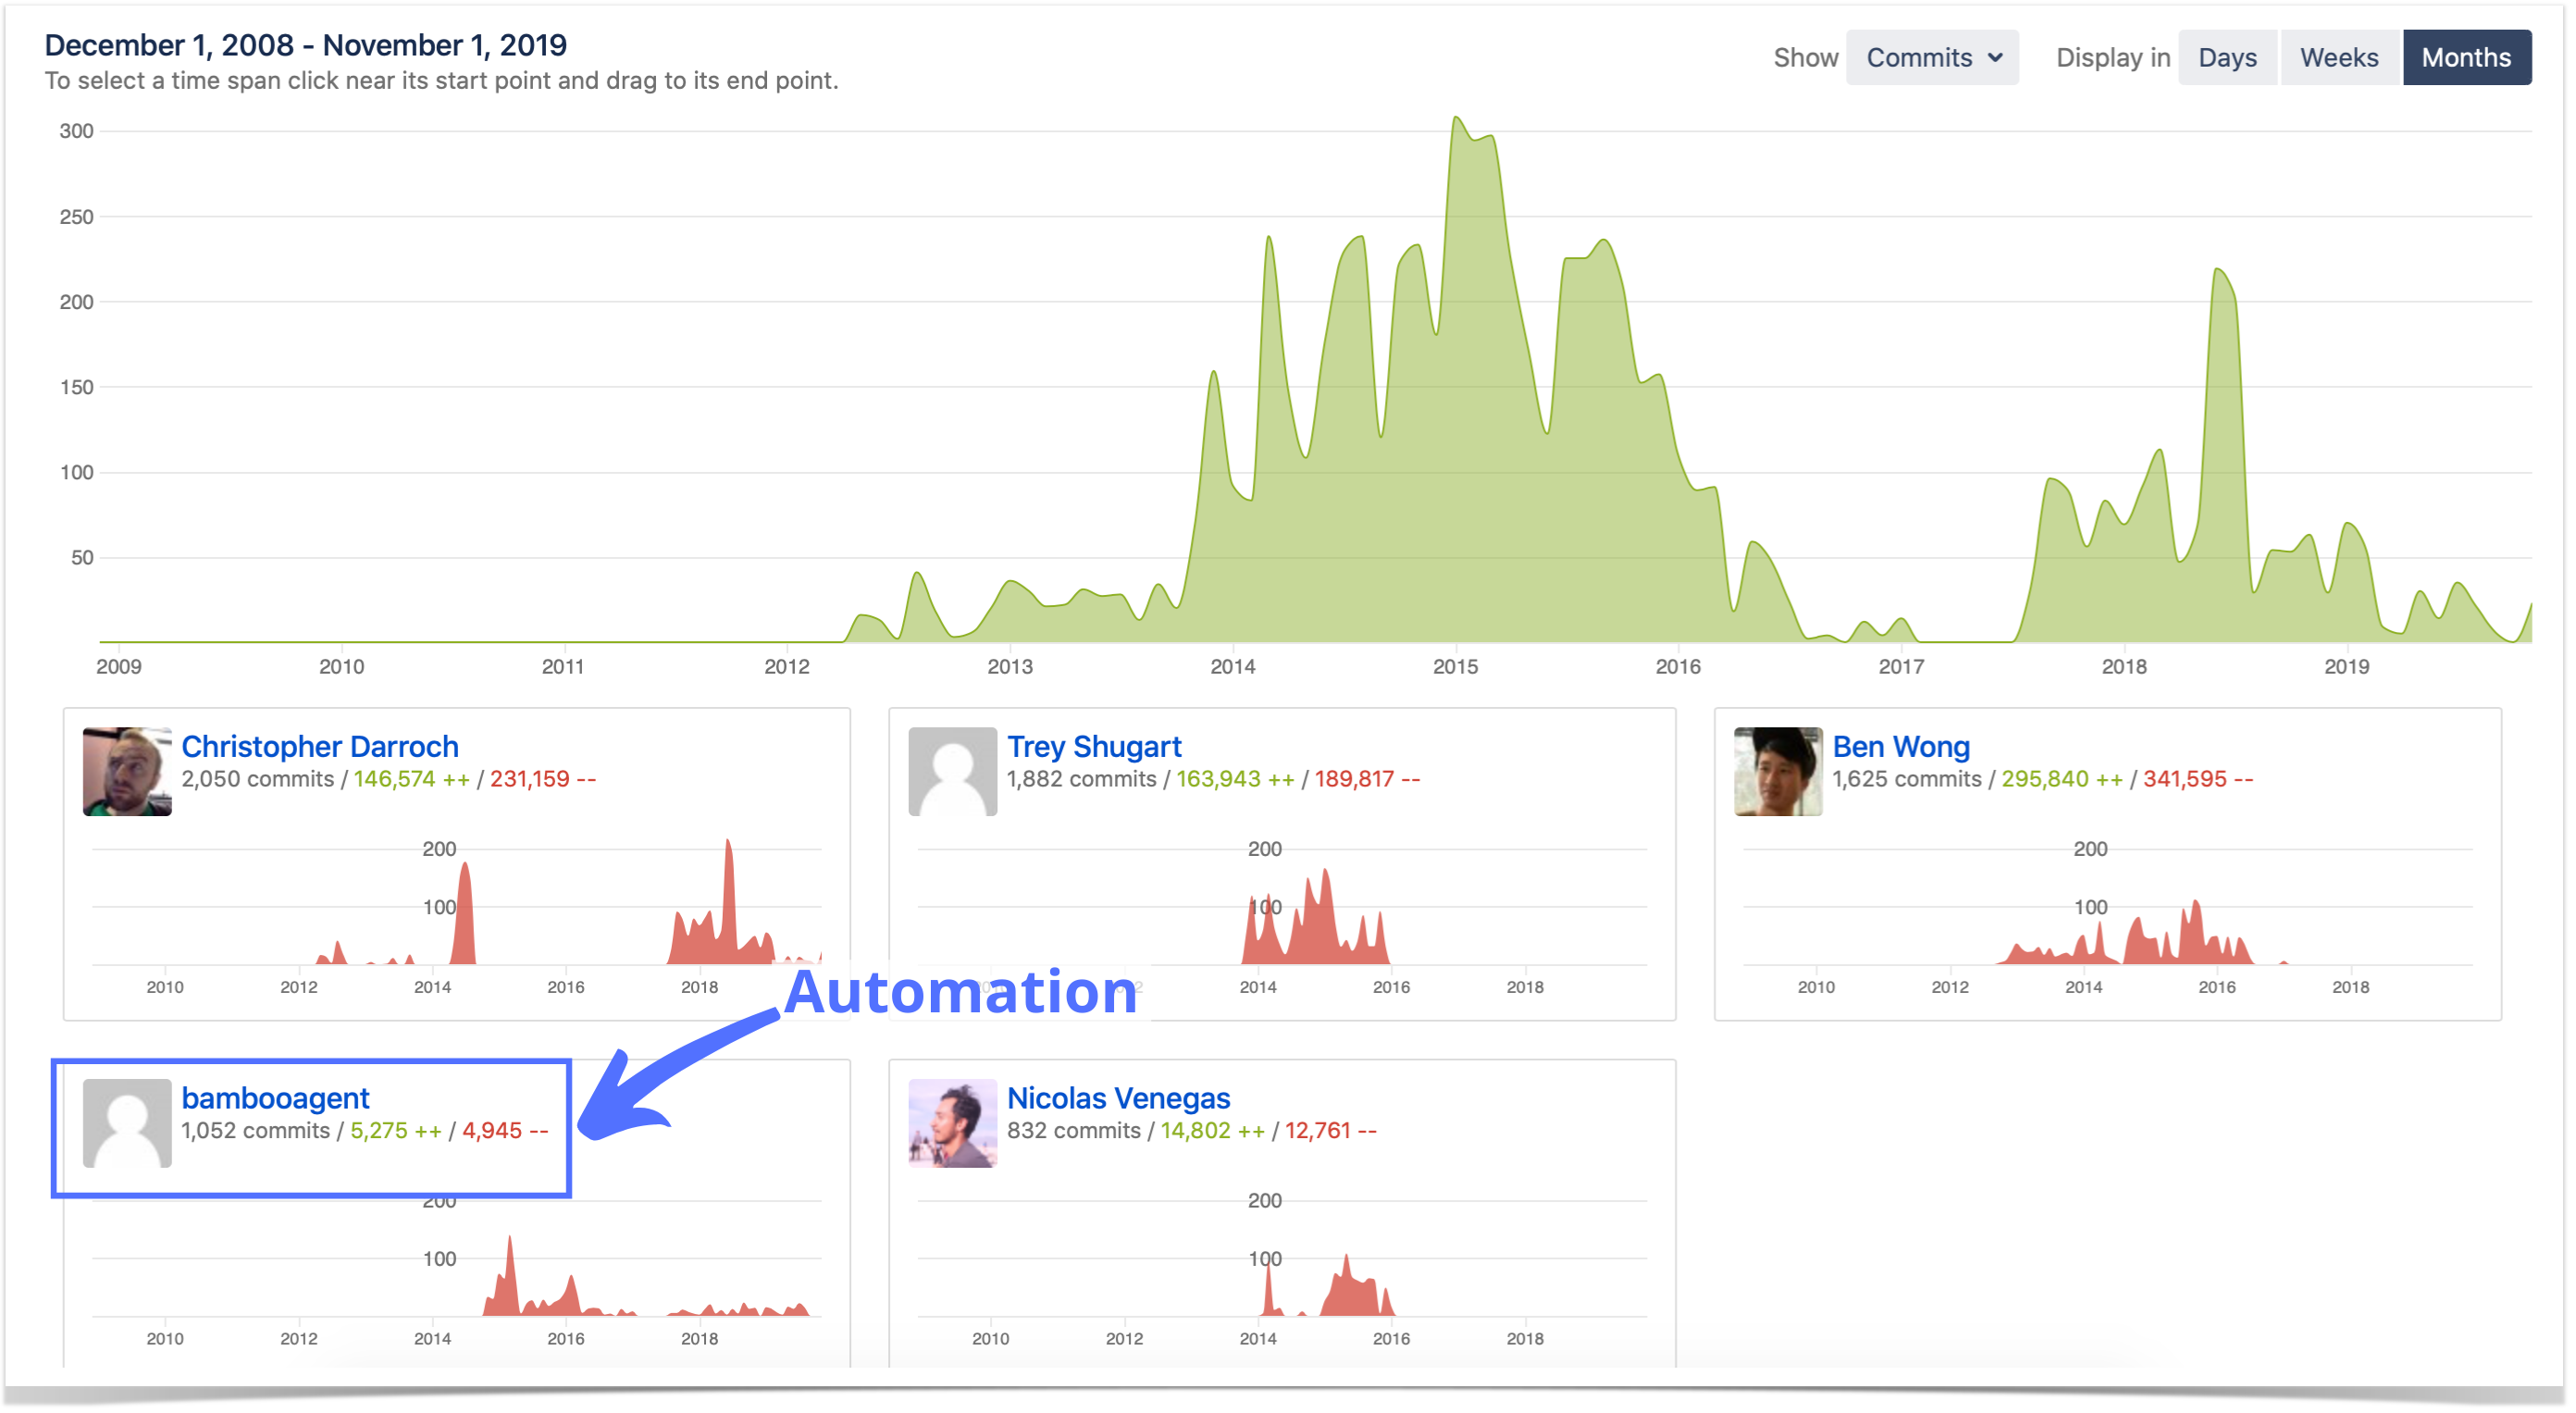
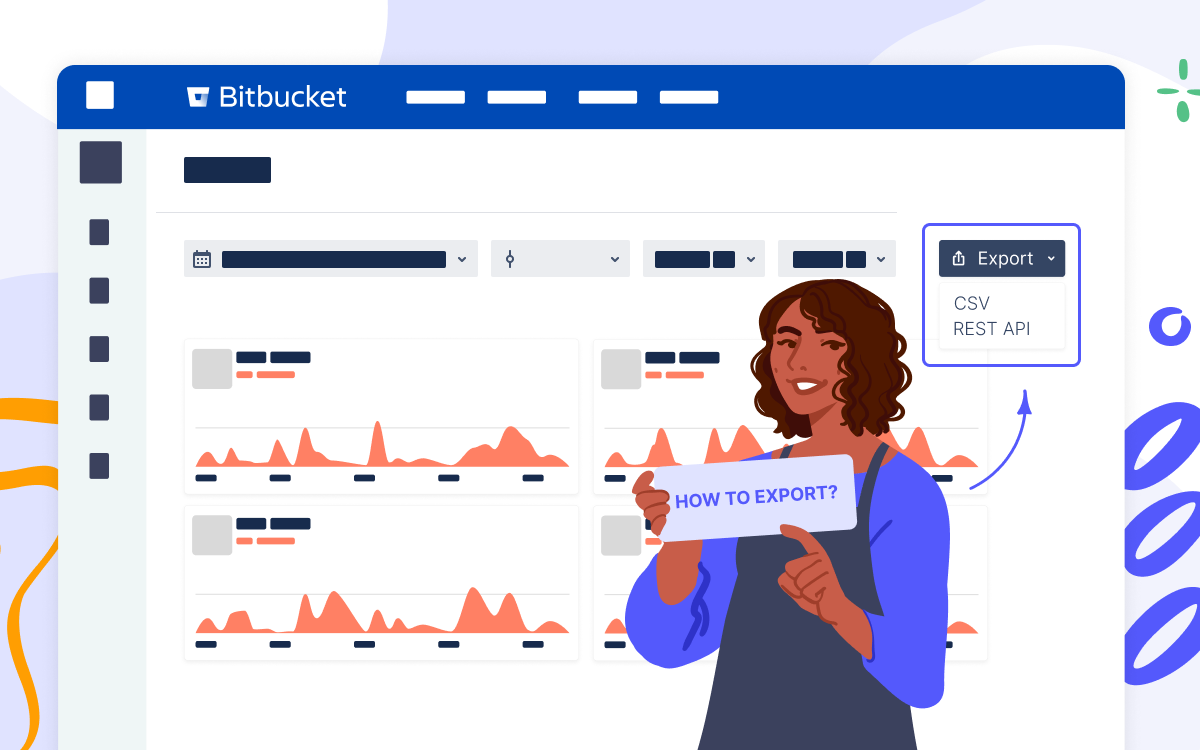
You can export raw commit and pull request data to CSV directly from Bitbucket. When you click All users in the People dropdown menu at the header, you’ll get to the People page with a global overview of developers’ activity based on the number of commits or pull requests.
At the top-right corner, you’ll notice the Export menu, where you can choose CSV.
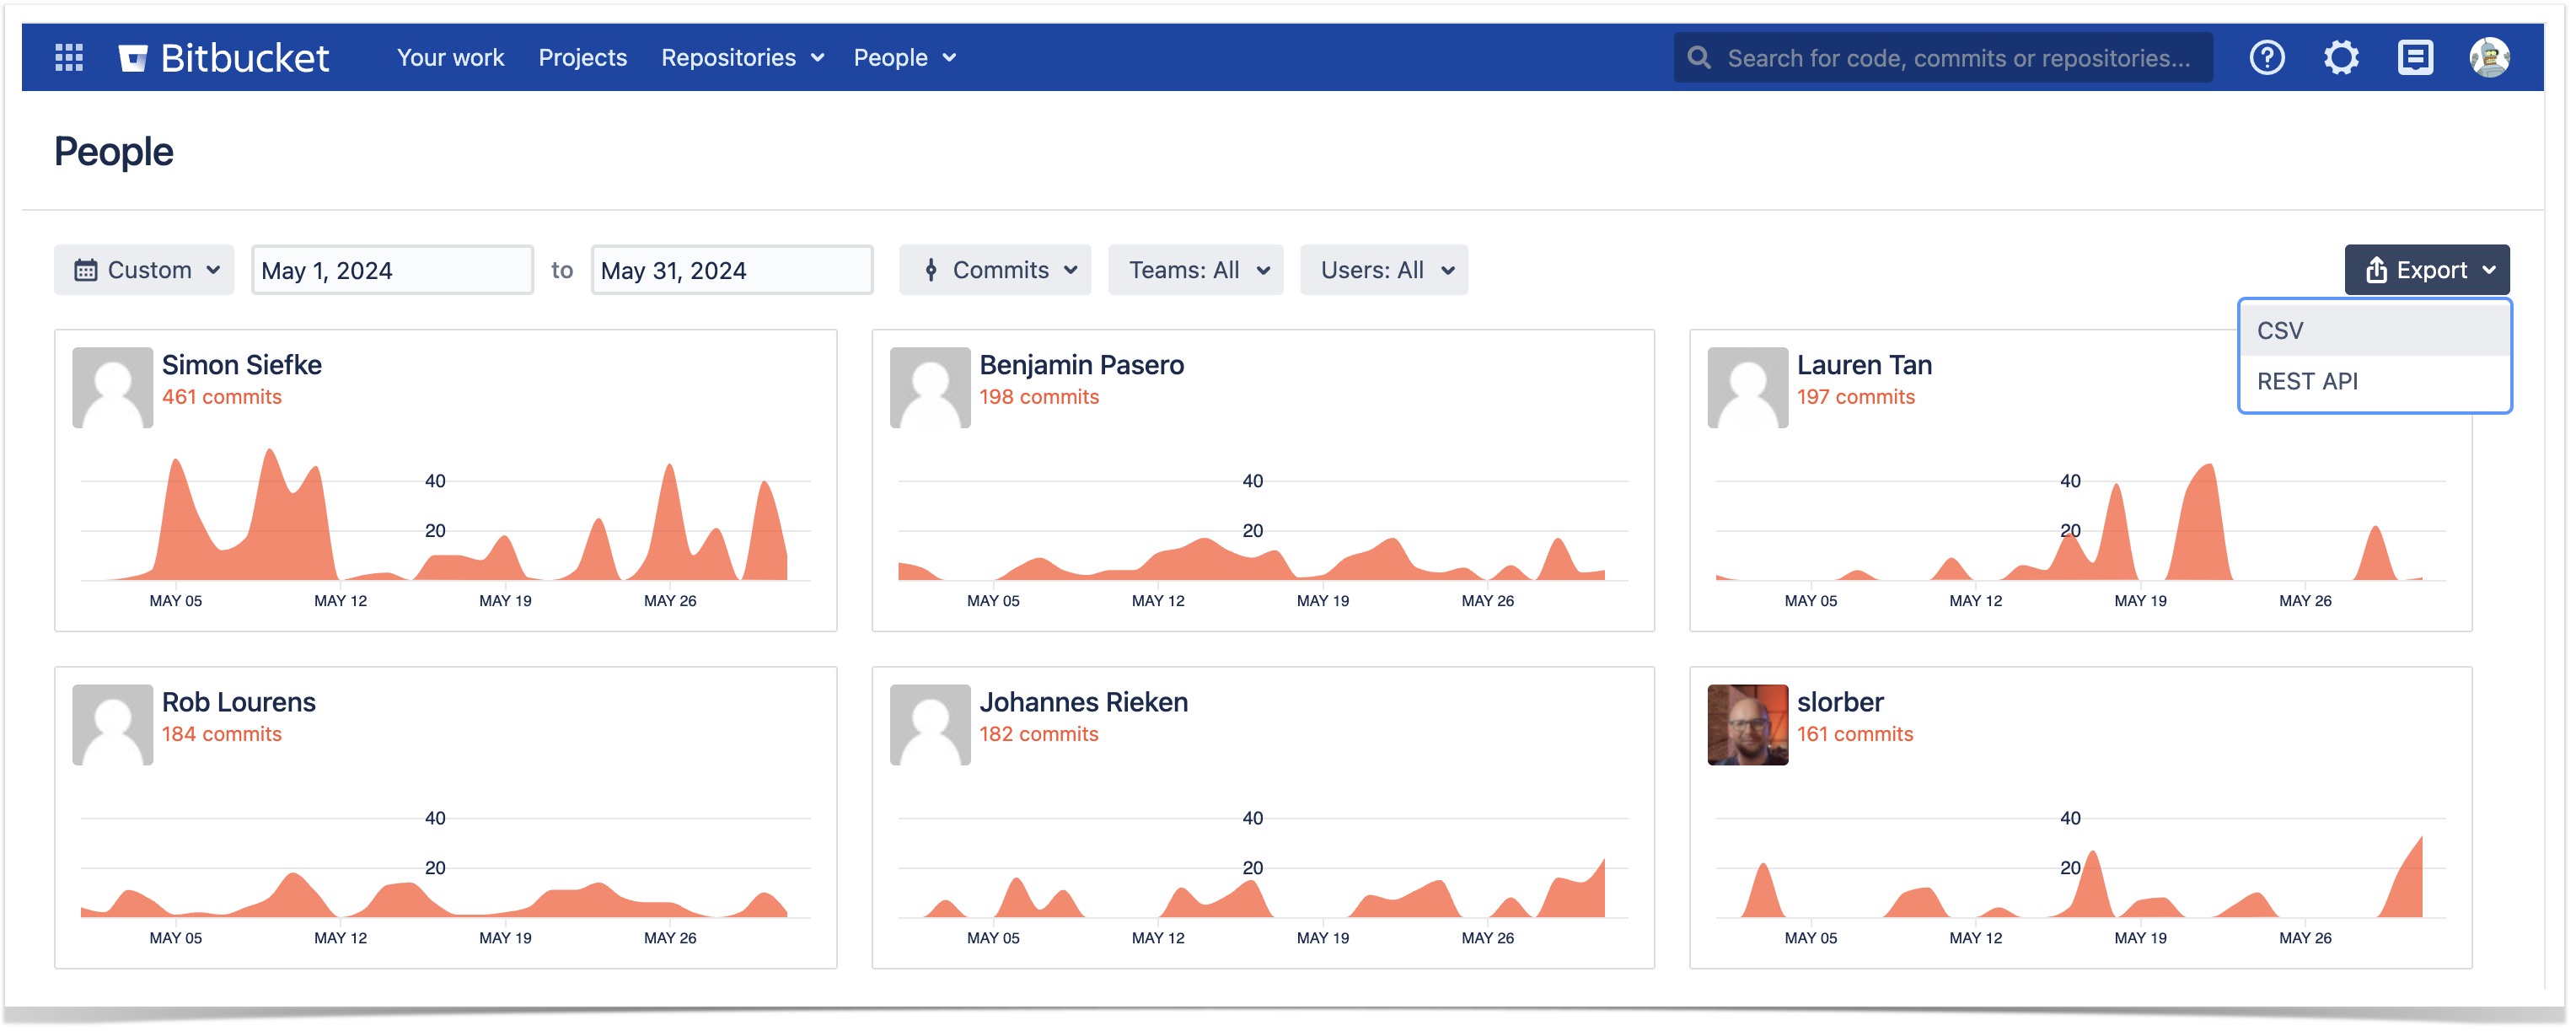
By default, the page shows developers’ contributions made within a month, but you can choose a longer period up to a quarter. The filtering applies not only to the GUI but also to the data exported, so if you don’t change the timespan, you’ll get a list of commits or pull requests for the last 30 days.
Exporting via the REST API resources
Awesome Graphs REST API allows you to retrieve and export commit and pull request data to a CSV file on global, project, repository, and user levels. This functionality is aimed to automate the processes you used to handle manually and streamline the existing workflows.
To find the REST API resources, you can go to the in-app documentation by choosing Export → REST API on the People page (accessible to Awesome Graphs’ users), or to our documentation website.
In the article, we’ll show you two examples of the resources and how they work: one for exporting commits and another for pull requests. The rest of the resources follow the same model, so you can apply these principles to get the data you need.
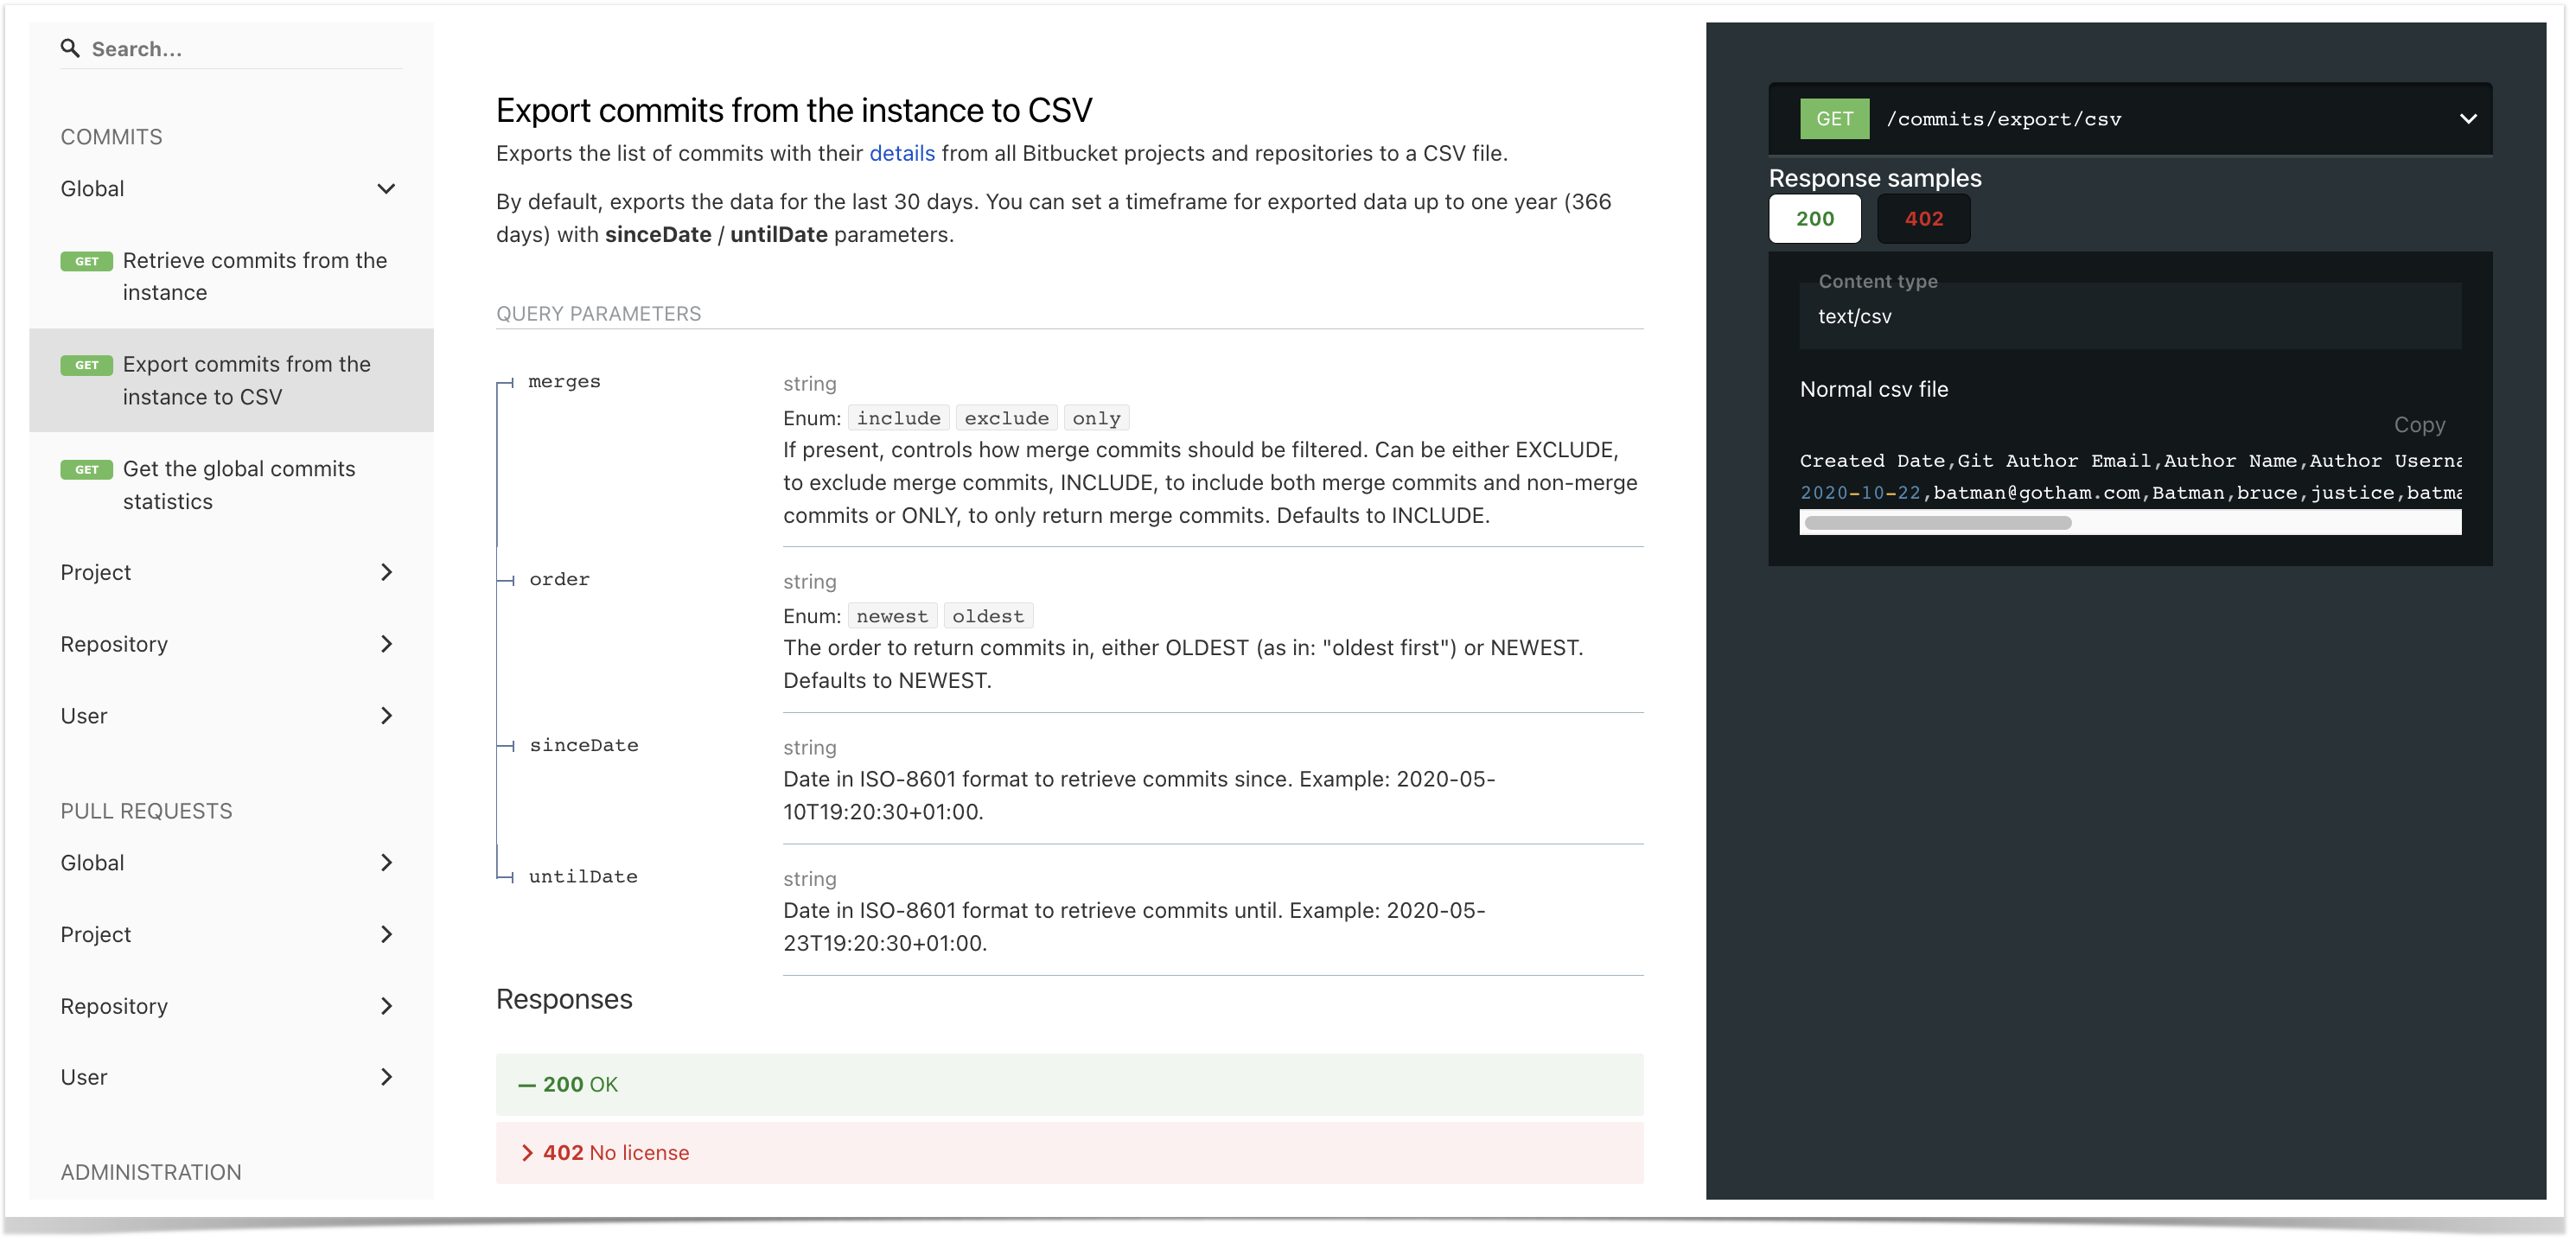
Export commits to CSV
This resource exports a list of commits with their details from all Bitbucket projects and repositories to a CSV file.
Here is the curl request example:
curl -X GET -u username:password "https://bitbucket.your-company-name.com/rest/awesome-graphs-api/latest/commits/export/csv"
Alternatively, you can use any REST API client like Postman or put the URL directly into your browser’s address bar (you need to be authenticated in Bitbucket in this browser), and you’ll get a generated CSV file.
By default, it exports the data for the last 30 days. However, you can set a timeframe for exported data up to one year (366 days) with sinceDate / untilDate parameters:
curl -X GET -u username:password "https://bitbucket.your-company-name.com/rest/awesome-graphs-api/latest/commits/export/csv?sinceDate=2024-05-01&untilDate=2024-05-15"
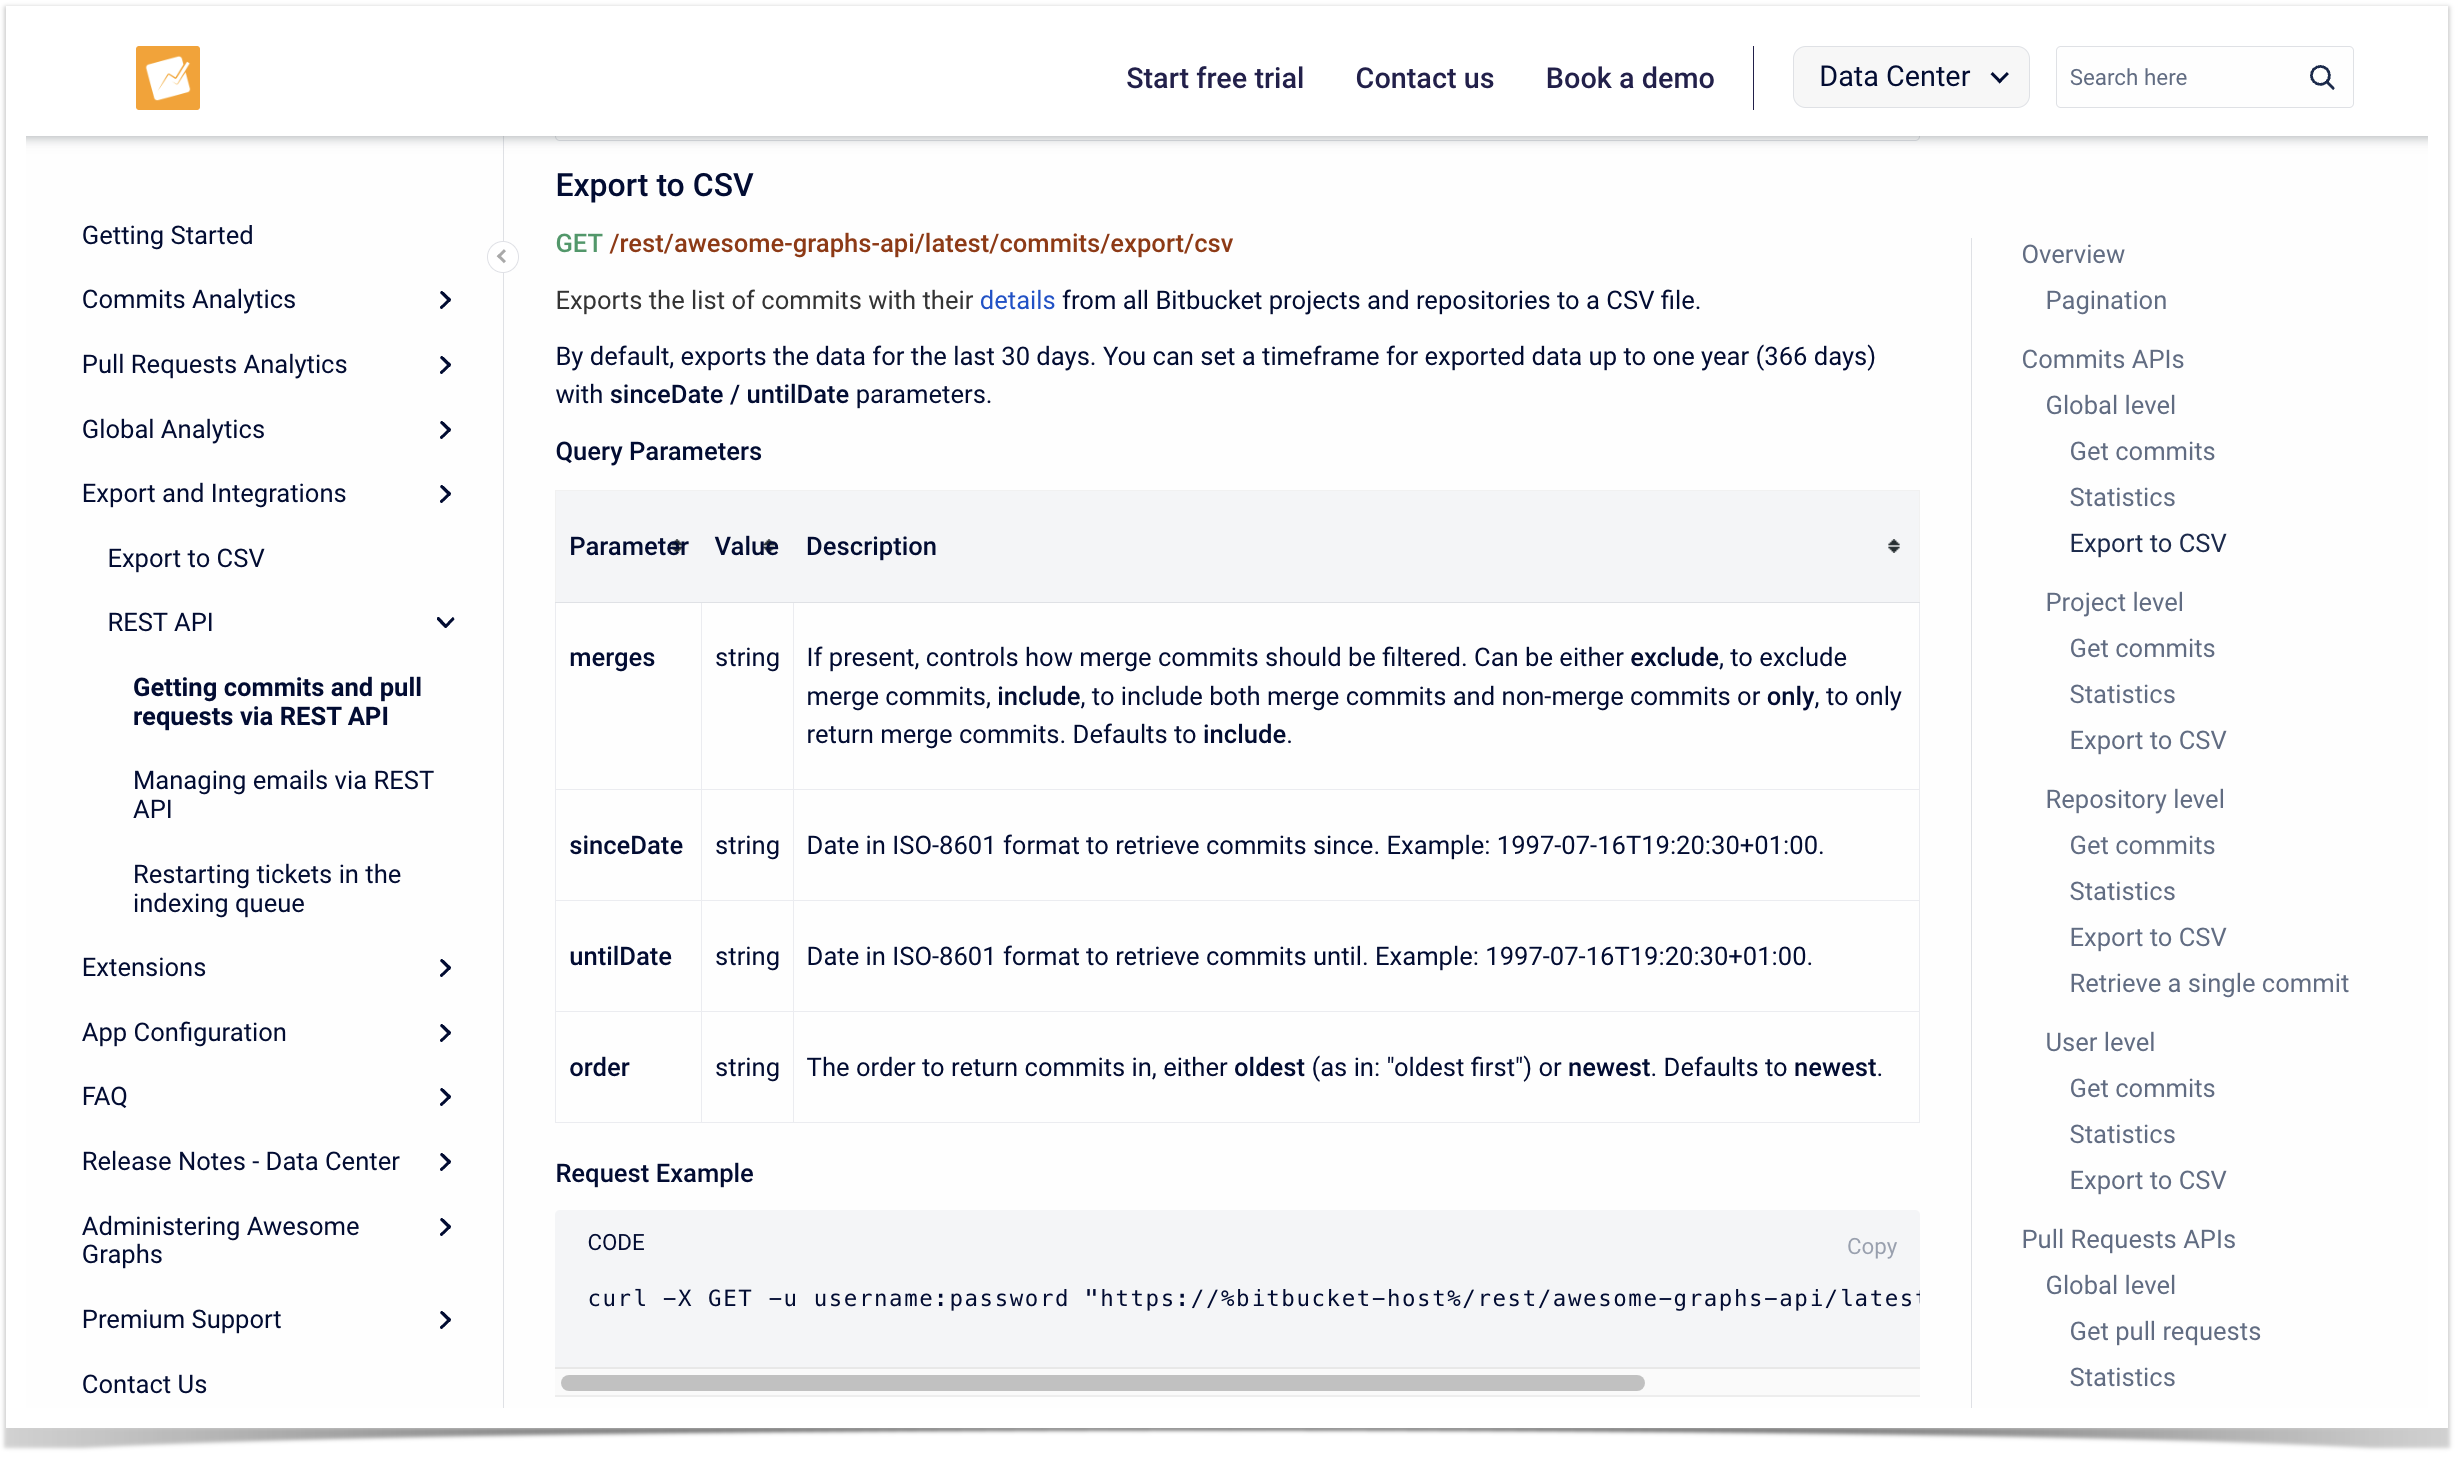
For commit resources, you can also use the query parameters such as merges to filter merge/non-merge commits or order to specify the order to return commits in.
You can read more about this resource and its parameters in our documentation, as well as find other resources for exporting commit data on project, repository, and user levels.
Export pull requests to CSV
The pull request resources work similarly, so to export a list of pull requests with their details from all Bitbucket projects and repositories to a CSV file, you need to make the following curl request:
curl -X GET -u username:password "https://bitbucket.your-company-name.com/rest/awesome-graphs-api/latest/pull-requests/export/csv"
The sinceDate / untilDate parameters can also be applied to state the timespan up to a year, but here you have an additional parameter dateType, allowing you to choose either the creation date or the date of the last update as a filtering criterion. So, if you set dateType to created, only the pull requests created during the stated period will be returned, while dateType set to updated will include the pull requests that were updated within the time frame.
Another pull request specific parameter is state, which allows you to filter the response to only include open, merged, or declined pull requests.
For example, the following request will return a list of open pull requests, which were updated between May 1st and May 15th:
curl -X GET -u username:password "https://bitbucket.your-company-name.com/rest/awesome-graphs-api/latest/commits/export/csv?dateType=updated&state=open&sinceDate=2024-05-01&untilDate=2024-05-15"
Refer to our documentation for more details about this resource and its parameters. Additionally, you can find information on other resources for exporting pull request data at the project, repository, and user levels.
Integrate intelligently
While many systems support CSV, it is not the only way for software integrations the Awesome Graphs for Bitbucket app offers. Using REST API, you can automate the workflow for custom reporting, eliminating manual work. Let us know what other integrations you are interested in to ensure that our further improvement efforts align with your needs.