







Formulas in Confluence Tables: What You Can and Can’t Do (and How to Fix the Gap)

If you’ve ever tried to put mathematical formulas in Confluence tables, you know that there’s no rendering, no summations, no fractions, just characters. You type something like \sum_{i=1}^{n} i, and it stays as plain text.
This article explains exactly what Confluence tables support natively, where the limitations are, and what tools close the gap based on how teams actually work with numerical data in Confluence.
What Confluence tables can do natively
Confluence’s built-in tables are designed for structured text and data. Out of the box, you can:
- Use basic formatting — bold, italic, underline text, inline code within cells
- Paste content — including text, bullet lists, links, or inline macros
- Merge cells — for grouped headers or spanning rows
That covers a lot of everyday documentation needs: comparison tables, decision matrices, feature lists, project trackers.
What they can’t do is render mathematical notation. A fraction renders as a/b. A summation is SUM(x). A matrix is a pile of numbers with no structure. The moment your table contains anything more complex than a simple ratio, you’re working against the tool.
What Table Filter, Charts & Spreadsheets for Confluence adds
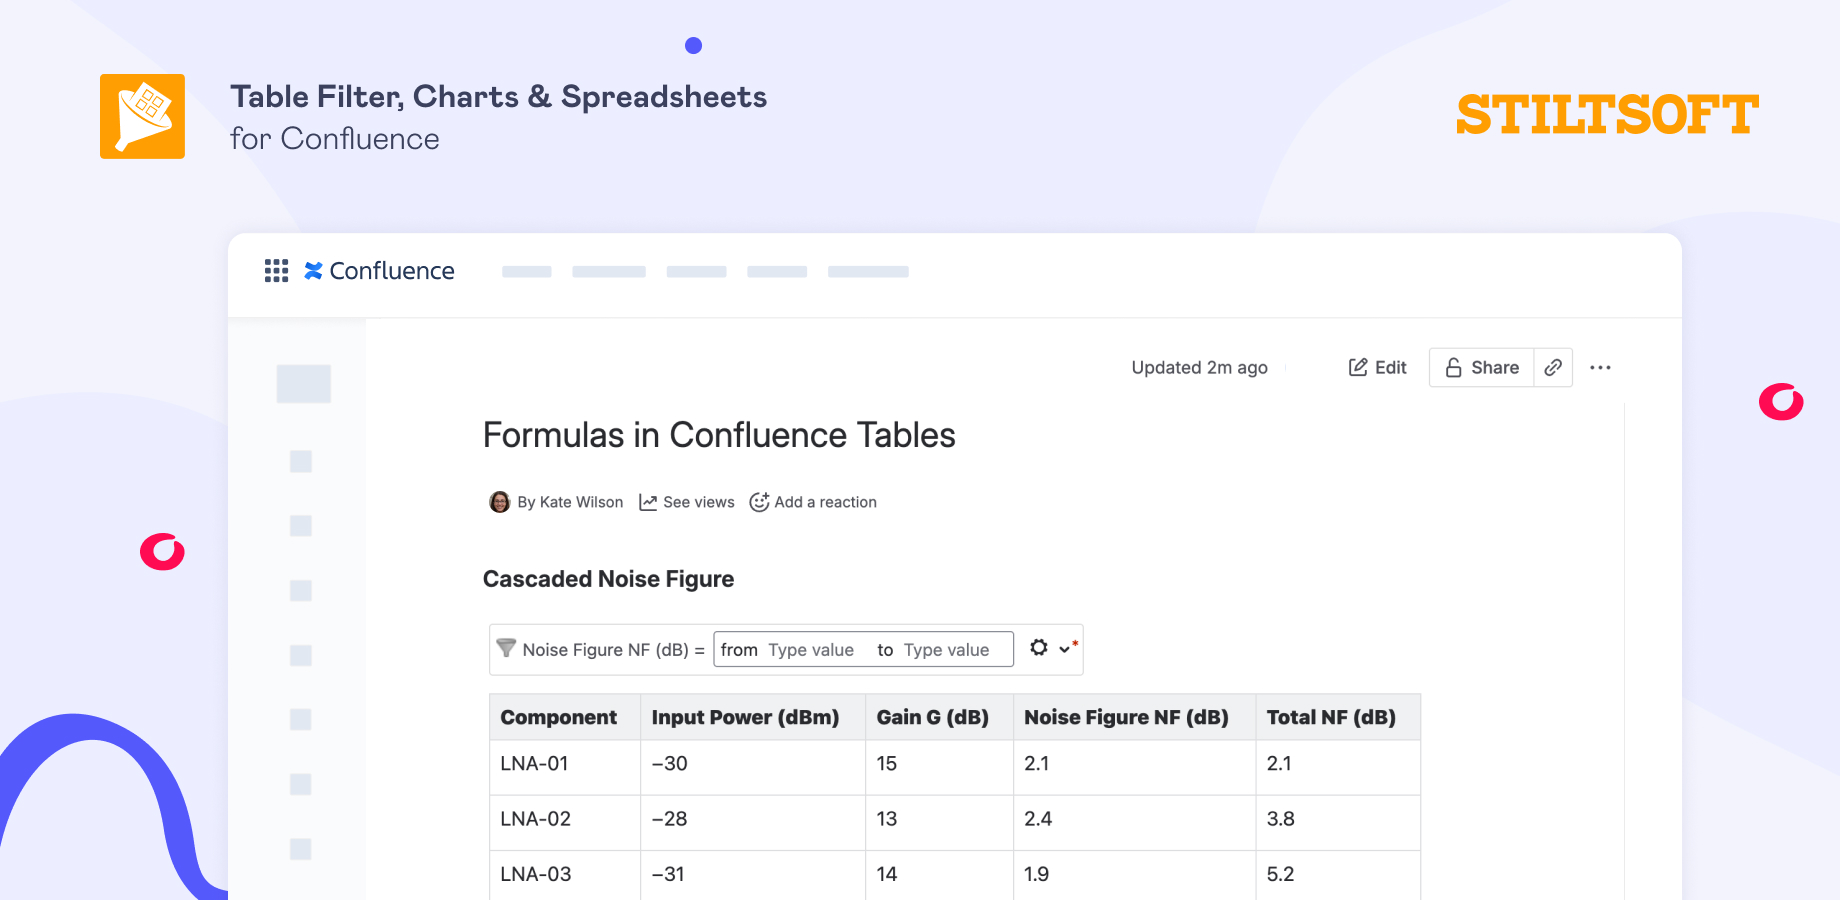
Table Filter, Charts & Spreadsheets extends Confluence tables significantly without replacing them. Wrap any table with the Table Filter macro, and you get:
- Column filters — text search, number ranges, date pickers — so readers can slice large data tables without exporting to Excel
- Totals row — sum, average, min, max calculated automatically per column
- Pivot tables — aggregate and group your table data by any dimension, directly on the page
- Charts — turn table data into bar, line, scatter, or pie charts with a few clicks
- Table Transformer — merge multiple tables, add calculated columns, use SQL queries to reshape data
- Table Spreadsheet — Excel-like spreadsheet with formulas (SUM, AVERAGE, IF, etc.) embedded directly in Confluence
But there’s one thing none of these solve: rendering mathematical notation — the kind of equations that appear in physics papers, engineering specs, and scientific documentation. \frac{d}{dx} or \sum_{i=1}^{n} or \begin{pmatrix} — these require a dedicated LaTeX renderer.
The gap: mathematical notation in and around tables
Here’s the specific scenario many technical teams hit:
You have a Table Filter table with measured or calculated values. The numbers are correct. The table is filterable and clean. But when someone asks “what’s the formula behind the Total NF column?” — there’s no good way by default to document formulas in Confluence tables alongside the data that depends on them.
Confluence doesn’t render LaTeX in table cells by default. You can type the raw LaTeX syntax, but it displays as a string: \frac{NF_2 - 1}{G_1} instead of the actual fraction.
The workaround most teams use is putting a screenshot of an equation in a cell or linking to an external document. Both solutions break down quickly: screenshots don’t export cleanly, they don’t scale, and they’re irritating in dark mode.
The actual fix: LaTeX Math on the same page as your table
LaTeX Math for Confluence adds two macros: an inline formula macro (for equations within a line of text) and a block formula macro (for standalone equations), and renders LaTeX and AsciiMath notation directly on the Confluence page.
The practical workflow looks like this:
- Add your Table Filter table with the numerical data
- Above or below the table, add a LaTeX Math macro with the governing equation
- In plain text, explain the variables and assumptions
For example, a table of component noise figures, with the block formula above it:
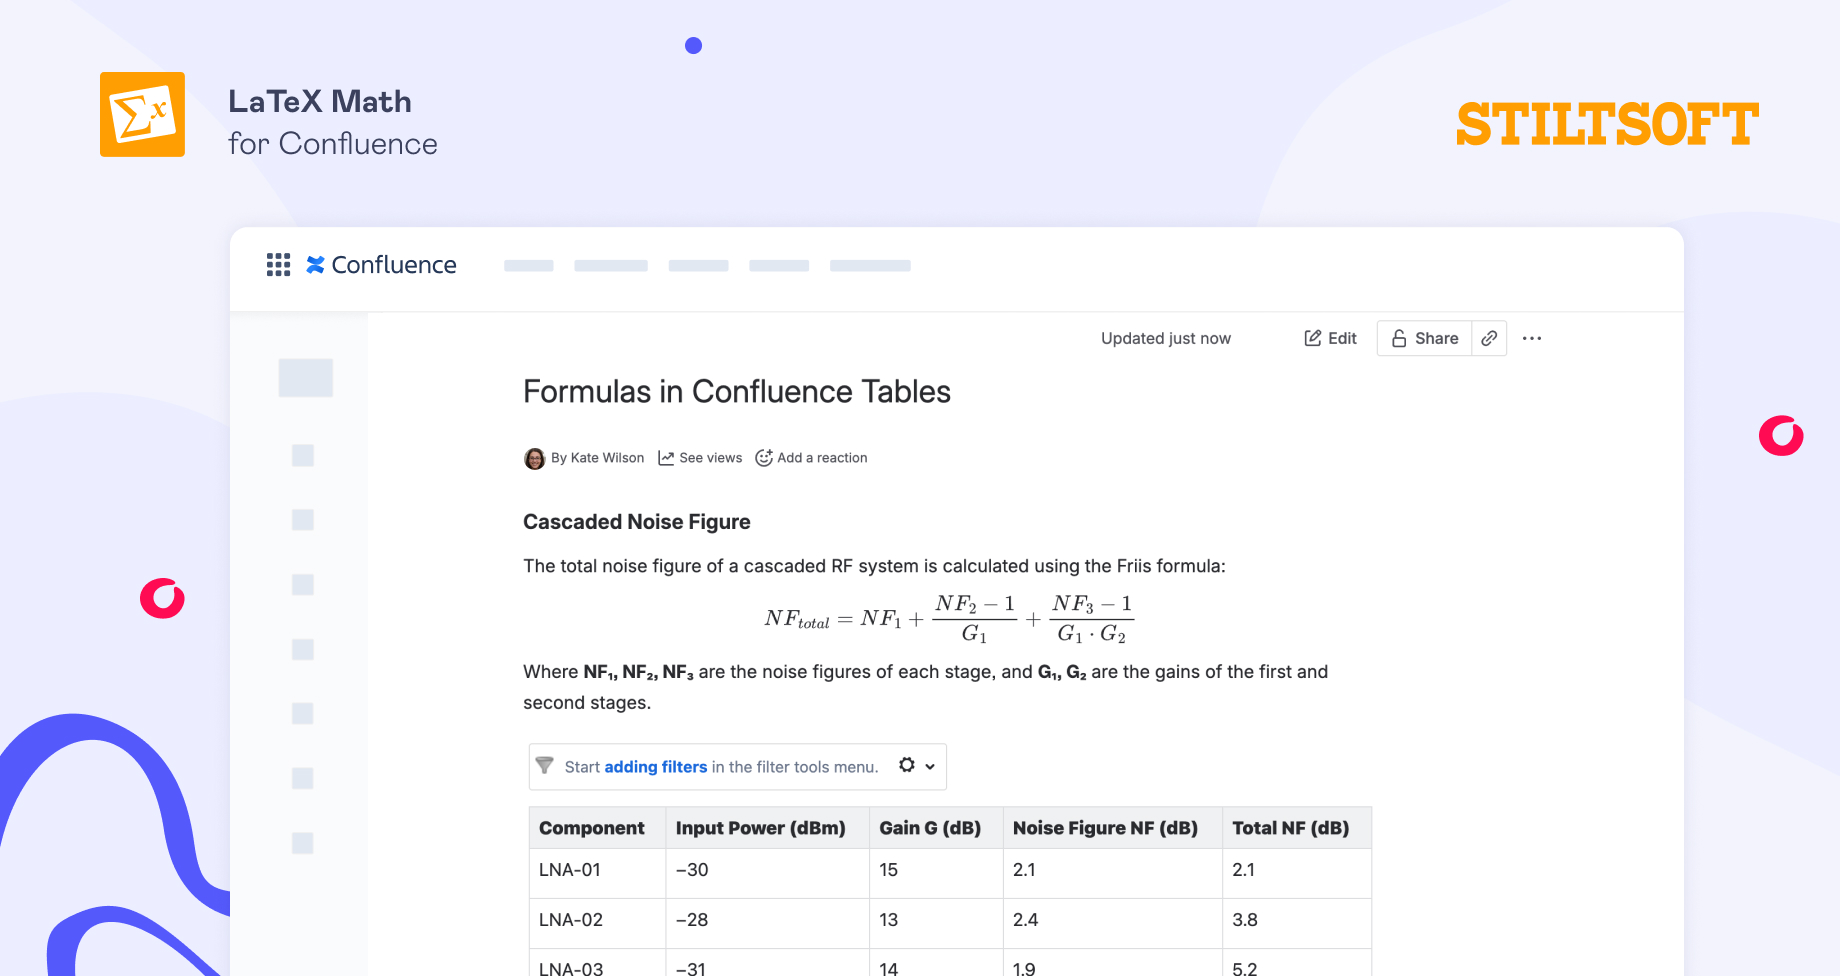
The rendered equation appears on the page exactly as it would in a technical paper. It exports correctly to PDF (via Confluence’s built-in exporter or Scroll PDF Exporter). It works in dark mode. It’s editable by anyone on the team who knows LaTeX.
Formulas inside Table Filter tables: how it actually works
Here’s something that surprises many users: LaTeX Math formulas do render inside table cells, including tables wrapped with the Table Filter macro — so you can use formulas in Confluence tables at the row level, not just as blocks above the data.
You insert a LaTeX Inline Formula or Block Formula macro directly into a table cell. When a Table Filter is applied on top, the formula renders as an image in that cell, and the table behaves as normal: rows can be filtered, columns sorted, and the formulas remain attached to their rows throughout.
For columns that contain LaTeX formulas, Table Filter provides a Visual Filter: you can include or exclude rows based on which formula appears in a cell. This is useful when you have a table where different rows use different equations, and you want to quickly isolate rows by equation type.
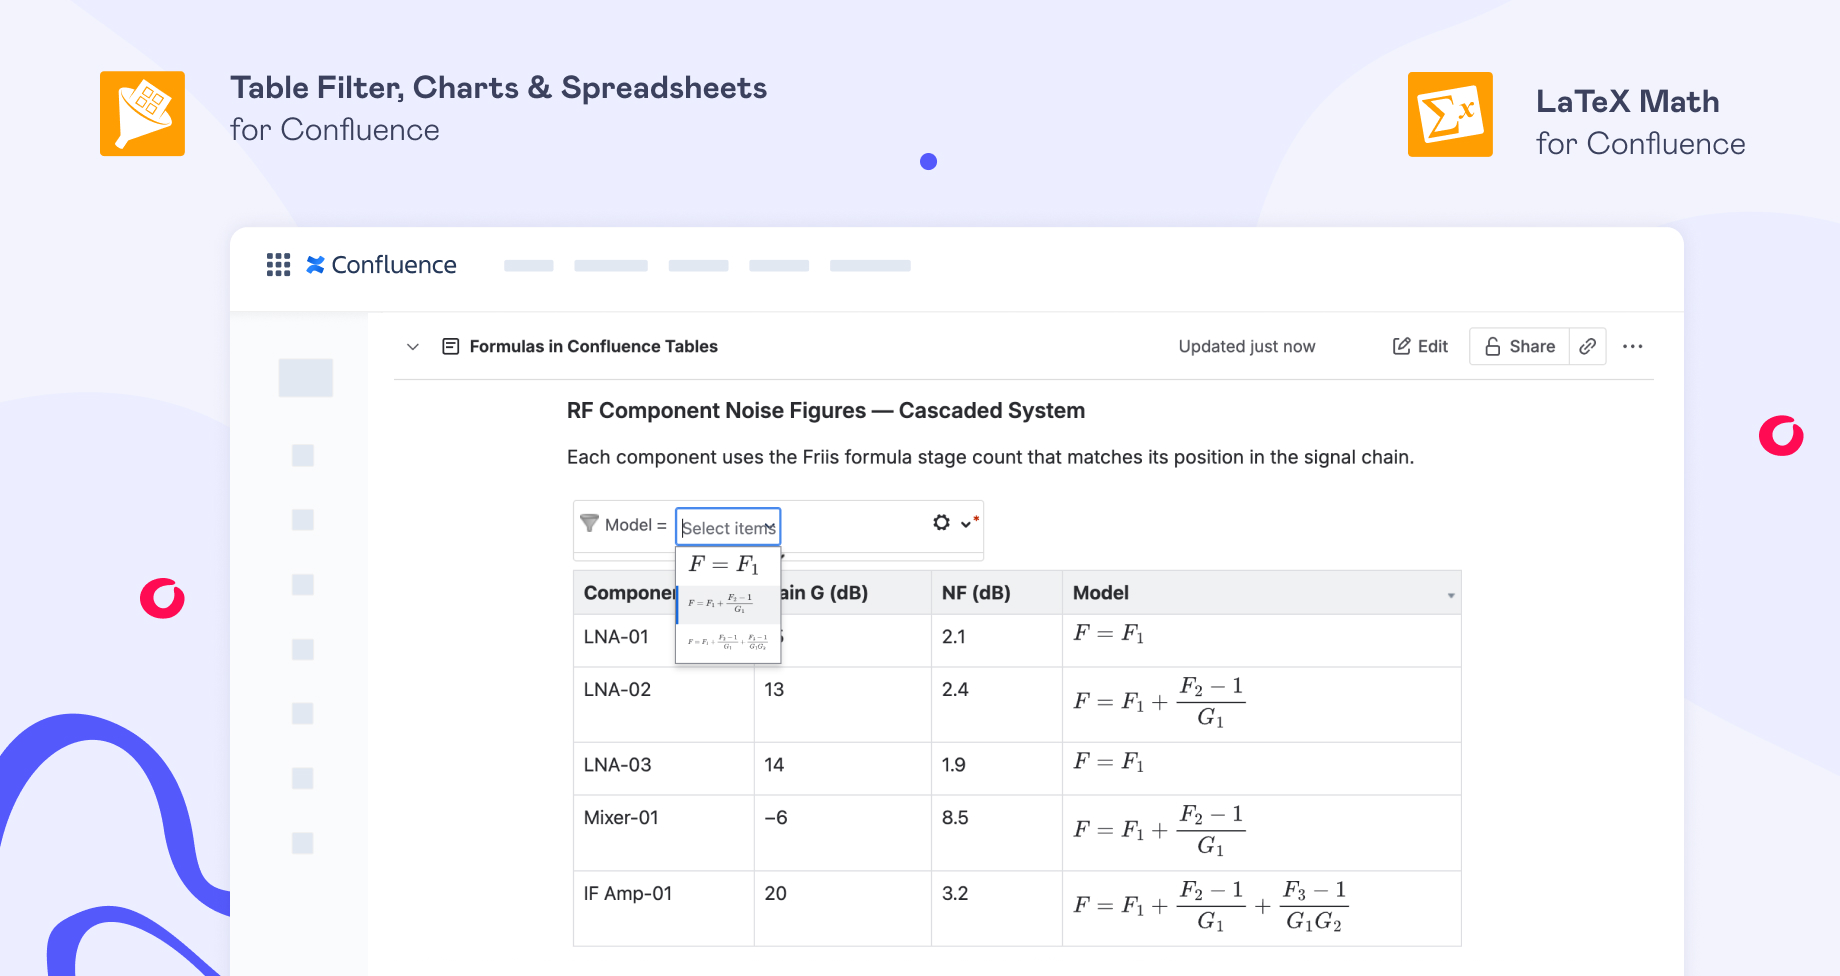
The one thing to be aware of: Table Filter treats formulas as visual elements (images), not as evaluable expressions. It doesn’t calculate or aggregate equation values. For numerical aggregation (sum, average, totals), the data needs to be in a regular numeric column — the formula explaining that data lives alongside it, not in place of it.
Getting started with formulas in Confluence tables
Both apps are built by Stiltsoft and are available on the Atlassian Marketplace for Confluence Cloud. They work together on the same page.
- Table Filter, Charts & Spreadsheets — free 30-day trial
- LaTeX Math for Confluence — free 30-day trial
If your team is already using Table Filter and you’ve been looking for a way to document the math behind your data, LaTeX Math for Confluence takes about five minutes to install and another 1 minute to add your first equation.
Questions about specific use cases? Leave a comment or reach out to our support team.
FAQ
How can I insert formulas in Confluence tables? Confluence doesn’t render mathematical notation in tables by default. However, with a dedicated app for rendering math formulas in Confluence, such as LaTeX Math for Confluence, you can insert an inline or block LaTeX macro directly into any table cell, and the formula will render as a proper equation on your page.
Does LaTeX work inside the Table Filter macro in Confluence? Yes. LaTeX Math formulas render inside tables wrapped with the Table Filter macro. Formulas stay attached to their rows when filtering or sorting. For columns with formulas, Table Filter’s Visual Filter lets you show or hide rows based on which equation appears in a cell.
Do LaTeX formulas export correctly from Confluence to PDF? Yes. Math formulas rendered with LaTeX Math for Confluence export correctly using Confluence’s built-in PDF export and Scroll PDF Exporter. Formulas appear as proper mathematical notation in the exported document, not as plain text or broken images.