







How to Use Working Days and Hours Filter in Awesome Graphs for Bitbucket

Delivery metrics can look misleading when weekend hotfixes, late-night patches, and routine weekday work are measured together. A team may seem slower, busier, or less predictable than it actually is simply because non-working hours are counted the same way as working time.
The upgraded Working Days and Hours Filter in Awesome Graphs for Bitbucket Data Center helps teams separate regular work from exceptions and calculate delivery metrics based on actual working time. You can now narrow engineering analytics not only by selected days, but also by specific activity hours.
Awesome Graphs for Bitbucket is a top-rated analytics tool that visualizes commit and pull request activity, contributor statistics, and delivery metrics in Bitbucket.
The new Working Days and Hours Filter
The Working Days and Hours configuration expands the custom time span selector you already use. By default, Awesome Graphs analytics includes every day and the full 24 hours of the selected period. The filter now lets you apply two constraints on top of that date range: which weekdays to include, as well as start and end times for the hours of activity you want to measure.
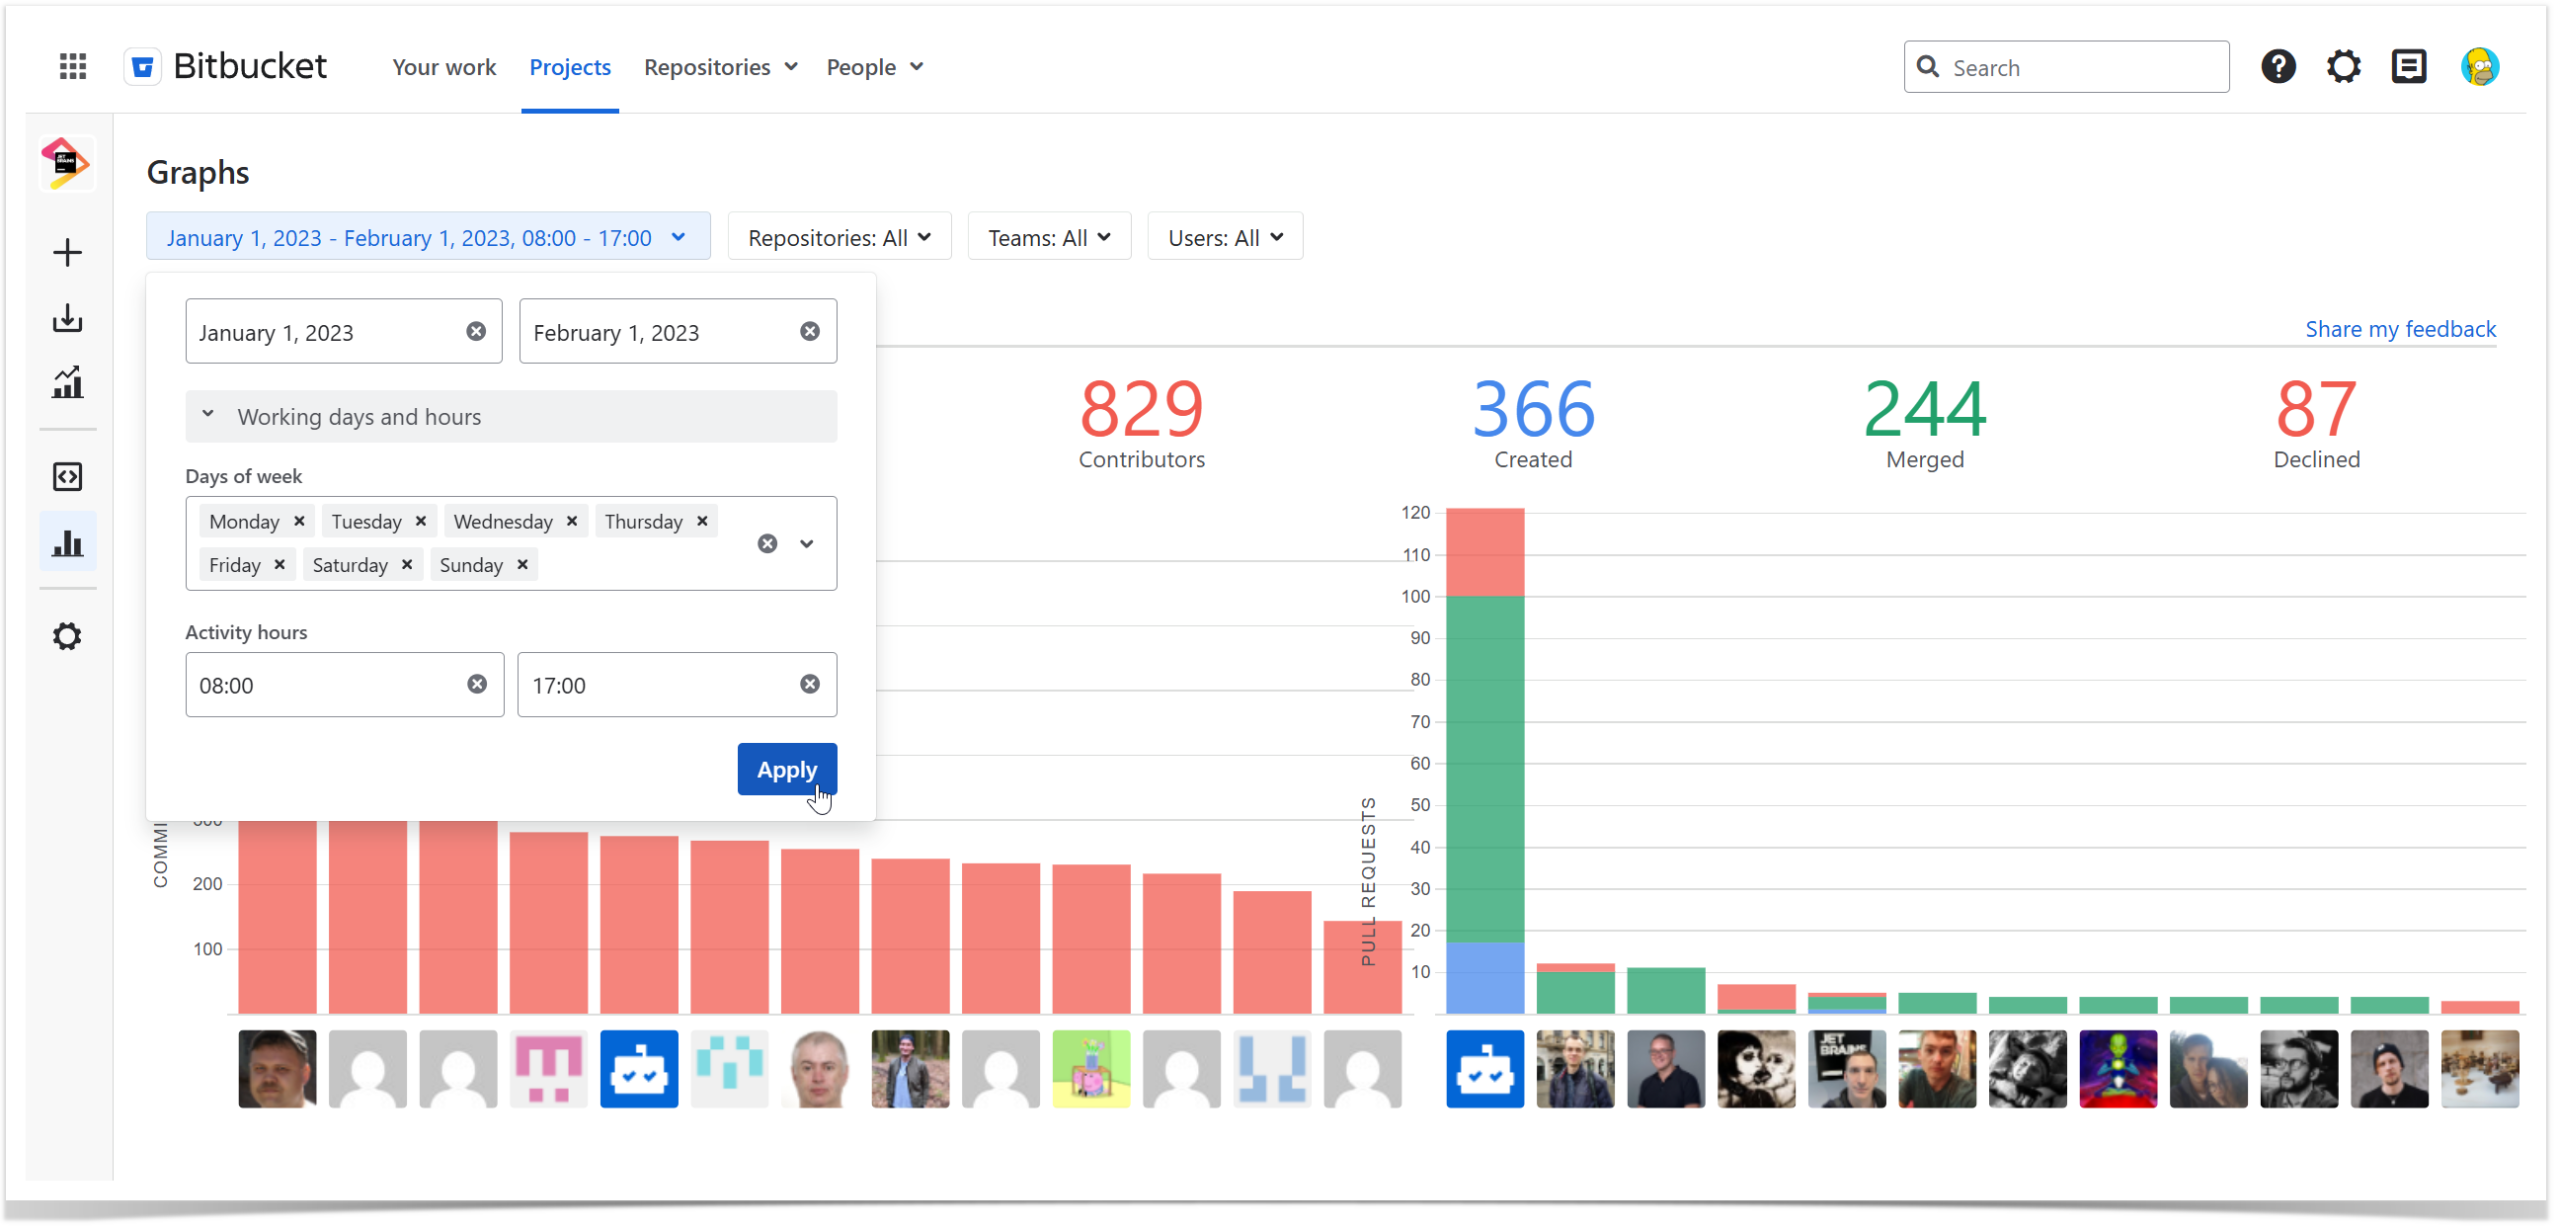
The configuration applies across Graphs, Reports, the People page, and our REST API endpoints. Let’s now explore where this new configuration can prove to be most valuable.
1. Measure accurate cycle time and resolution metrics
Duration-based reports, such as Cycle Time Report, are arguably where the activity-hours expansion delivers the most value for teams that rely heavily on delivery analytics. After configuration, the app will recalculate cycle time using selected working days and hours, excluding time that falls outside them.
For instance, a pull request opened from Friday 16:00 to Monday 10:00, with the filter set to Monday–Friday, 8:00–18:00, will show a cycle time of 4 hours, two hours on Friday afternoon and two on Monday morning, rather than including a full weekend. This more accurately reflects how responsive a team actually is and makes cross-team comparisons more reliable.
2. Measure throughput during working hours
The most direct application is simple: select Monday through Friday, set activity hours to 9:00–17:00, and you get a view of output during standard office hours. This removes the weekend pushes and after-hours one-offs that can inflate or distort statistics, providing a cleaner baseline for engineering managers to rely on with capacity planning and trend analysis.
3. Identify after-hours and weekend work
The same filter can be used in reverse to surface the activity you would otherwise exclude. By setting the hours to evenings and weekends, you can see how much work is occurring outside of business hours. A consistent pattern of late-night commits from the same contributors can be an early indicator of overload or a deadline under strain. Applied thoughtfully, this data can help team leads recognize burnout risk before it escalates.
4. Analyze night shifts and on-call rotations
Because the filter supports ranges that cross midnight, it is possible to set a window of, for example, 18:00–7:00, and Awesome Graphs will adjust to include activity from 18:00 to midnight and from midnight to 7:00. This makes our app even better-suited for reviewing the activity of teams running overnight maintenance, or on-call rotations.
5. Tailor reporting to the local working hours of your team
Because activity hours render in the viewer’s timezone, each regional lead can tailor Awesome Graphs analytics to the needs of their local team. The new filter makes regional reporting easier, as each lead can review activity in the context of their own timezone settings. For global comparisons, teams should agree on how working hours are defined across locations.
How to get it in your Bitbucket
The Working Days and Hours expansion is available now in Awesome Graphs for Bitbucket Data Center. If you already run the app, the option is available in your time span selector with the latest app version. If you are new to Awesome Graphs, you can start a free trial on the Atlassian Marketplace.
More from our blog:
➡️ A guide on setting up permissions configurations in Awesome Graphs for Bitbucket Data Center
➡️ Bitbucket statistics for Commits and Pull Requests available in Awesome Graphs