










Jira Custom Reports: What You Can Build (and Where Jira Falls Short)

Key takeaways
- A custom Jira report can range from a filtered issue list to a cross-project or business dashboard. The right approach depends on the question you need to answer.
- Native Jira features—such as saved filters, dashboards, and built-in reports—cover many project- and Agile-level reporting needs.
- More advanced reporting may require combining data across projects, adding business data, transforming information, or calculating custom metrics.
- This article shows how Jira reporting evolves across five levels, with examples of cross-project and business reports built within the Atlassian ecosystem.
Jira custom reports aren’t all the same: 5 levels of reporting
What counts as a “custom” Jira report depends on the problem you’re trying to solve. Consider three teams:
- Team A wants to see only bugs assigned to them and add a few extra columns.
- Team B wants to monitor delivery across 25 Jira projects.
- Team C wants to compare planned budgets with actual development costs and present the results to executives every Monday.
All three need a custom Jira report—but the level of customization varies widely. Team A mainly needs a different view of existing Jira data. Team B needs to bring data from multiple projects together. Team C needs to combine Jira data with business data and calculations.
These scenarios represent different stages of reporting maturity. As organizations grow, reporting typically evolves from tracking work within a team or project to answering questions across teams, portfolios, budgets, and overall business performance.
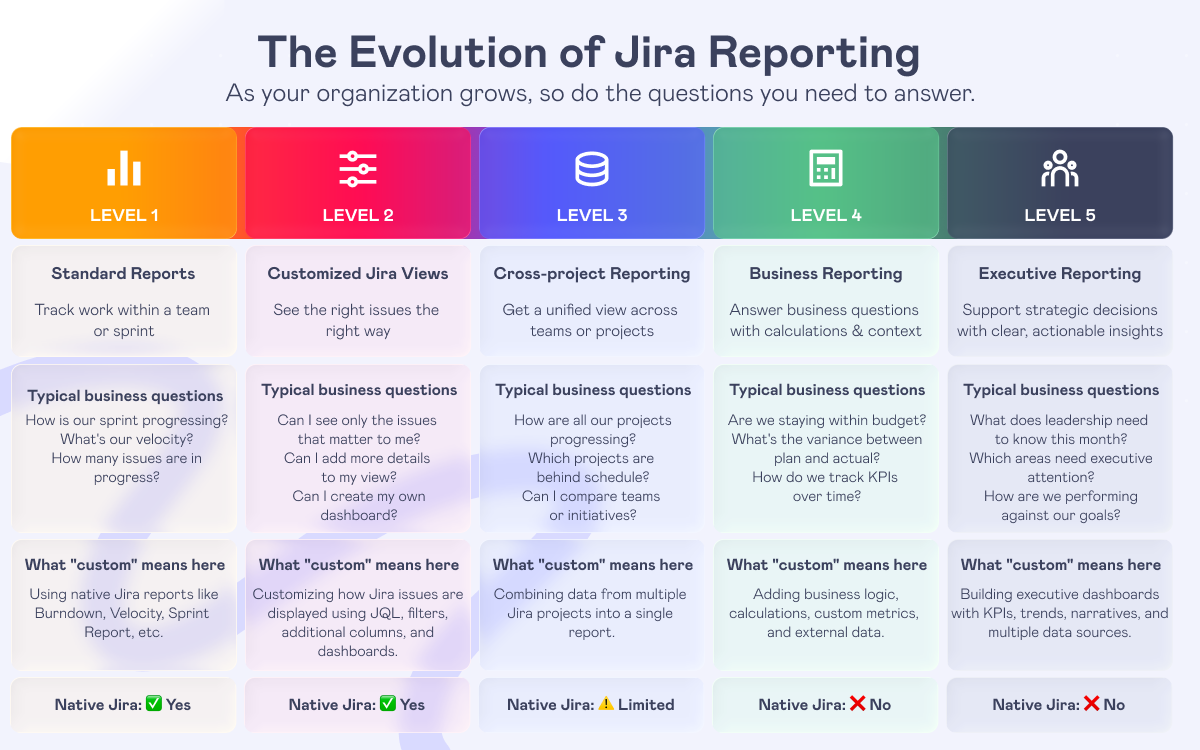
How to create custom reports in Jira?
Customize how Jira data is displayed: Levels 1–2
If your goal is to change how existing Jira data is presented, native Jira functionality is usually enough. Typical reporting tasks at this level include:
- finding a specific set of issues;
- monitoring the progress of a team or sprint;
- tracking work assigned to individuals;
- organizing issues using custom filters and displaying only the fields that matter.
At these levels, you’re customizing the view, not the underlying data. You’re working with the data that already exists in Jira—simply filtering, organizing, and presenting it in the most useful way.
Jira provides three native ways to do this:
Option 1. Create a saved filter
If you need a custom list of issues, start with a filter. Open your project and switch to the List view (or open Filters → Advanced issue search).
You can filter issues either:
- using the visual filter builder, or
- by writing a JQL query.
Once you’re happy with the results, save the query as a Saved Filter. It can then be reused in dashboards, gadgets, boards, and by other team members.
Option 2. Use built-in project reports
Jira also includes a set of built-in reports. These reports cover common scenarios such as sprint progress, team velocity, burndown charts, and cumulative flow.
To access them:
- Company-managed projects: open your project and select Reports from the left sidebar.
- Team-managed projects: if you don’t see Reports, ask your project administrator to enable it in Project settings → Features. Once enabled, the Reports section will appear in the project navigation.
Option 3. Build a dashboard
If you want to combine multiple reports and gadgets into a single view and share reports with your team, create a dashboard. Go to Dashboards → Create dashboard, customize the layout, add the gadgets you need, and configure each gadget to display the data you want to track.
Cross-project and business Jira reporting: Levels 3–5
At this stage, your reporting needs go beyond tracking work within a single Jira project. Instead, you’re trying to answer questions that span multiple teams, projects, or even business systems. At this stage, native Jira reporting is often no longer sufficient, because these reports require capabilities such as:
- Combining data from multiple Jira projects into one custom report.
- Merging Jira data with business data, such as planned budgets or financial information.
- Calculating custom metrics, such as budget variance, percentages, or KPIs.
- Aggregating data by team, project, department, or any other business dimension.
- Presenting different views tailored to executives, PMOs, or other stakeholders.
These reporting requirements represent the shift from project reporting to business reporting.
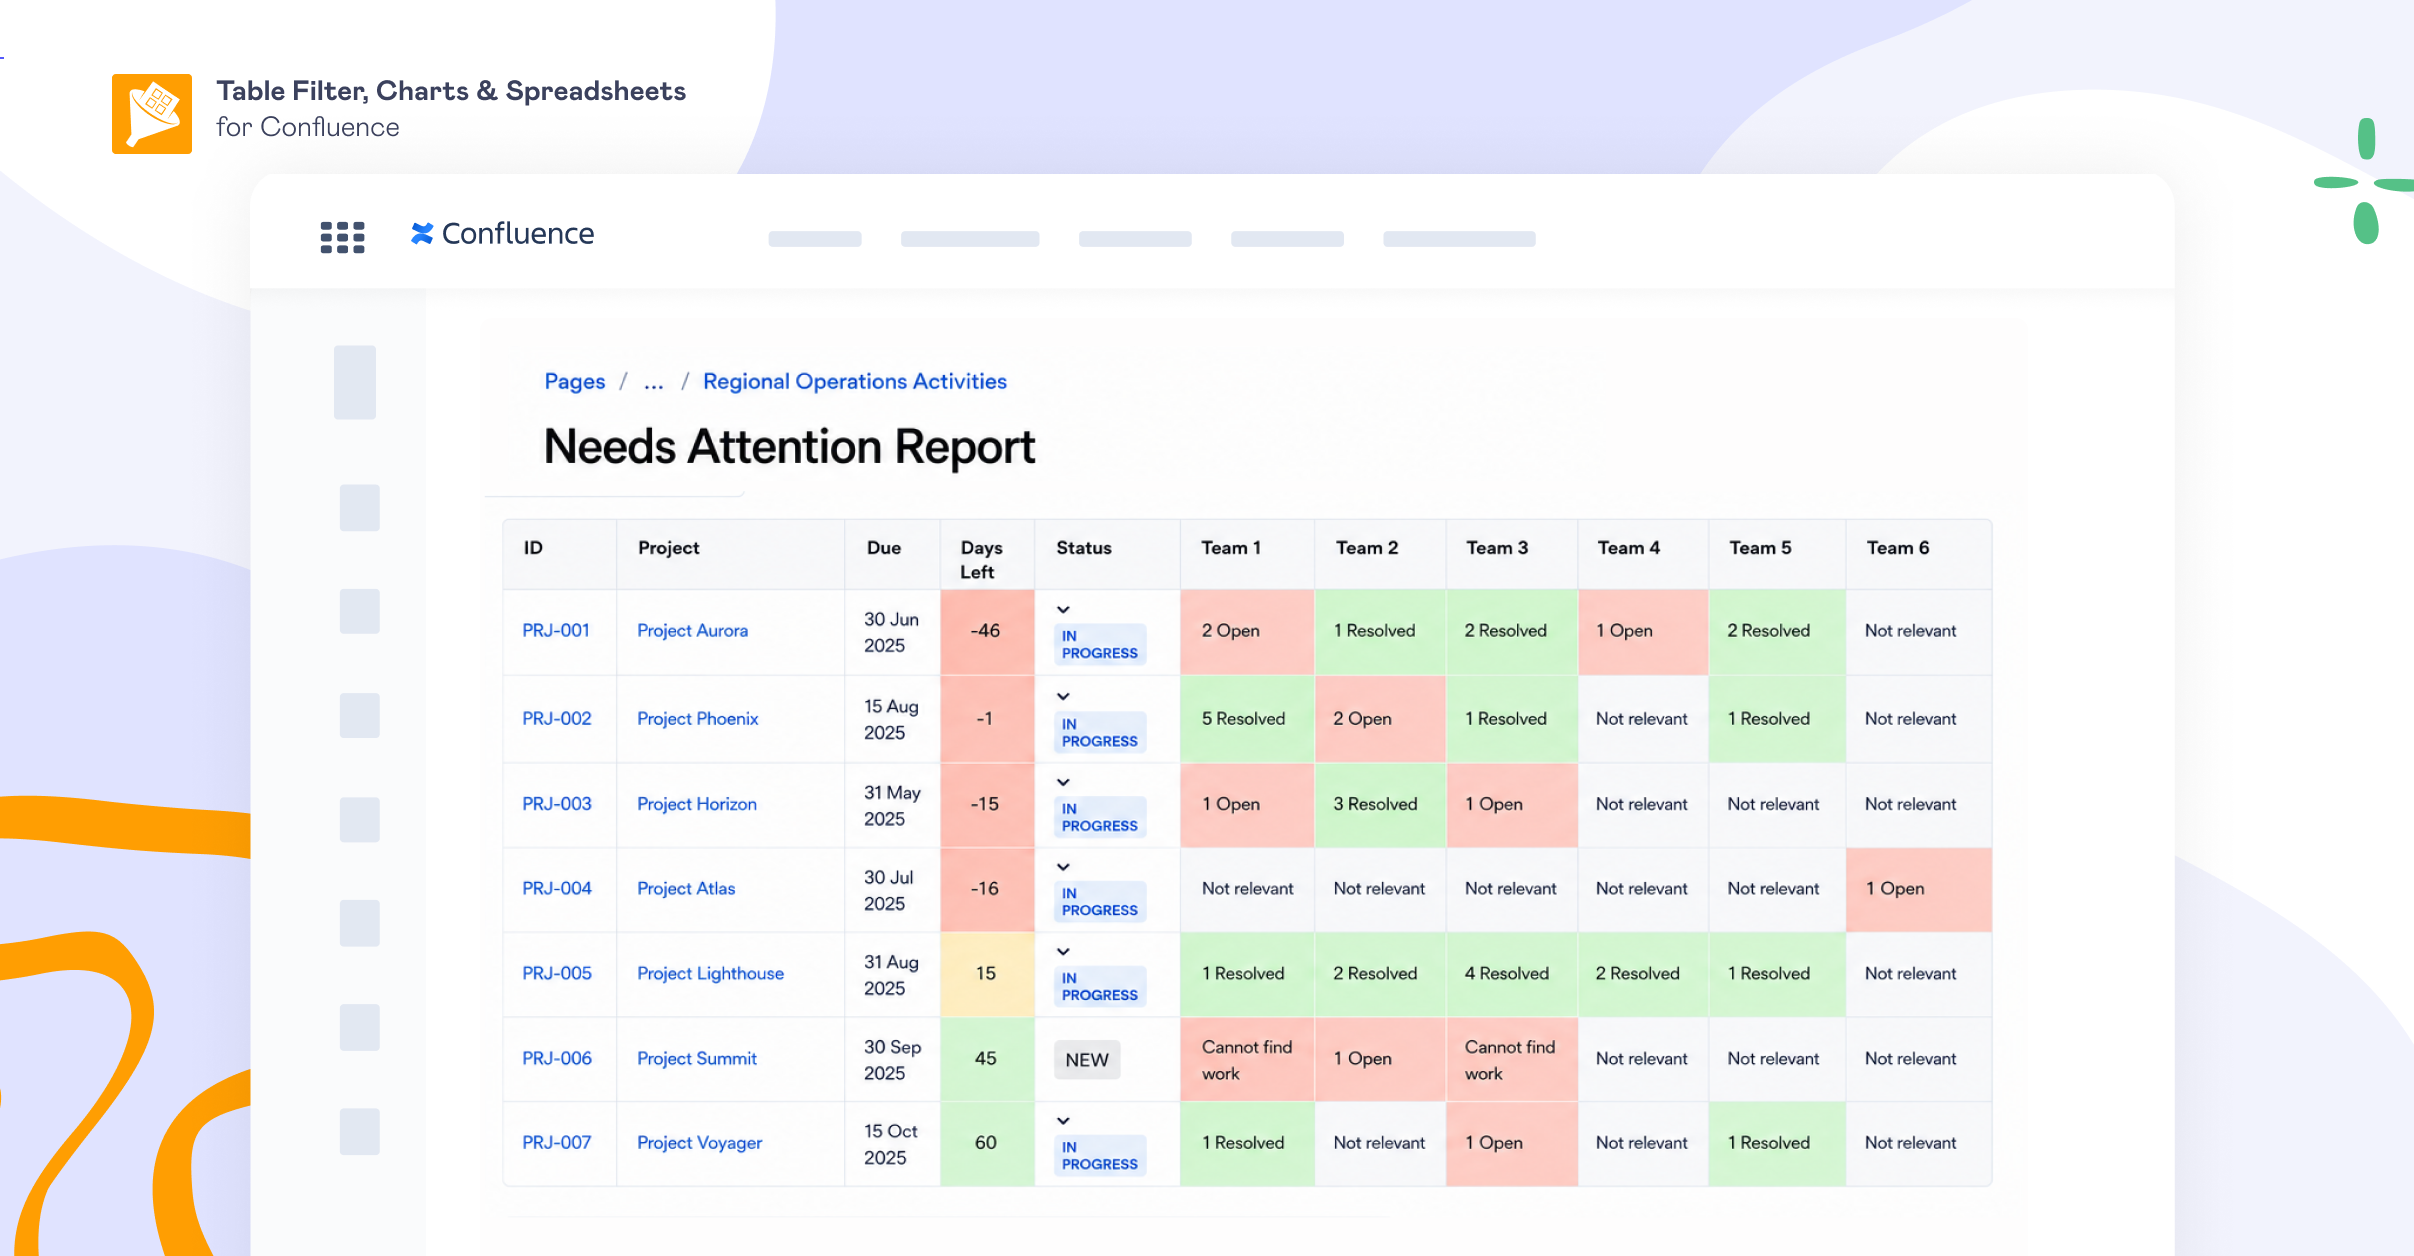
Example 1: A custom cross-project Jira report for 40+ projects
Business question: Which projects need my attention? Where are we stuck? How are all engineering teams performing?
A person manages more than 40 engineering teams, each working in its own Jira project. Opening dozens of Jira boards every morning isn’t realistic, and standard project dashboards don’t provide a portfolio-level view that makes sense for his organization. This is a common challenge for engineering directors and PMOs overseeing multiple teams.
To solve this, he built a single cross-project report—a table with clickable links to Jira issues—that:
- consolidates data from 40+ Jira projects into a single table;
- groups issues, and their statuses by team (business unit);
- highlights overdue work, completed tasks, and areas that require attention using conditional formatting.
Instead of switching between dozens of Jira projects, he gets a single portfolio view organized around the way he manages delivery. This report answers a business question that native Jira reports aren’t designed to answer because it requires combining and transforming data across multiple Jira projects.
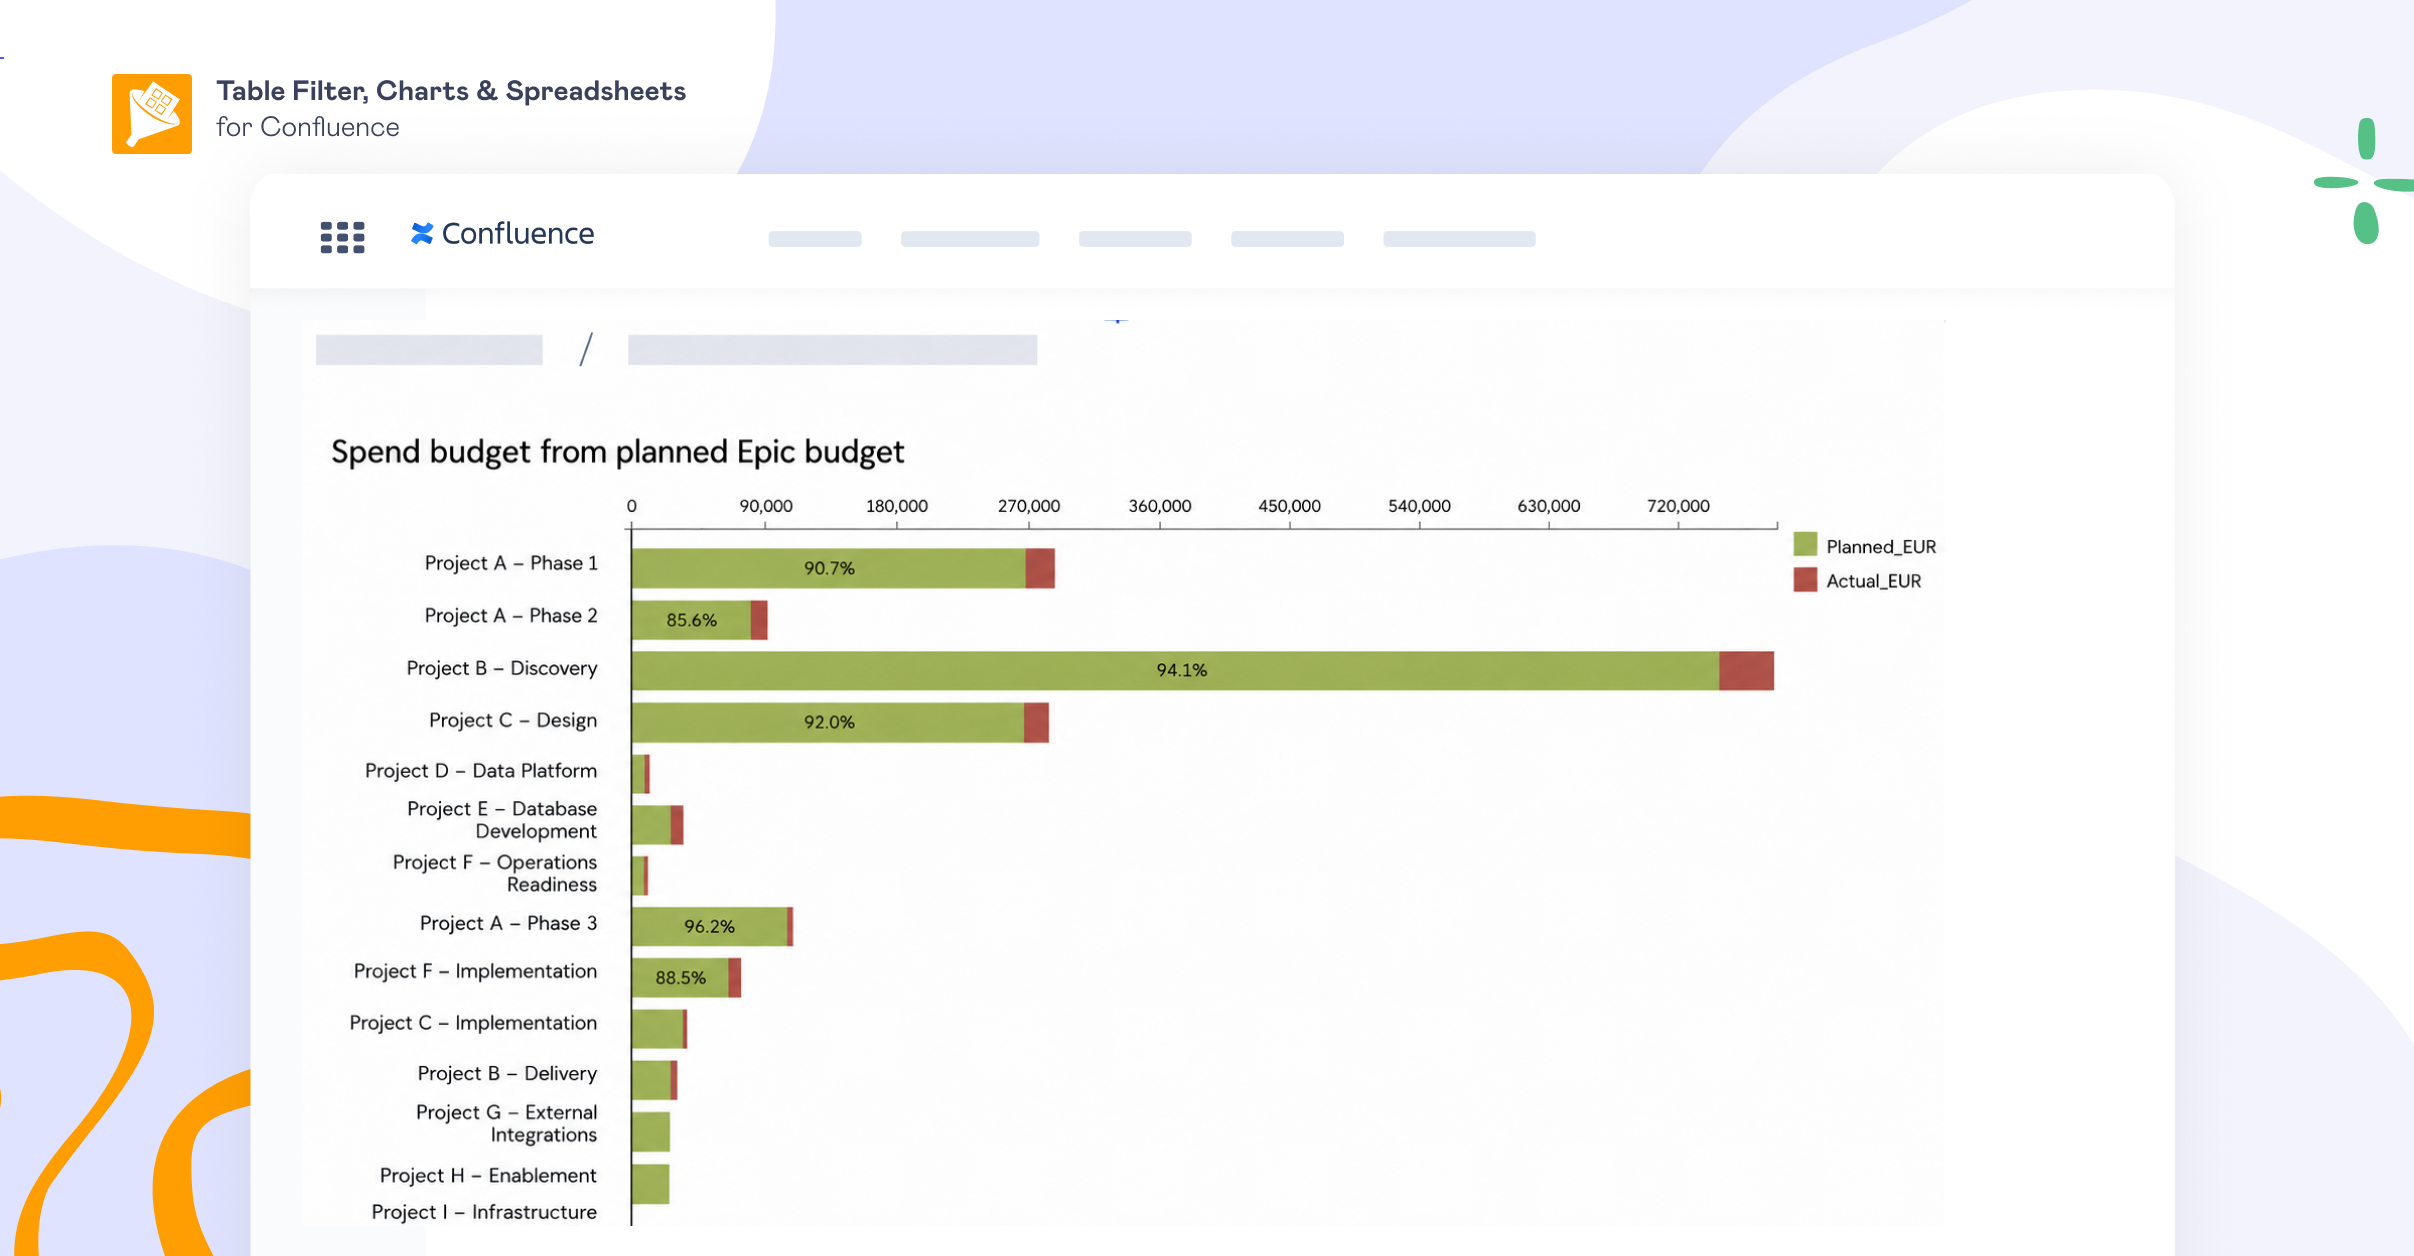
Example 2: A planned vs. actual budget report using Jira data and Excel
Business question: Are we staying within budget?
A person manages 13 applications, each with its own Jira project. In this case, every Jira story has a monetary value, meaning Jira also represents actual project spending. However, planned budgets live outside Jira, making it difficult to compare planned and actual costs without manual exports. So he needed a live budget dashboard that combines planned budgets with actual costs from Jira, allowing to analyze spending across applications, teams, and reporting periods.
To solve this, he built a dashboard that:
- pulls actual costs directly from Jira;
- combines them with planned budgets;
- automatically calculates planned vs. actual spend;
- visualizes budget consumption across all projects in real time.
Instead of exporting Jira data to Excel every week, he and stakeholders always have access to an up-to-date budget dashboard, allowing them to monitor project spending in real time. This report answers a business question that native Jira reports aren’t designed to answer because it requires combining Jira data with business data and performing custom calculations.
How are Jira custom reports like these built?
Step 1. Bring Jira data into Confluence
Both reports are built on a Confluence page using the native Jira work items macro.
But why Confluence? First, if your organization uses Jira, there’s a good chance it already uses Confluence for documentation, project planning, meeting notes, and decision records. Building reports there keeps dashboards alongside the business context instead of separating them into another tool.
Second, many stakeholders don’t work in Jira every day or simply don’t want to. Confluence provides a familiar place where project managers, executives, finance teams, and other business stakeholders can view reports, leave comments, discuss results, and make decisions without having to navigate Jira. Jira permissions and Confluence page restrictions still apply, so sensitive data remains protected and access is limited based on users’ existing permissions.
Step 2. Transform the data
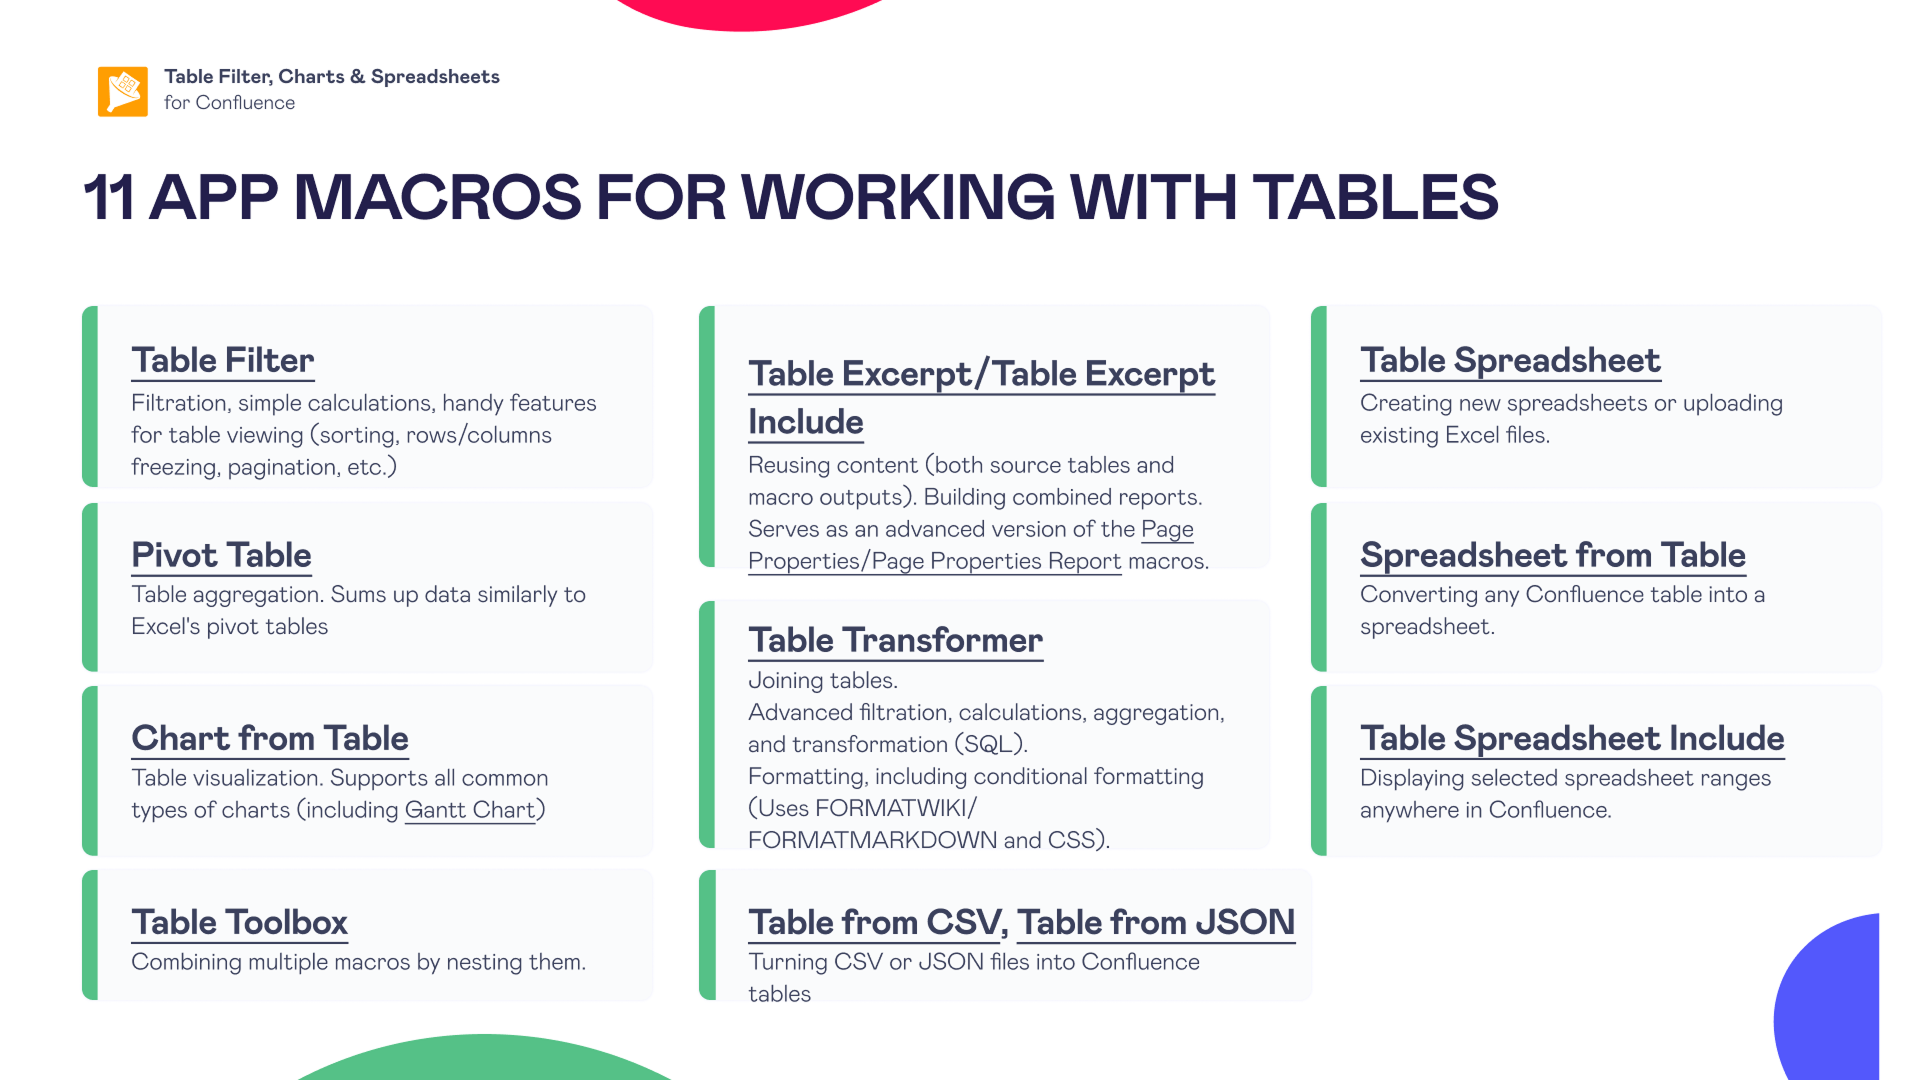
Once the Jira data is available on the page, it can be transformed using Table Filter, Charts & Spreadsheets for Confluence. This is where the report becomes custom. The app provides a collection of macros that work as building blocks for creating custom reports.
For these cases, the following macros were used:
- Table Transformer merges, joins, reshapes, and calculates data.
- Pivot Table aggregates information by team, project, sprint, status, department, or any other business dimension.
- Chart from Table turns the processed data into interactive charts.
Rather than thinking of these as separate features, think of them as LEGO bricks—you combine them in different ways depending on the business question you’re trying to answer. Because these macros work together, you’re not limited to predefined report templates. You can build reports around how your organization works, rather than how Jira stores data.
What is Table Filter, Charts & Spreadsheets?
Table Filter, Charts & Spreadsheets is a Confluence app for working with and reporting on table data. It extends native Confluence tables with tools for filtering, transforming, calculating, visualizing, and combining data from multiple sources.
Teams can use it to build interactive reports, dashboards, catalogs, and Excel-like spreadsheets directly in Confluence. It works with multiple sources, including native Confluence tables, Jira issues, CSV, JSON, and Excel files.
For Jira reporting, this means you can combine operational data from Jira with business data from other sources, transform it, calculate custom metrics, and turn the results into reports that match the way your organization works—all within the Atlassian ecosystem. Watch the overview below to see how it works:
FAQ
How do I create custom reports in Jira?
It depends on what you mean by custom Jira reports. If you simply want to change how existing Jira data is displayed—for example, filter issues, add columns, build dashboards, or track sprint progress—native Jira features are usually enough. You can use Saved Filters, Reports, and Dashboards. If you need to combine multiple Jira projects, merge Jira with business data, and calculate custom metrics, standard Jira reports, and dashboards become limited for these scenarios.
What are Jira’s native reporting limitations? When do I need an app?
Native Jira reporting works well for team-level reports but becomes more limited for cross-project, portfolio, or business reporting. Typical limitations include:
- combining data from multiple Jira projects into one custom report;
- merging Jira data with external business data, such as budgets or financial information;
- creating custom calculations and KPIs;
If you need any of the above, pull Jira issue data into Confluence using the native Jira work items macro. Then use Table Filter, Charts & Spreadsheets for Confluence macros to transform, combine, and visualize the data the way you need.
Can I combine multiple Jira projects into one report? How do I create portfolio reports?
Yes. First, bring Jira data into a Confluence page using the native Jira work items macro. Then use the Table Transformer macro from Table Filter, Charts & Spreadsheets for Confluence to merge, join, reshape, and calculate Jira data from multiple projects. You can then use the Pivot Table and the Chart from Table macros to summarize the data and create cross-project or portfolio reports.
Can I use calculated fields in Jira reports?
Native Jira reporting has limited support for calculated metrics beyond its built-in reports. If you need custom KPIs, percentages, and ratios, financial metrics, or calculated summary values, bring Jira issue data into Confluence using the native Jira work items macro. Add the Table Transformer macro from Table Filter, Charts & Spreadsheets for Confluence to the page, insert your Jira data into it, and use an SQL query to create calculated fields and metrics. You can then summarize or visualize the results with the Pivot Table or the Chart from table macros.
